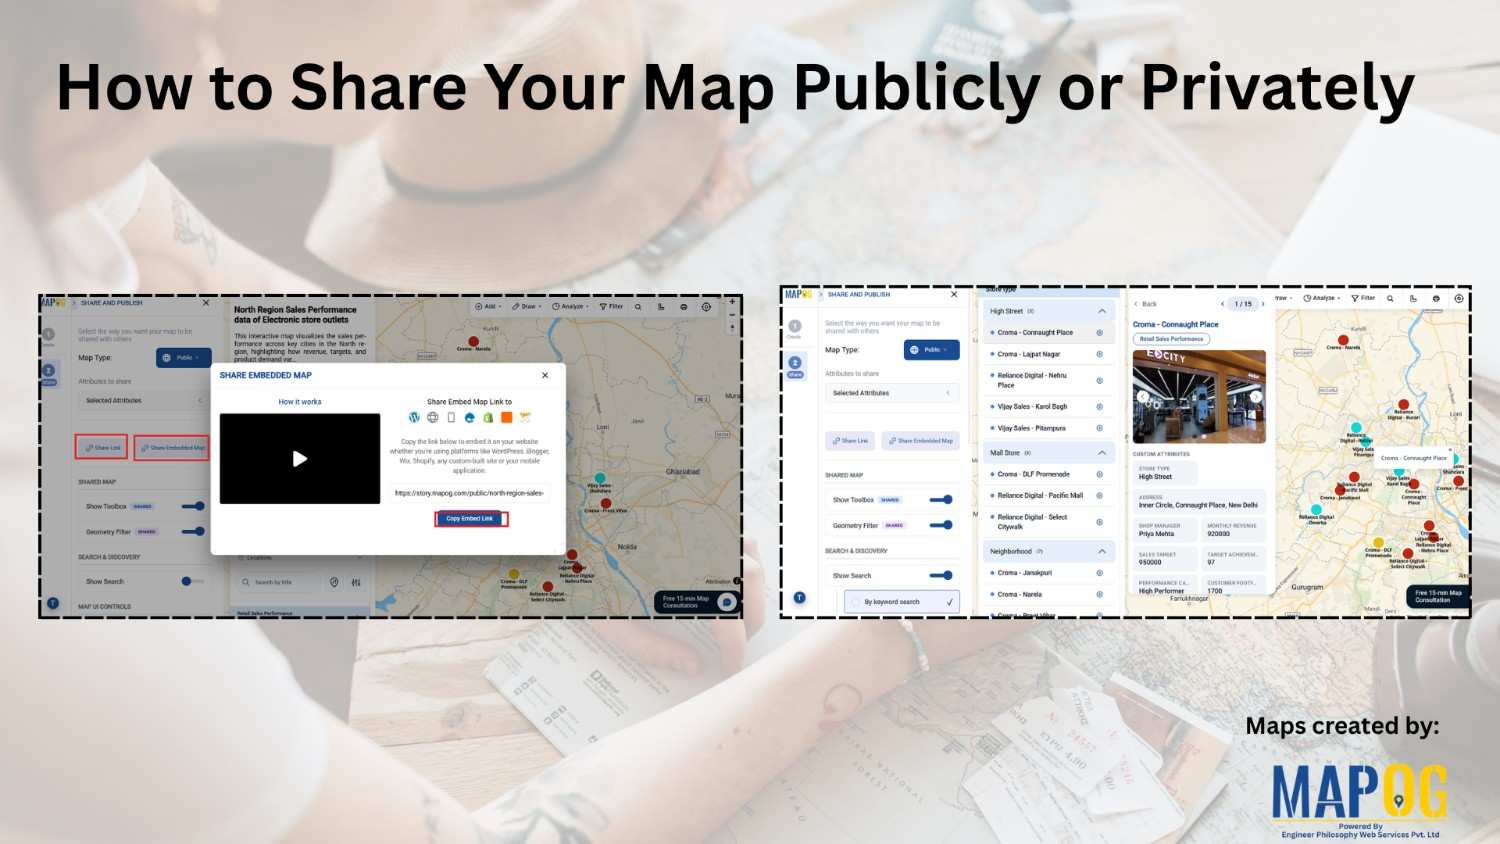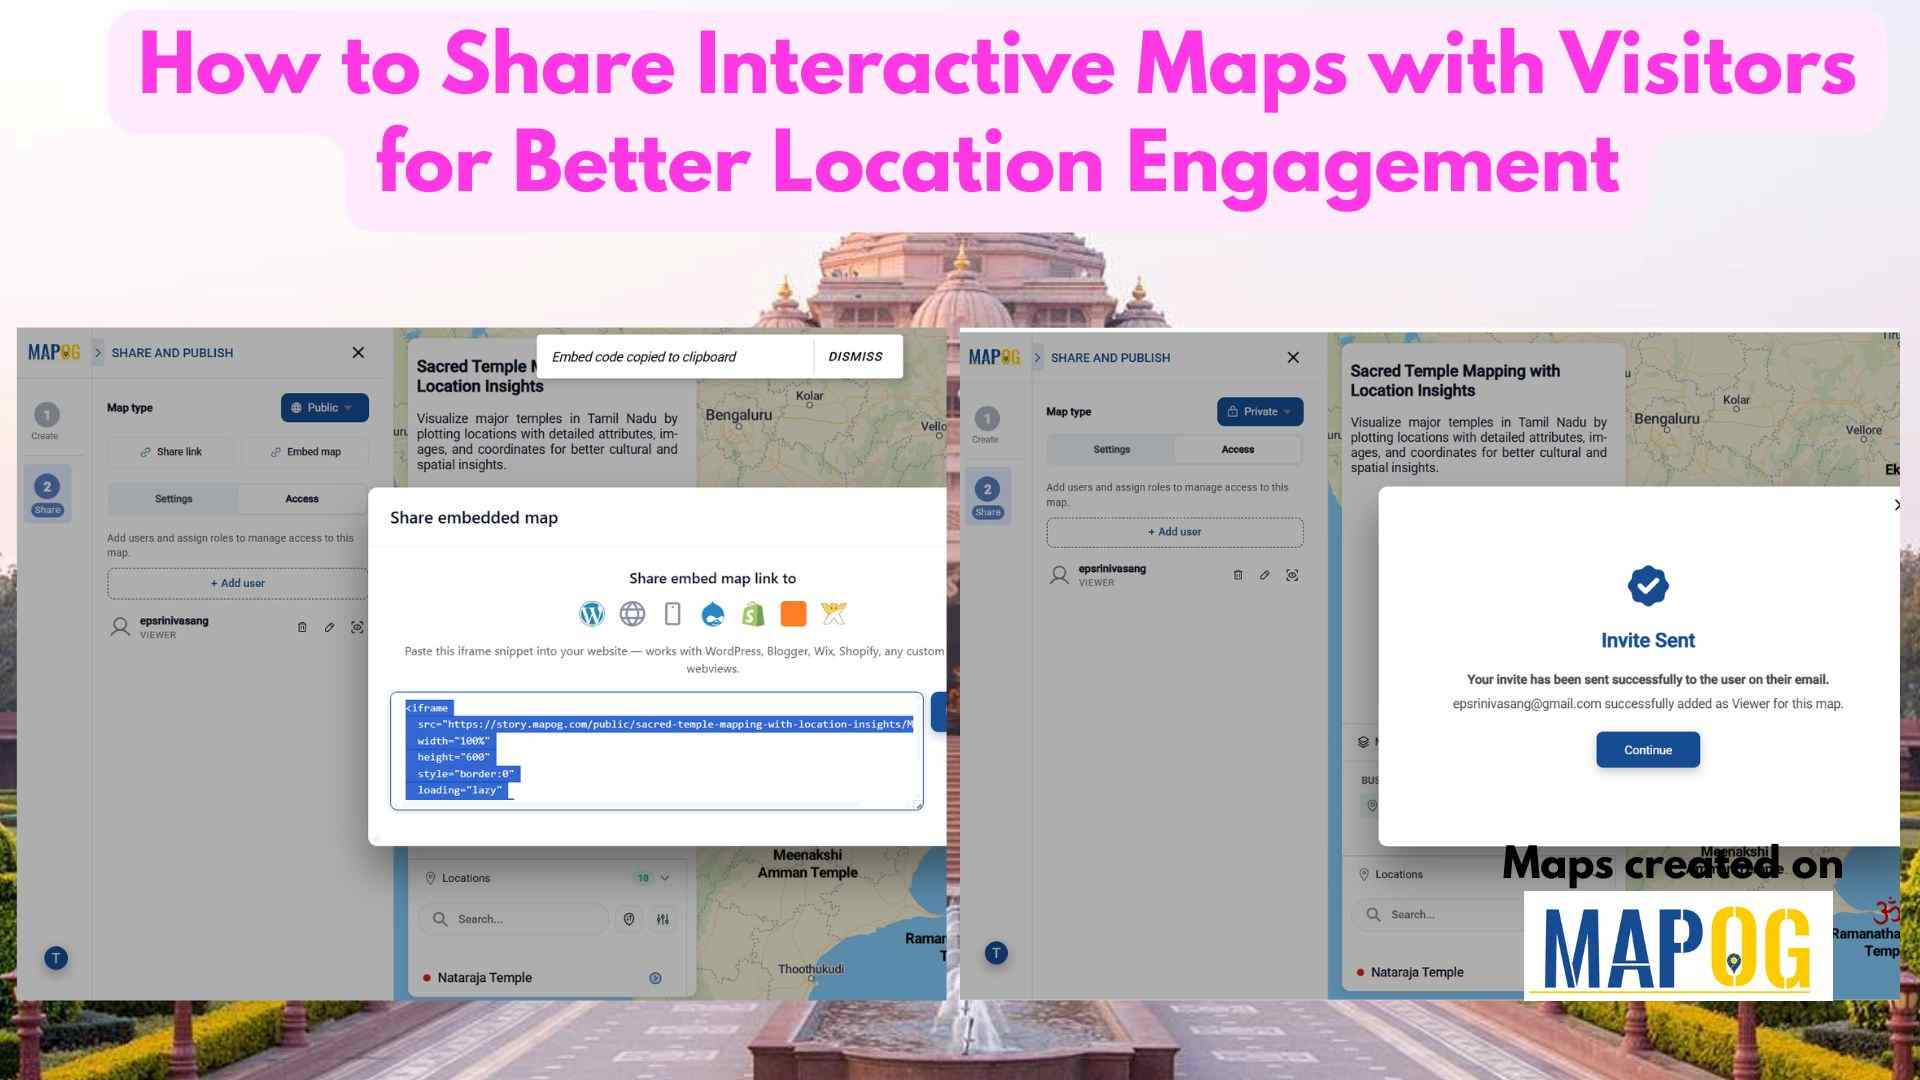
How to Share Interactive Maps with Visitors for Better Location Engagement
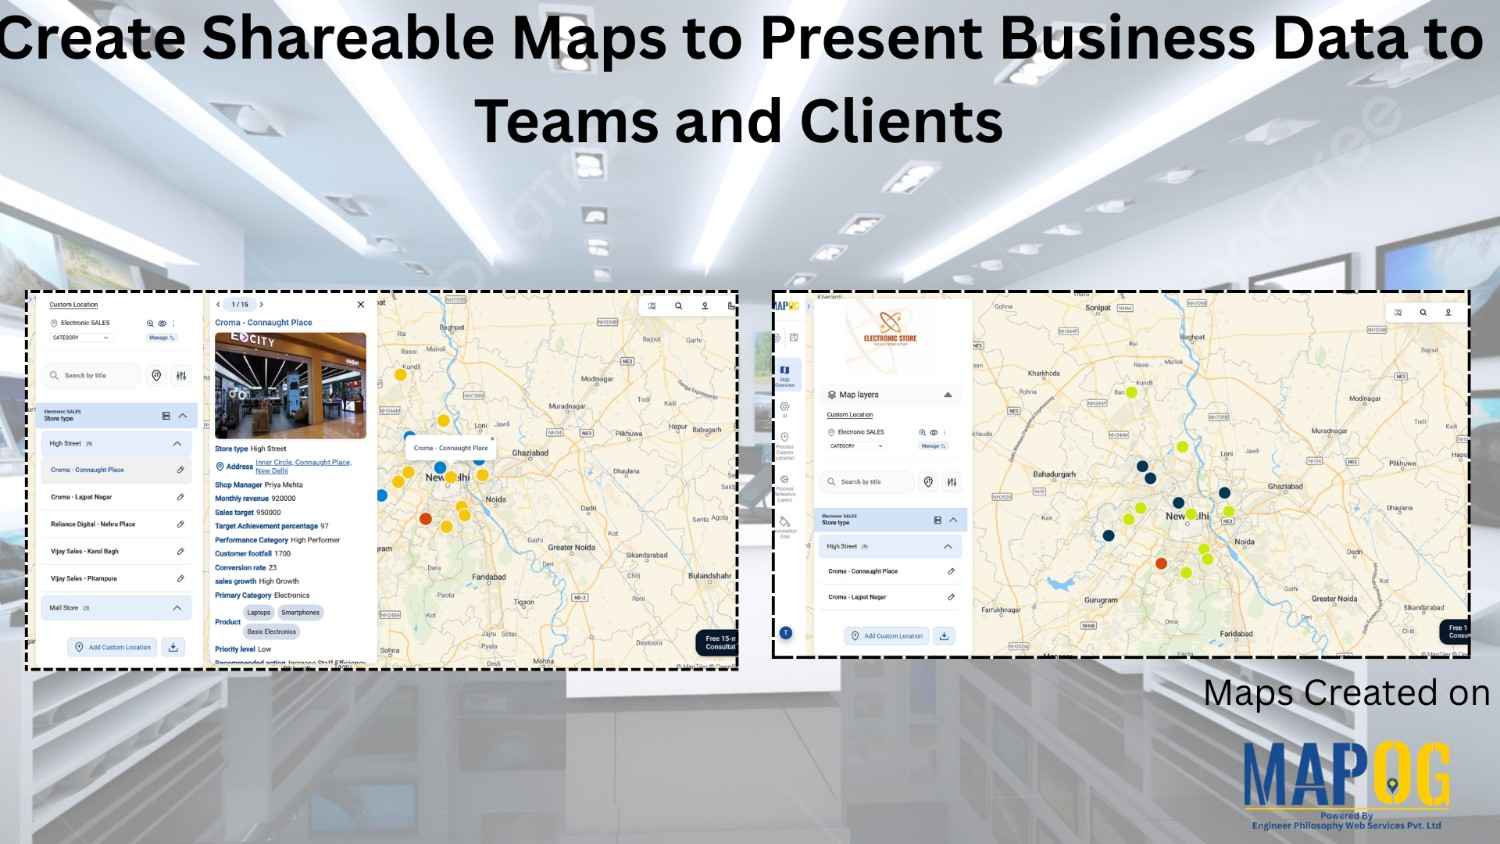
Share Interactive Maps with Visitors securely is a common challenge in today’s collaborative and data-driven environment, where sharing location intelligence is just as important as creating it. Static screenshots or exported files often fall short—they lose context, interactivity, and control. That’s where secure Interactive map sharing becomes essential. By enabling teams and clients to explore … Read more