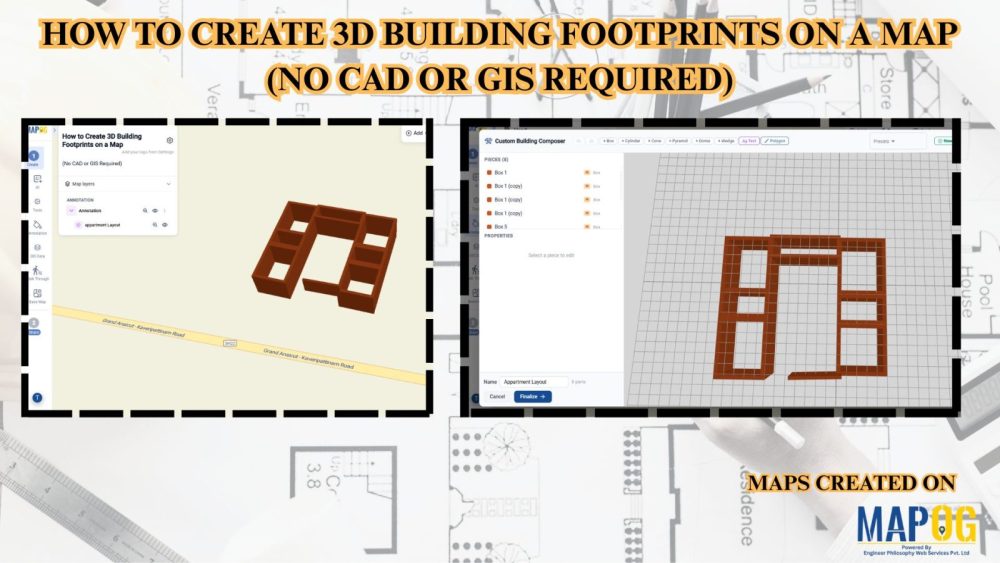
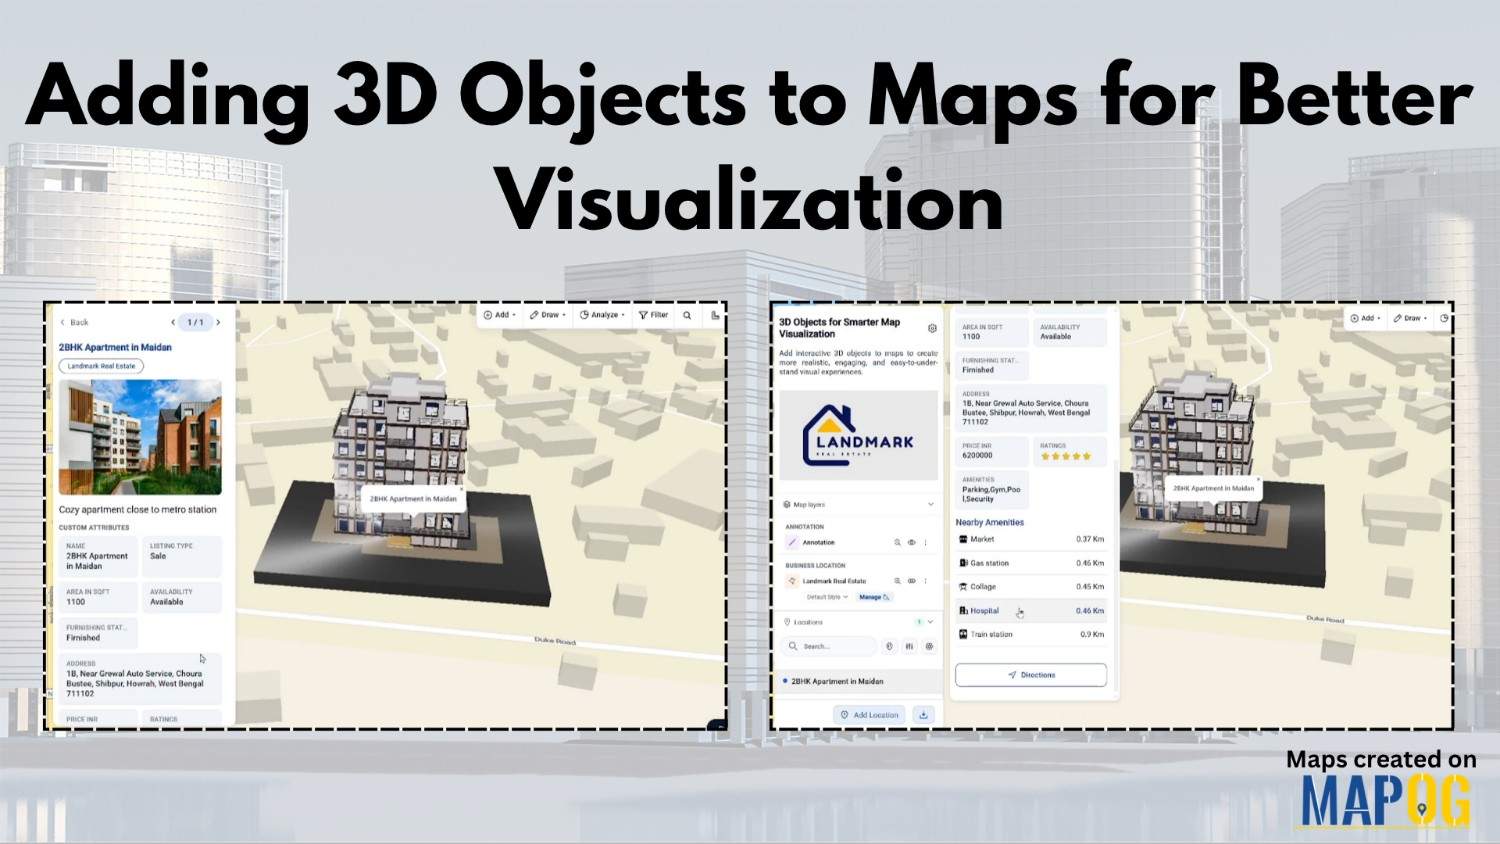
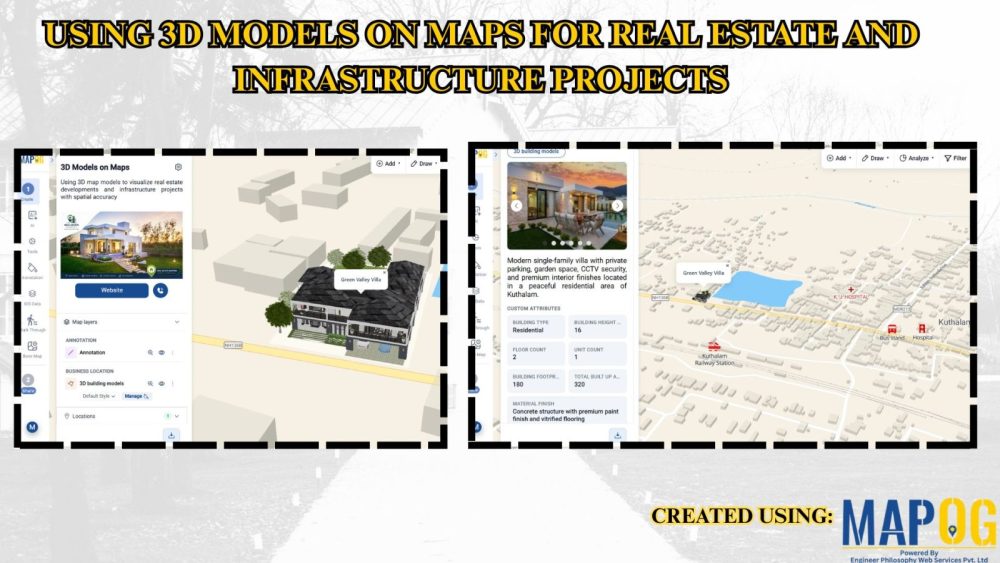
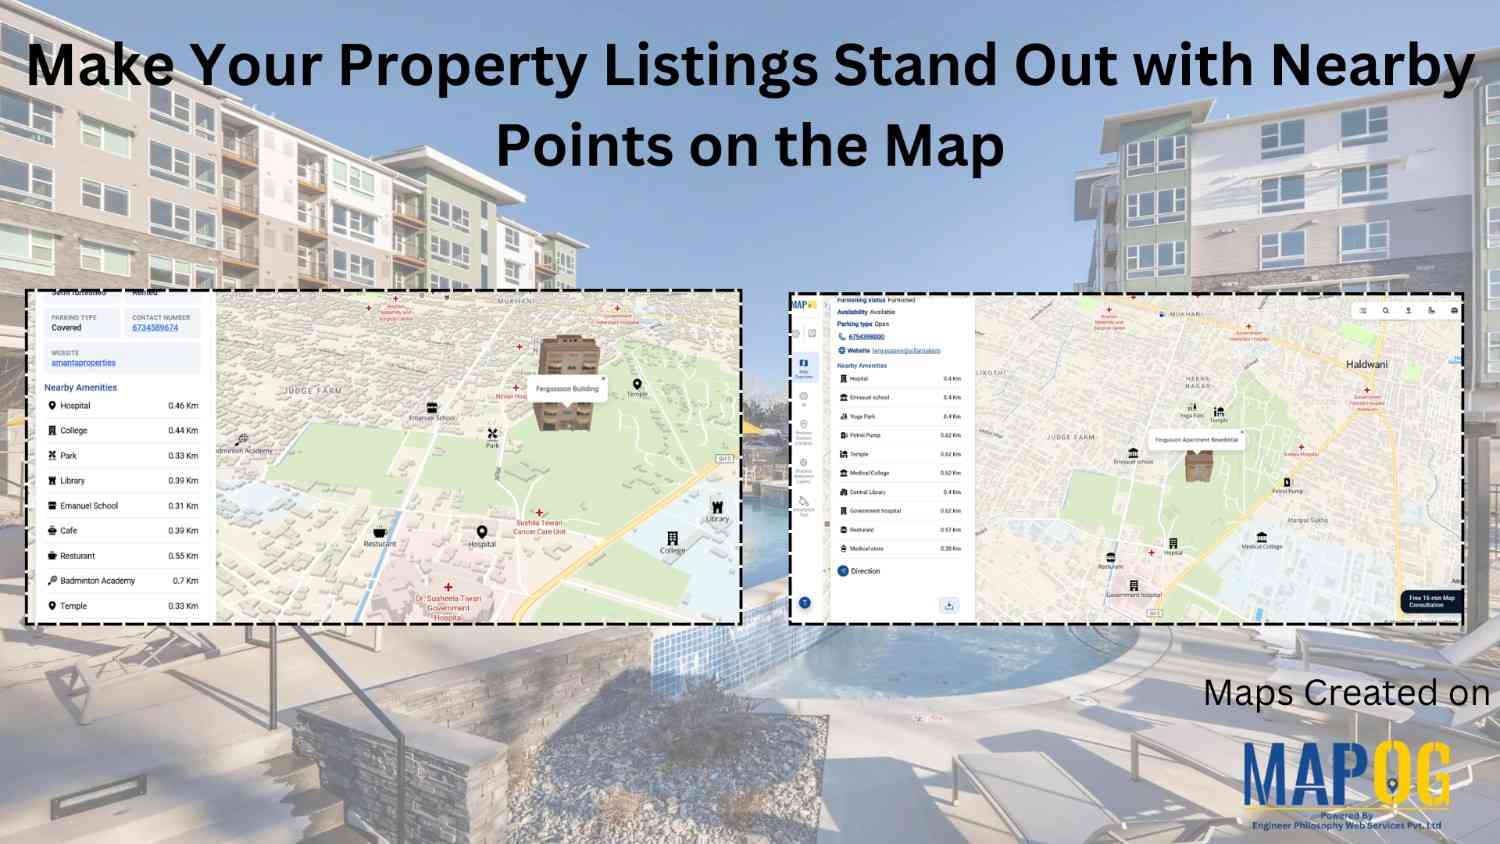
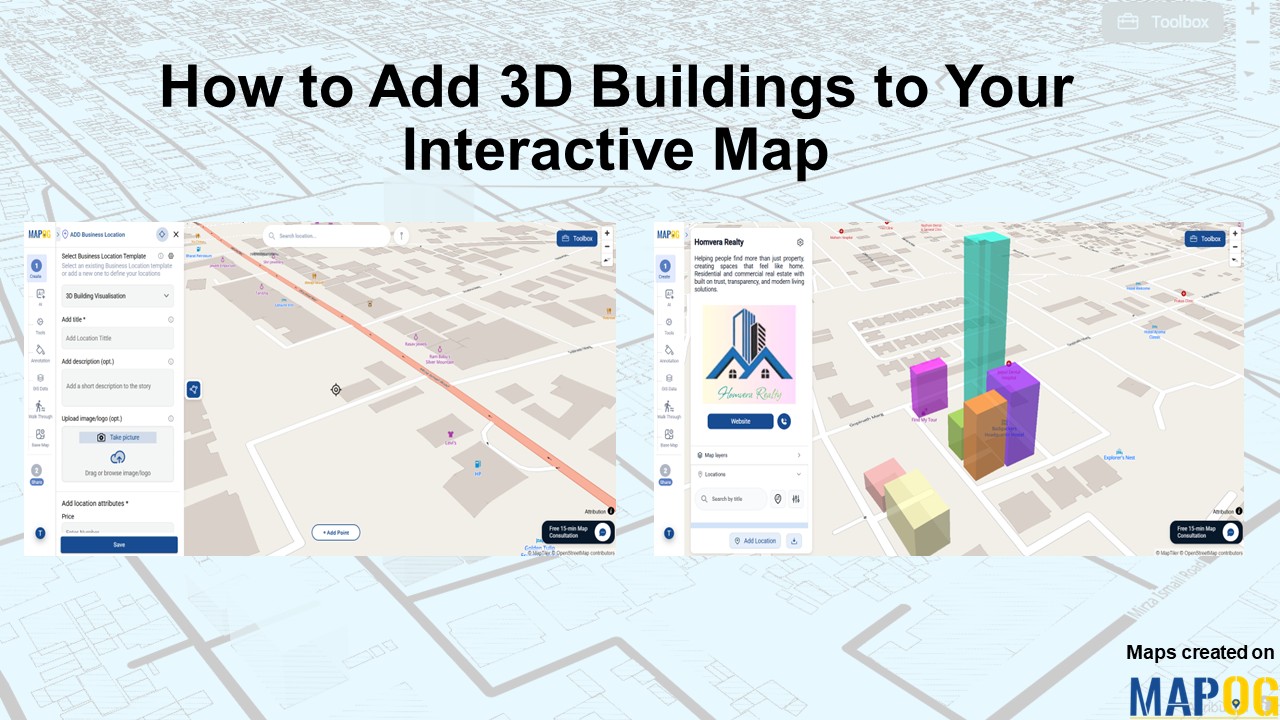
Real Estate

Build a Real Estate Project Portfolio on an Interactive Map

Build a Real Estate Project Portfolio on an Interactive Map

In the Real Estate Project Portfolio industry, spreadsheets limit visibility and location context. Flat listings reduce projects to rows, hiding regional spread and stage differences. MAPOG solves this by turning project data into an interactive map portfolio, enabling clearer comparison, quick insights, and better portfolio management. Key Concept: Real Estate Project Portfolio Interactive maps display all … Read more

upload property listings on a map

Upload Property Listings on a Map with Images and Full Details 

Finding the right property can be frustrating with scattered listings, unclear locations, limited visuals, and incomplete details often leave buyers confused and overwhelmed. A smarter solution is to upload property listings on a map with images and full details using MAPOG. By combining precise location pins with high-quality visuals, pricing, descriptions, and key features, real … Read more

Show a Property Location with Nearby Amenities on a Shareable Map

Show a Property Location with Nearby Amenities on a Shareable Map

In real estate, scattered property data makes comparison difficult and slows decisions. Property location with Nearby Amenities brings clarity by visualizing key data in one place. With MAPOG, developers can layer filters onto a property map to compare options, identify trends, and highlight the listings that matter most to buyers. This focused visualization enables faster … Read more

Real Estate Site Planning

Real Estate Site Planning and Feasibility Analysis Using GIS

In the competitive real estate market, site planning has become increasingly complex, often leading to project delays and increased costs due to challenges in evaluating land suitability and environmental constraints. However, GIS-based workflows, such as those provided by MAPOG, simplify these challenges by allowing planners to visualize and analyze site feasibility effectively, resulting in more … Read more

Interface showing geocoding options for converting the addresses into map locations, with property details and mapped points displayed.

Converting the addresses into map locations

In the real estate industry, managing multiple site addresses across districts or states may seem straightforward at first. However, developers often face spelling variations, incomplete details, duplicate entries, and repeated street names. As a result, towns with identical names or missing information leave locations ambiguous. Without proper coordinates, sites risk being misplaced or duplicated. While … Read more

How to Track & Manage Interior Design Site Visits on a Map

How to Track & Manage  Interior Design Site Visits on a Map

Interior design teams often struggle with multiple site visits, scattered updates, delayed follow-ups, and low project visibility. When data is spread across tools, coordination slows and decisions take longer. Manage Interior Design Site Visits with MAPOG by bringing all locations, visit status, tasks, timelines, and teams into one clear, interactive map with real-time data, improving … Read more

Visualize Property Assets Using 3D Building Mapping

Visualize Property Assets Using 3D Building Mapping

Traditional spreadsheets and flat property listings hide high-value real estate assets to flat rows of data, critical spatial context making it hard to understand location impact, building scale, and asset relationships slowing decisions and increasing guesswork. MAPOG changes this by transforming real estate data into interactive 3D building maps, allowing teams to Visualize Property Assets … Read more

Digitize a Mall Layout

How to Digitize a Mall Layout on MAPOG for Planning, Construction, and Management

For constructors, real estate developers, architects, planners, and facility managers, digitizing a mall layout is no longer optional; it has become essential for modern mall planning and facility management. When you Digitize a mall layout using MAPOG, you centralize tasks, track updates, and back decisions with real-time location data. Instead of relying on printed blueprints … Read more

Shows features like geo-referencing layout image and adding attribute details for creating an interactive campus map for real estate projects.

Create an Interactive Campus Map for Real Estate Projects

Modern real estate developments such as campuses, townships, and estates involve many buildings and amenities. However, they are still shown through static layouts or spreadsheets, which fragment information and hinder navigation. Therefore, MAPOG resolves these challenges by enabling an interactive campus map for real estate projects that combines geo-referenced layouts, structured attributes, indicators, and filters. … Read more

Filter Properties for Insights

How Developers Use Filters to Visualize Properties by Price, Type & Status

In today’s real estate tech landscape, clarity and precision in data visualization are essential for smarter property decisions. Simply listing properties isn’t enough-you need a way to slice, sort, and understand them instantly. That’s where Interactive filters come in. By Filter Properties for Insights based on price range, property type, and availability status, maps become … Read more