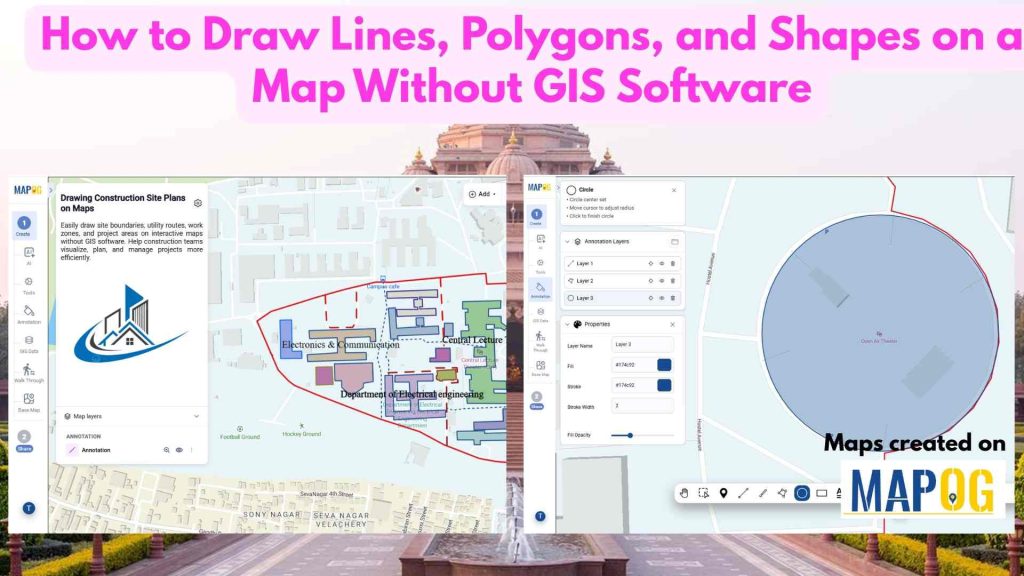
Construction projects often rely on static plans that are difficult to update and share. As a result, teams may struggle to communicate site layouts effectively. However, to Draw Lines, Polygons, and Shapes on a Map makes site planning more interactive and efficient. Instead of using disconnected documents, teams can mark work zones, utilities, and project boundaries directly on maps. Furthermore, Interactive map-based planning allows users to update layouts as conditions change. With MAPOG‘s annotation tools, users can draw lines, polygons, circles, and rectangles. Consequently, roads, buildings, safety zones, and storage areas become easier to visualize, improving collaboration and project visibility.
Key Concepts
Drawing construction site plans on maps helps teams visualize and manage project layouts with geographic accuracy. MAPOG’s annotation tools allow users to create lines for roads and utility routes, polygons for building footprints and work zones, circles for safety buffers and equipment areas, and rectangles for site offices, storage yards, and parking zones. Users can customize colors, outlines, thickness, and transparency to create clear and professional site plans. Interactive map-based planning improves communication, coordination, and decision-making throughout the construction project lifecycle.
Steps to Draw Lines, Polygons, and Shapes on a Map
Step 1 :Create and Upload Locations
Open MAPOG, and click on Open Workspace in the Create & Publish section. Where you can build interactive maps, add layers, run spatial analysis, and publish shareable maps using rich GIS datasets.

Click on Create New Map – choose Blank Map to start from scratch with your own data and styling, or With Template to use a pre-built layout you can quickly customize. Now click on the “blank template” option.
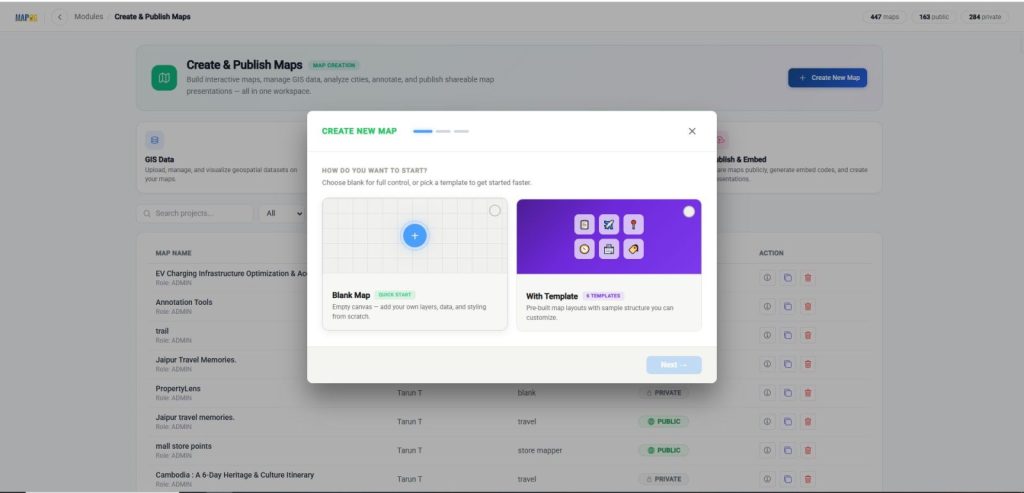
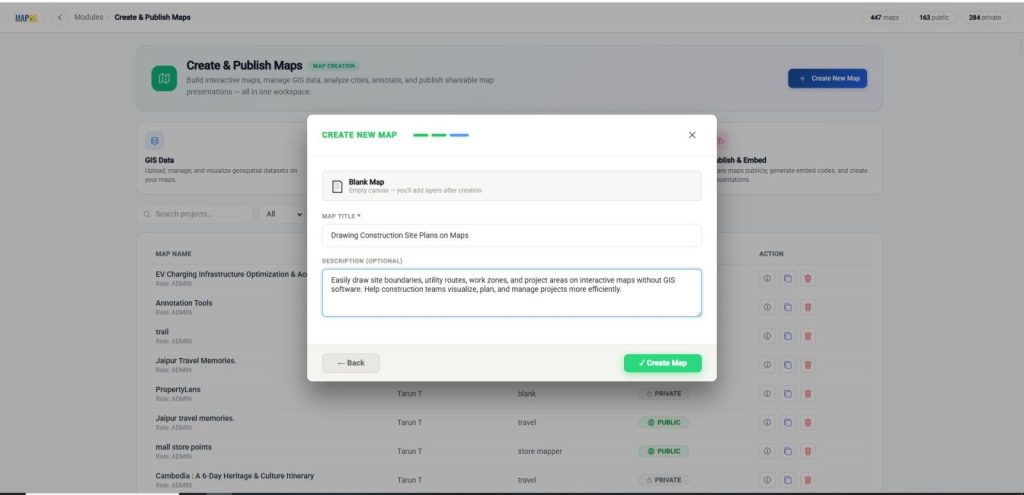
Then provide a title, description, then click create to initialize your project.
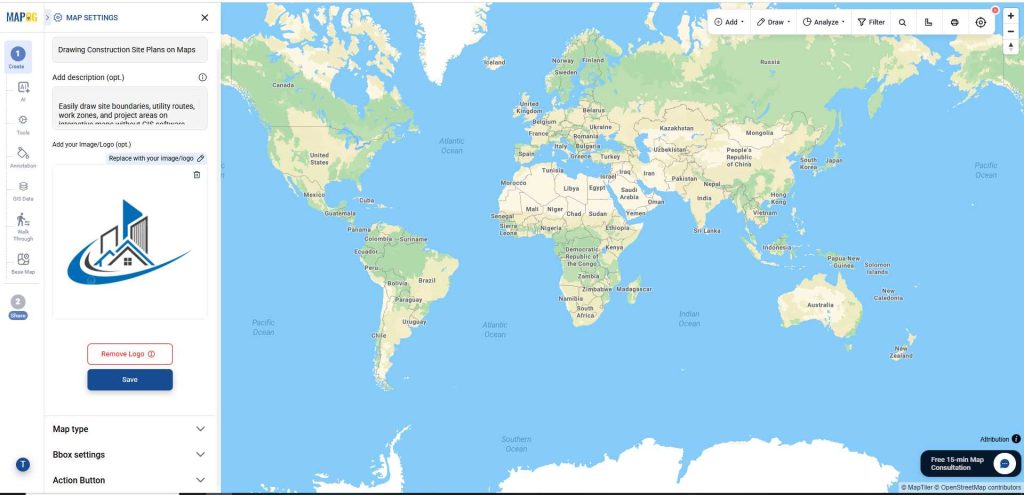
Finally, after coming to the interface, open the map settings.
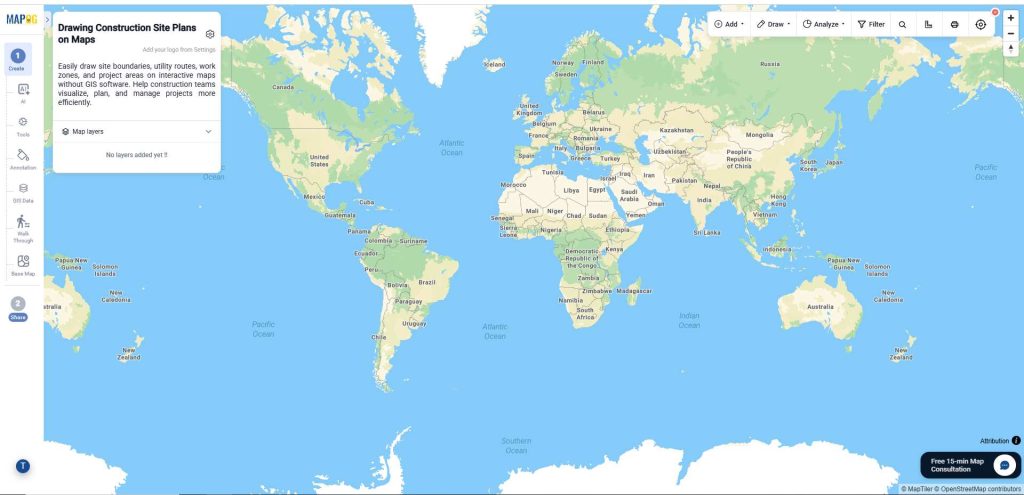
Browse & upload your logo, and save your changes.
2. Starting with the Annotation
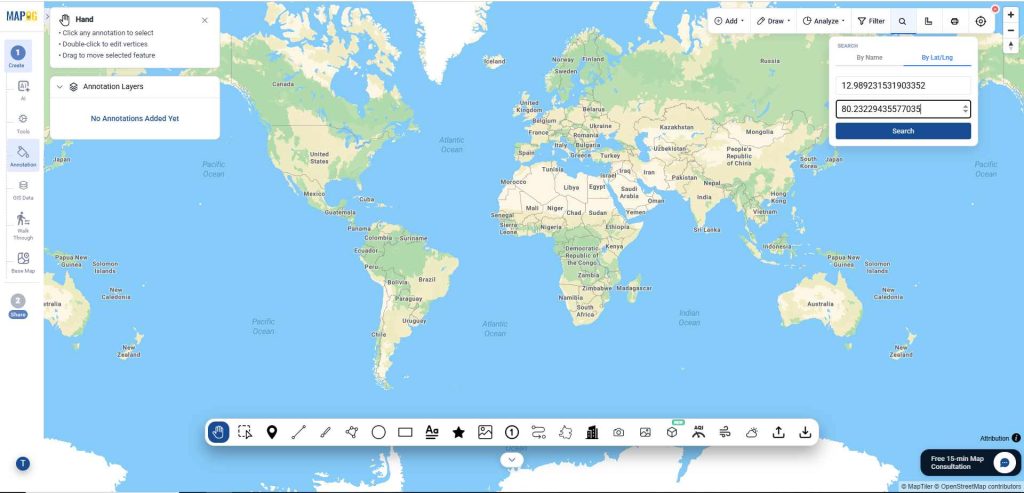
After that, navigate to the annotation section and search for the exact location using a place name or coordinates to anchor the map with geographic accuracy.
Line
Then select the Line option to To mark roads, access routes, utility lines, or boundaries. You will find various line styles such as Straight, Curve, Railway, Arrow, Curve Arrow, Dashed, Dotted, Curve Dashed, Curve Dotted, Curve Arrow Dashed, and Curve Arrow Dotted. Choose the desired style and draw the line by clicking points on the map one after another.
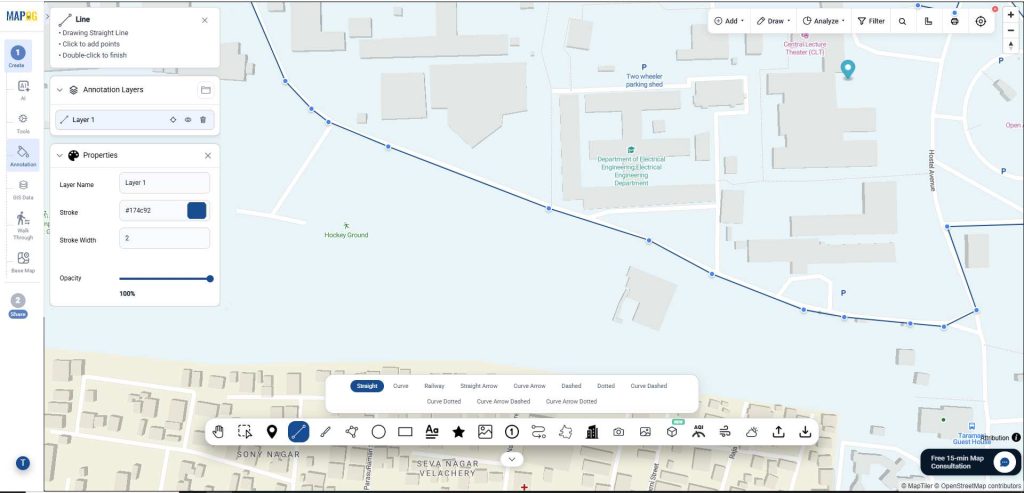
After the line is drawn, use Stroke to change the line color, Stroke Width to adjust the line thickness, and Opacity to customize the transparency of the line.
Polygon
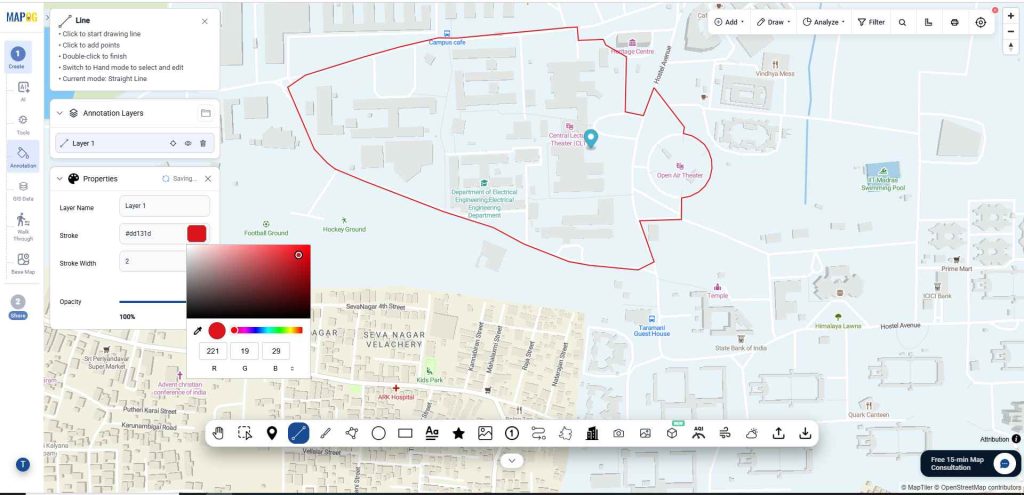
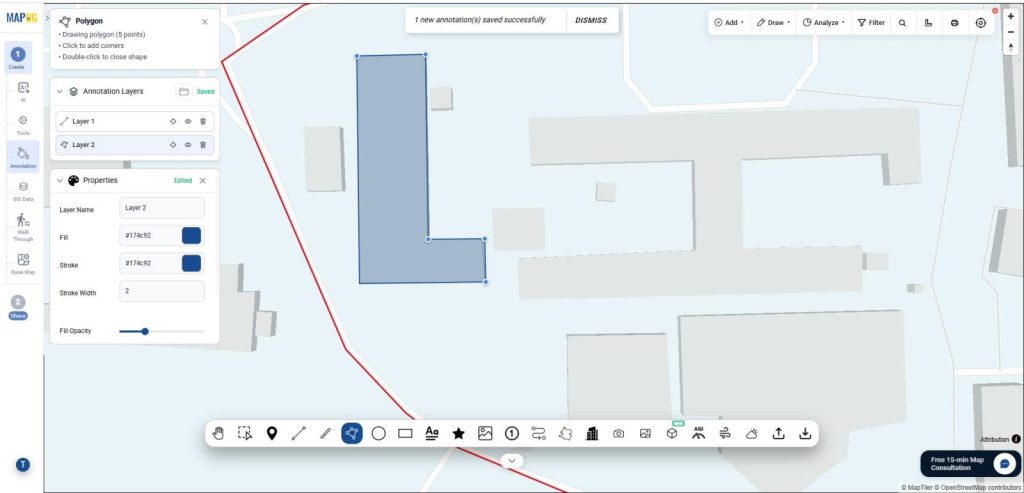
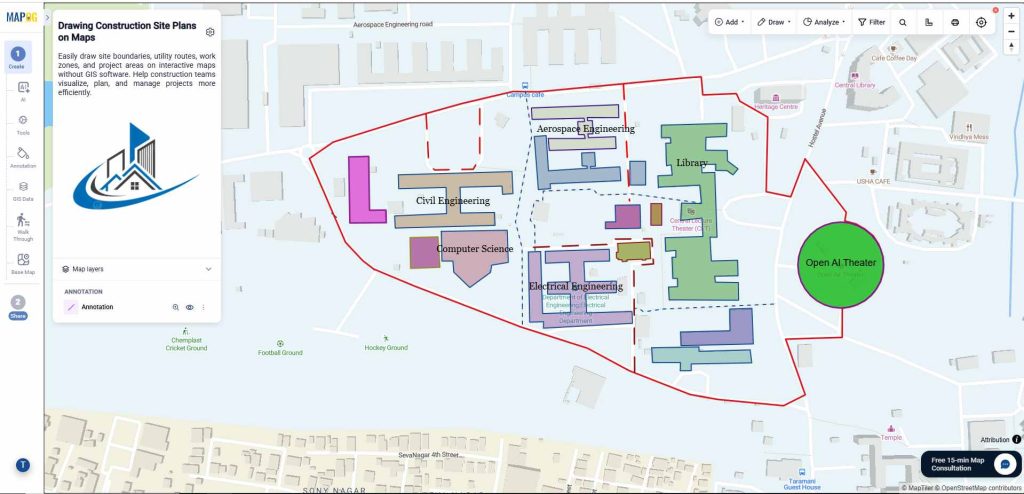
Then to draw farm boundaries, parks, lakes, buildings, forests, and other non-uniform areas select the Polygon option. Then outline the building corners accurately by clicking along the edges to create the polygon.
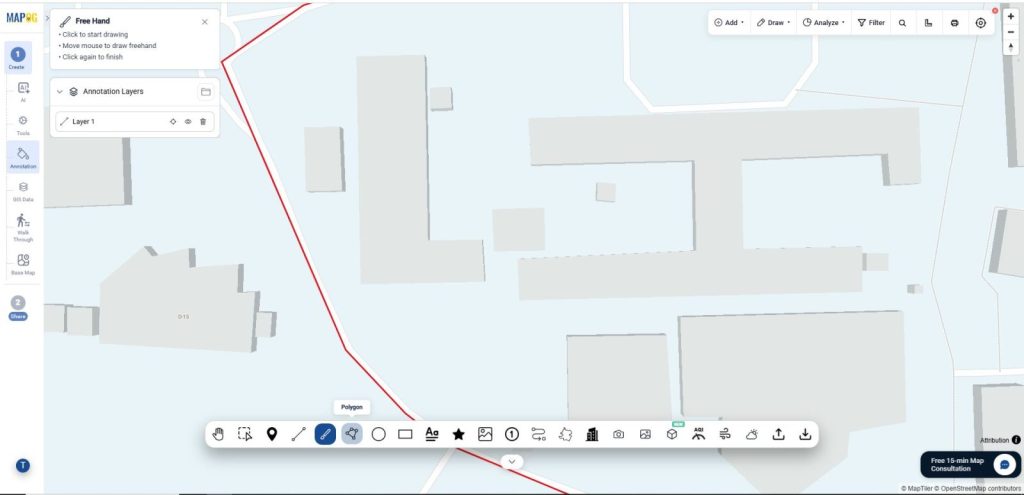
Once completed, use Fill to change the color inside the polygon, Stroke to modify the polygon outline color, and Stroke Width to adjust the outline thickness. Then use Fill Opacity and Stroke Opacity to customize the transparency of the fill and outline.
Circle
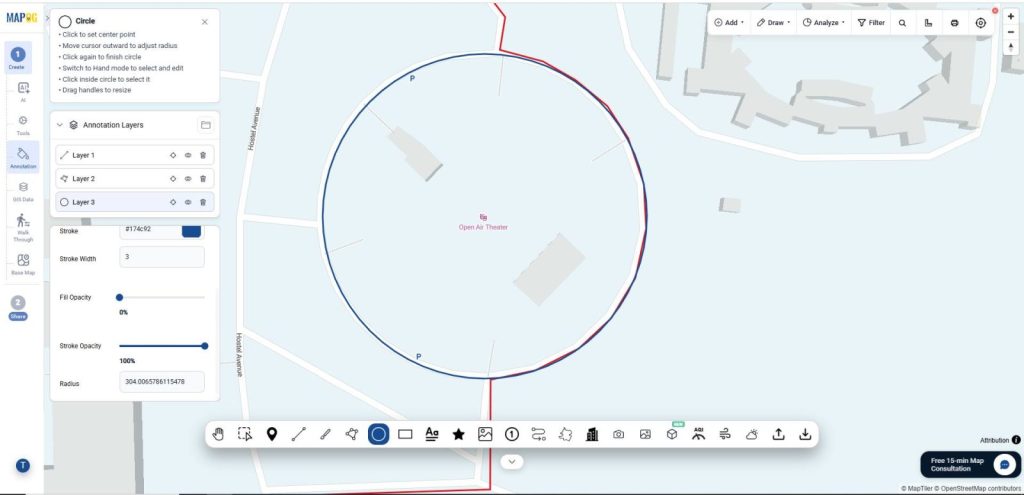
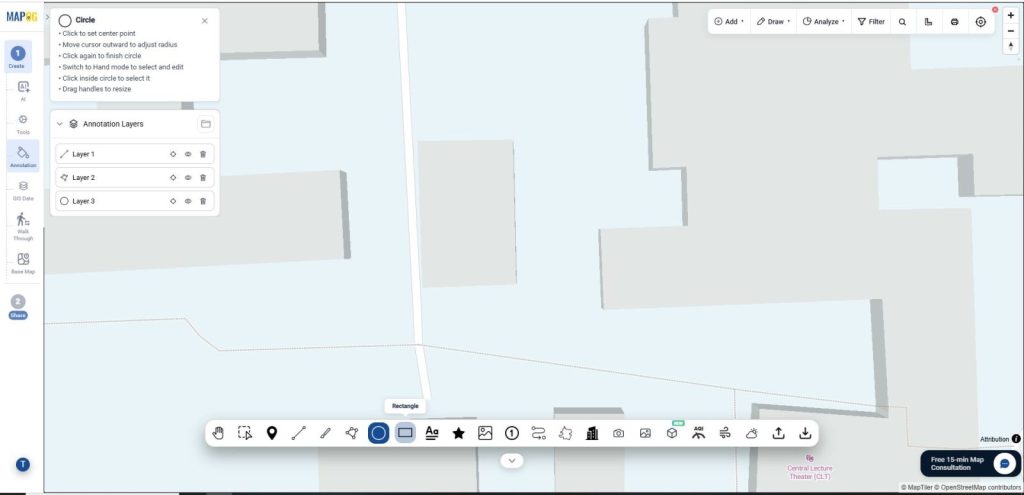
Now select the Circle option to draw water tanks, roundabouts, sports fields, sprinkler coverage, tower coverage areas, buffer zones, and radius-based analysis. Once selected, click on the center of the object where you want to draw the circle, then drag to adjust its size.
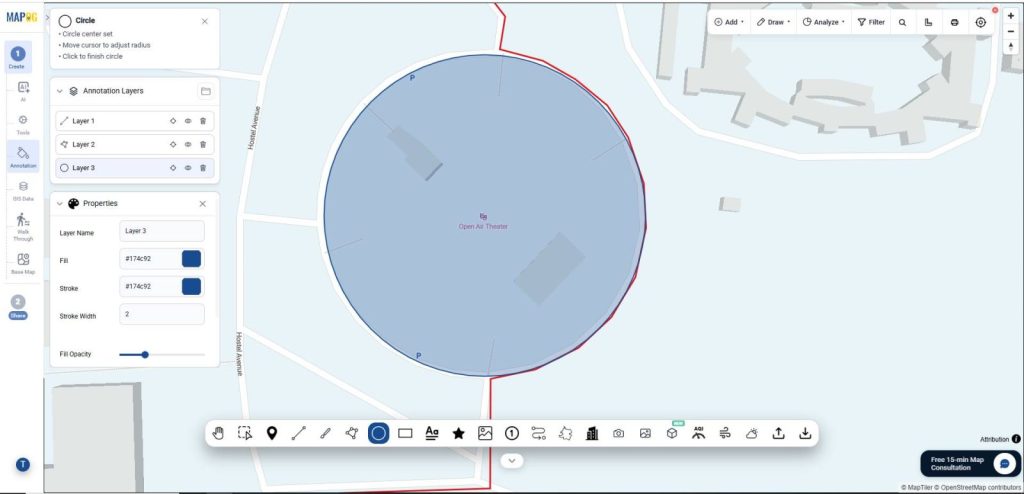
Once done, use Fill to change the color inside the circle, Stroke to modify the outline color, and Stroke Width to adjust the outline thickness. You can also use Fill Opacity and Stroke Opacity to customize the transparency of the fill and outline.
Retangle
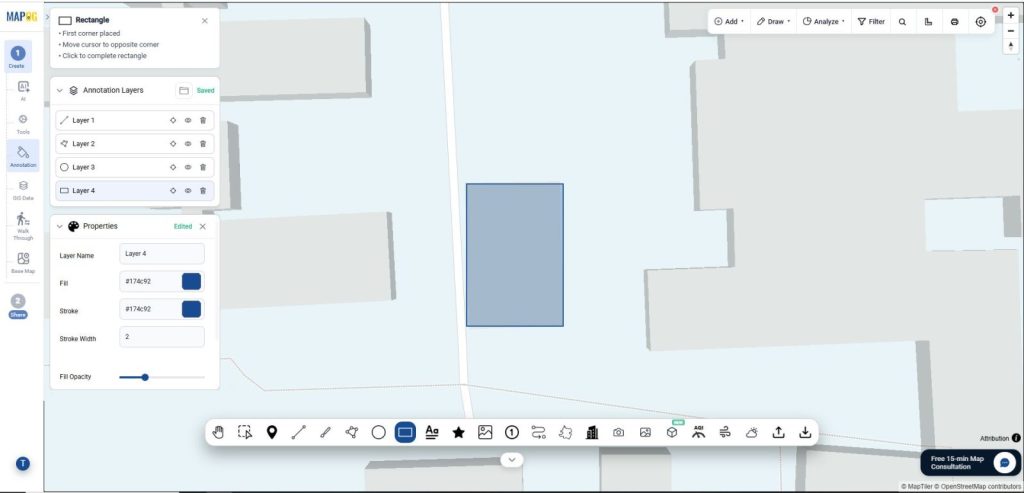
Now select the Rectangle tool for objects that have four corners or a regular rectangular shape. Once selected, click on any corner of the object and drag to the opposite corner to adjust its size and shape.
Once completed, use Fill to change the color inside the rectangle, Stroke to modify the rectangle outline color, and Stroke Width to adjust the outline thickness. Use Fill Opacity and Stroke Opacity to customize the transparency of the fill and outline.
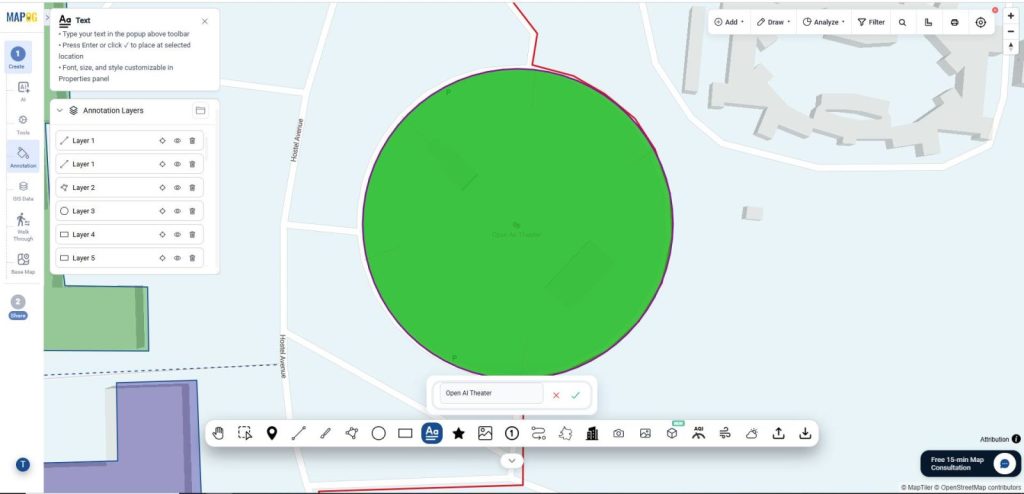
Now, select the text option and type the name of your feature in the text box.
Then select the suitable font and colour to your label. Follow the same procedure for the required features.
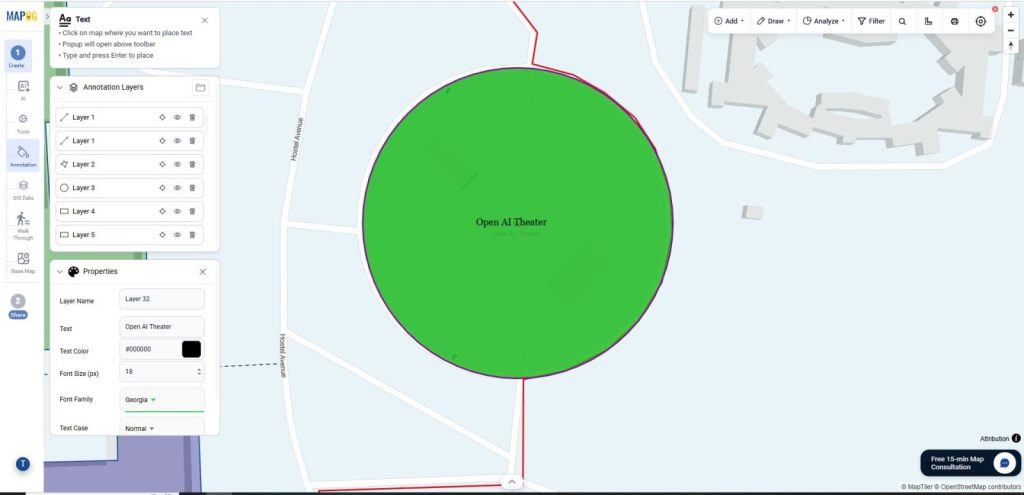
That’s how you can use MAPOG’s annotation tools, including Lines, Polygons, Circles, and Rectangles, to create accurate and interactive construction site plans directly on maps.
Step 5: Preview & share option
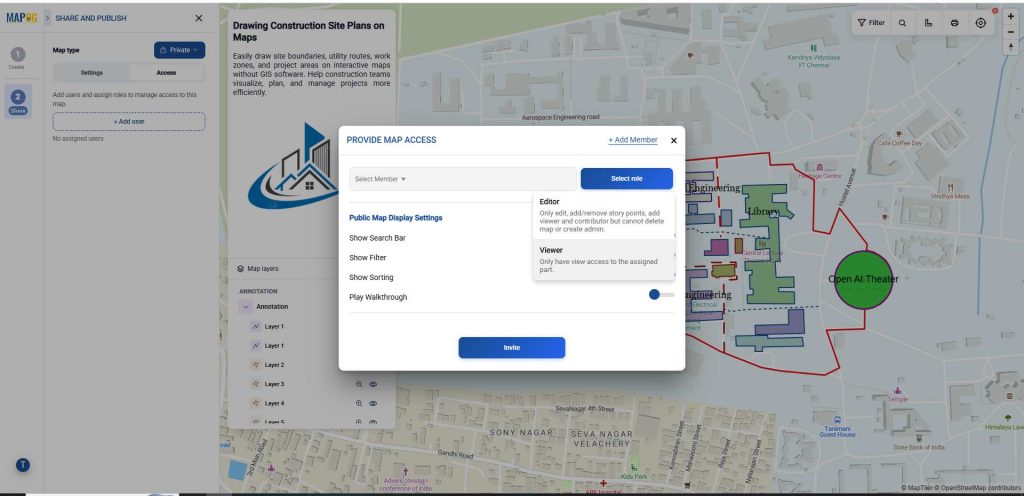
Once your map is ready, go to Preview & Share. Use Add User to invite collaborators and assign roles—Editors can manage content and points (no admin/delete rights), while Viewers have view-only access.
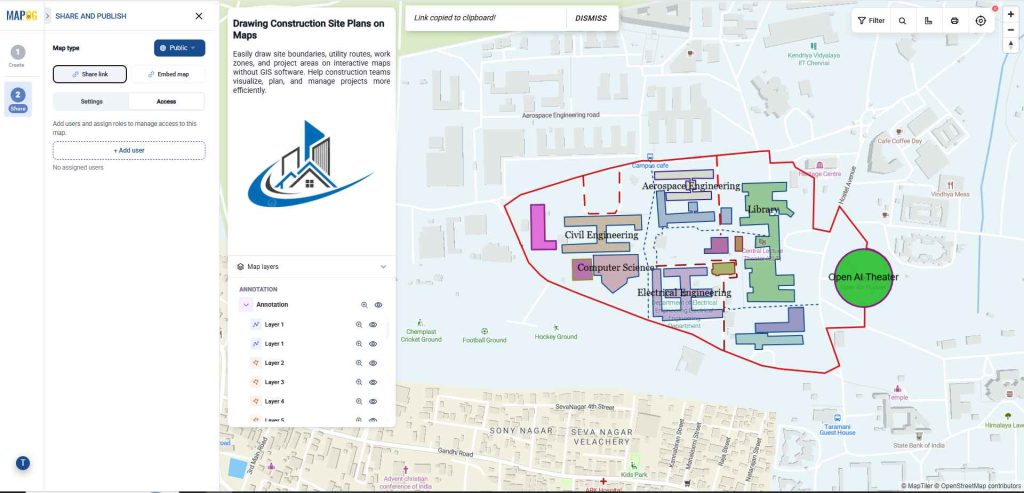
Switch the map from Private to Public to enable sharing. Use the Share Link for quick sharing via email, chat, or social media.
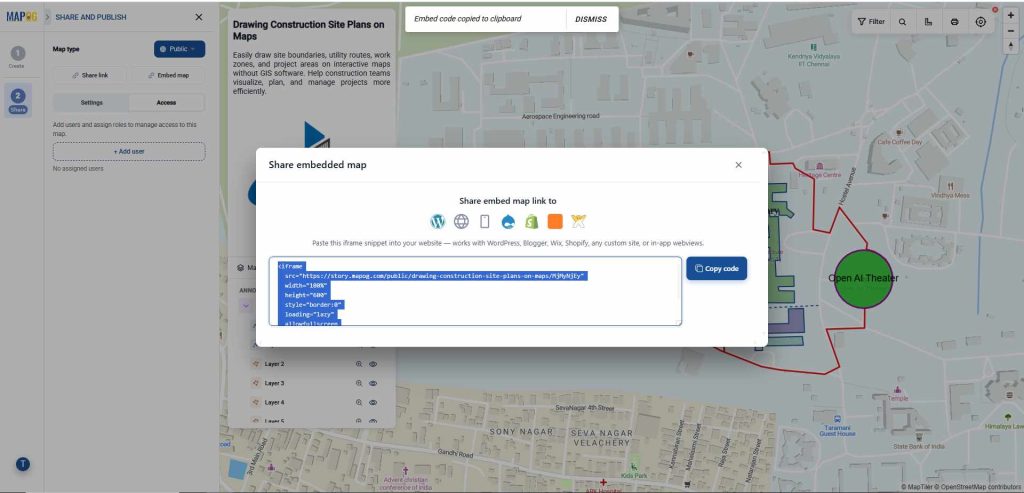
To display your map on a website, select Share Embed Link and use the Embed Map option.
Applications of How to Draw Lines, Polygons, and Shapes on a Map
Interactive maps help internal teams collaborate across departments with controlled access for planning, sales, and operations. They improve client presentations by replacing static reports with live interactive map links for clearer discussions and quicker approvals. Consulting firms and franchise expansion teams can securely share location insights and collaborate on site selection in real time using permission-based access. Here are topics related to this topic:
Conclusion
That’s how you can use MAPOG to securely share interactive maps with visitors, clients, and teams. With role-based access, customizable map settings, and multiple sharing options, MAPOG makes location sharing simple, secure, and engaging while ensuring users have access to the right information at the right time.