#MapVisualization

How to Draw Lines, Polygons, and Shapes on a Map Without GIS Software
How to Draw Lines, Polygons, and Shapes on a Map Without GIS Software

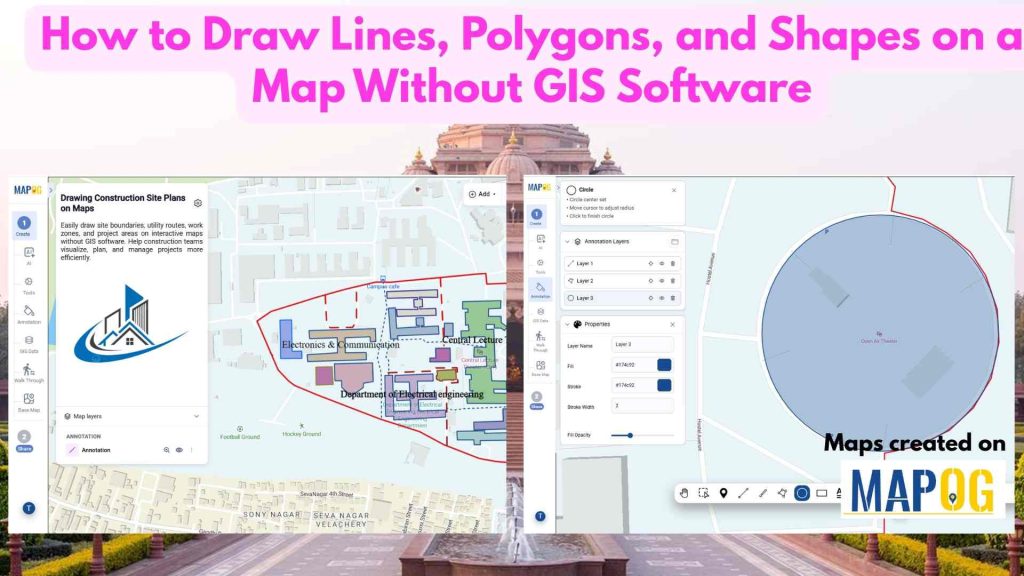
Construction projects often rely on static plans that are difficult to update and share. As a result, teams may struggle to communicate site layouts effectively. However, to Draw Lines, Polygons, and Shapes on a Map makes site planning more interactive and efficient. Instead of using disconnected documents, teams can mark work zones, utilities, and project … Read more

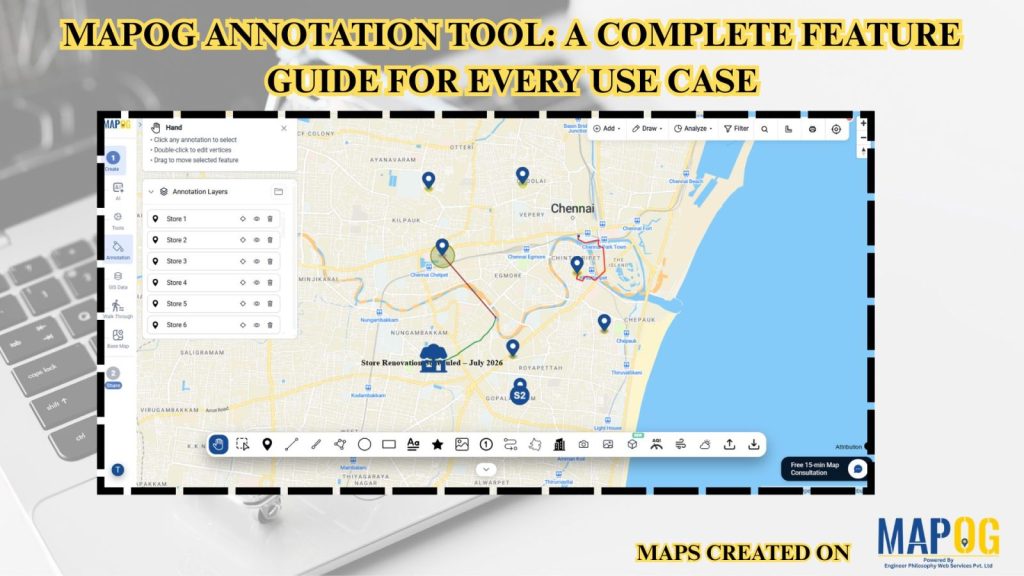
MAPOG Annotation Tool: A Complete Feature Guide for Every Use Case
MAPOG Annotation Tool: A Complete Feature Guide for Every Use Case

Interactive maps become more effective when users can annotate locations, mark routes, and visualize important geographic information. Similarly, the MAPOG Annotation Tool offers powerful drawing and markup features that support planning, collaboration, and location-based decision-making across industries.  Why Use MAPOG Annotation Tool in GIS Maps? However, Annotations turn maps into interactive workspaces by enabling teams … Read more

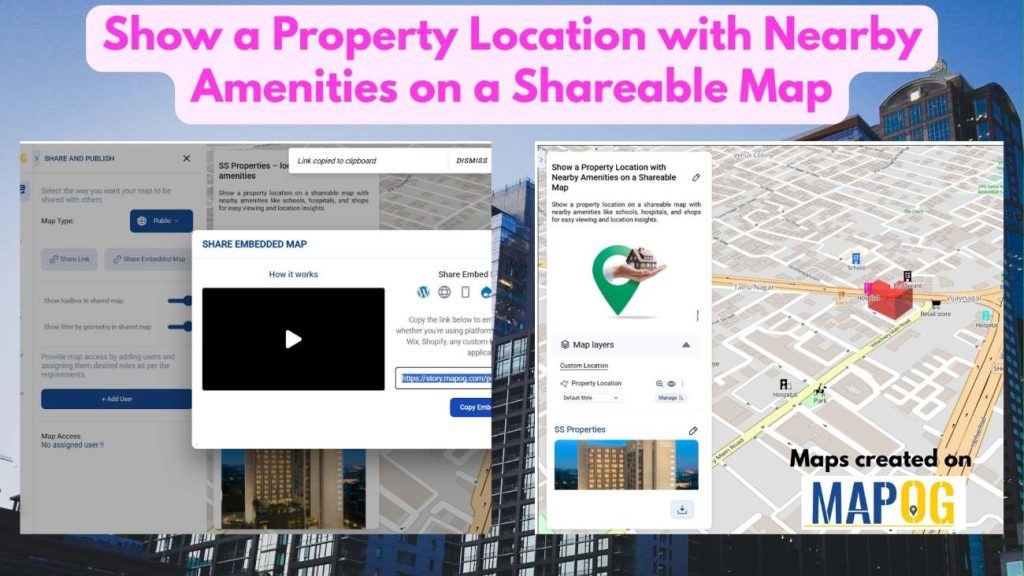
Show a Property Location with Nearby Amenities on a Shareable Map
Show a Property Location with Nearby Amenities on a Shareable Map

In real estate, scattered property data makes comparison difficult and slows decisions. Property location with Nearby Amenities brings clarity by visualizing key data in one place. With MAPOG, developers can layer filters onto a property map to compare options, identify trends, and highlight the listings that matter most to buyers. This focused visualization enables faster … Read more

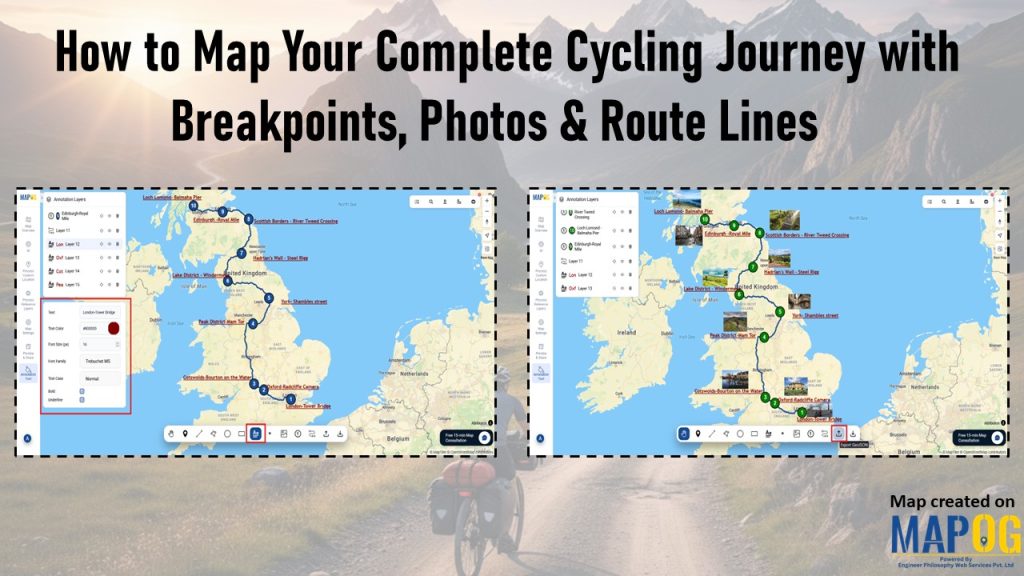
Map interface showing cycling route across the UK with breakpoints, photos, and text annotations.

How to Map Your Complete Cycling Journey with Breakpoints, Photos & Route Lines
Many cyclists struggle to preserve their journeys because GPS tracks, photos, and notes often end up scattered across different apps; as a result, breakpoints lose context, memories fade, and sharing becomes fragmented. However, when you map your complete cycling journey with MAPOG, everything comes together, routes, breakpoints, photos, and reflections; into one interactive storytelling map … Read more

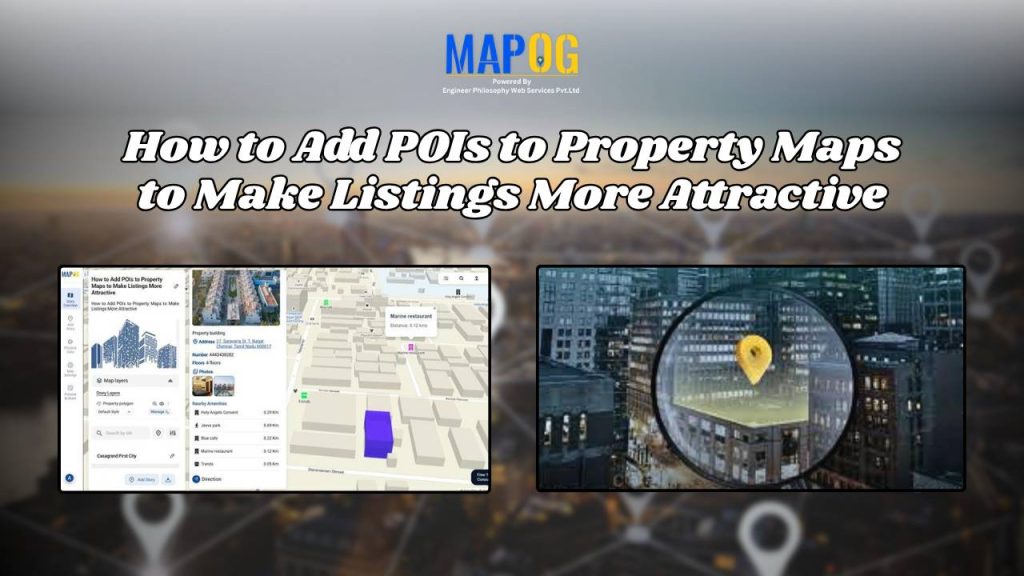
How to Add POIs to Property Maps to Make Listings More Attractive

In today’s competitive real estate market, presentation is everything. Buyers and investors don’t just want to see where a property is—they want to understand what surrounds it. Adding Points of Interest (POIs) such as schools, restaurants, parks, hospitals, and transit hubs transforms simple property maps into a powerful storytelling tool. It helps viewers visualize lifestyle, … Read more

Draw 3D Building Models Online – Interactive Map Tutorial for Urban Planners & Developers

As cities evolve into smarter, data-driven ecosystems, interactive 3D building visualizations are transforming the way we explore and understand urban spaces, and learning how to draw 3D buildings has become an essential skill in this transformation. Whether used for dynamic urban planning, immersive real estate showcases, or engaging educational projects, 3D models turn ordinary maps … Read more