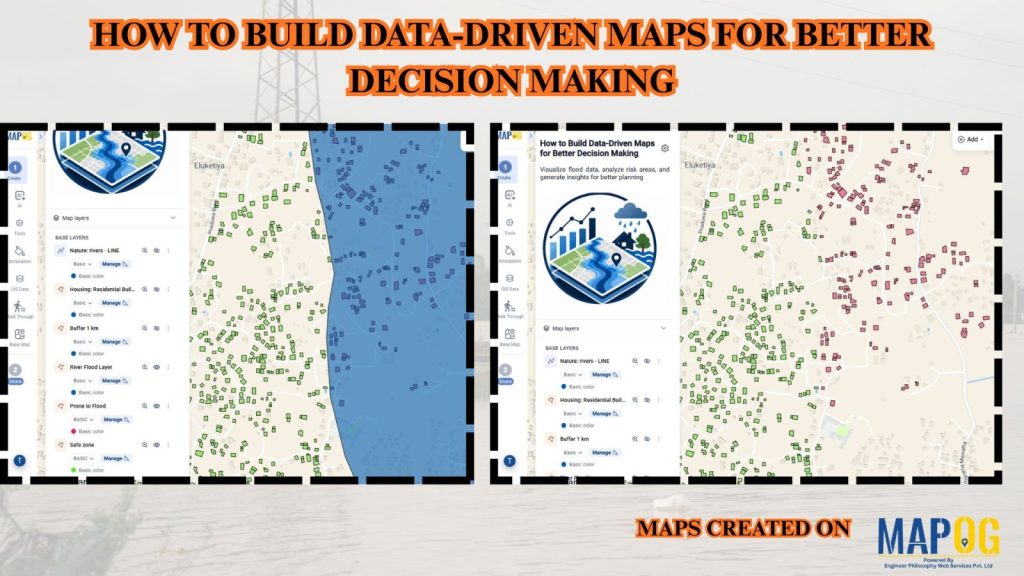
Flood management teams use rainfall, river, and elevation data to assess risks and improve planning. However, analyzing rainfall records, river networks, elevation data, and flood-prone locations through spreadsheets alone can be challenging. Moreover, MAPOG simplifies this process by enabling users to build data-driven maps that combine multiple datasets into a single visual platform. Also, This helps decision-makers identify flood-risk areas, prioritize mitigation efforts, plan emergency responses, and make informed decisions based on real-world data.
Key Concept: Data-Driven Maps
Data-driven maps integrate geographic locations with datasets such as rainfall intensity, river proximity, historical flood events, elevation, population density, and infrastructure information. However, By visualizing these datasets on a map, users can identify flood-prone zones, vulnerable communities, safe locations, and patterns that support better planning and risk management.
Methodology: Data-Driven Mapping
Accordingly, Create interactive flood-risk maps by combining environmental and geographic datasets to visualize hazards, analyze vulnerable areas, support emergency planning, and improve decision-making.
1. Choosing Your Map Type
Launch MAPOG, navigate to Create and Publish Maps, and then select Open Workplace.
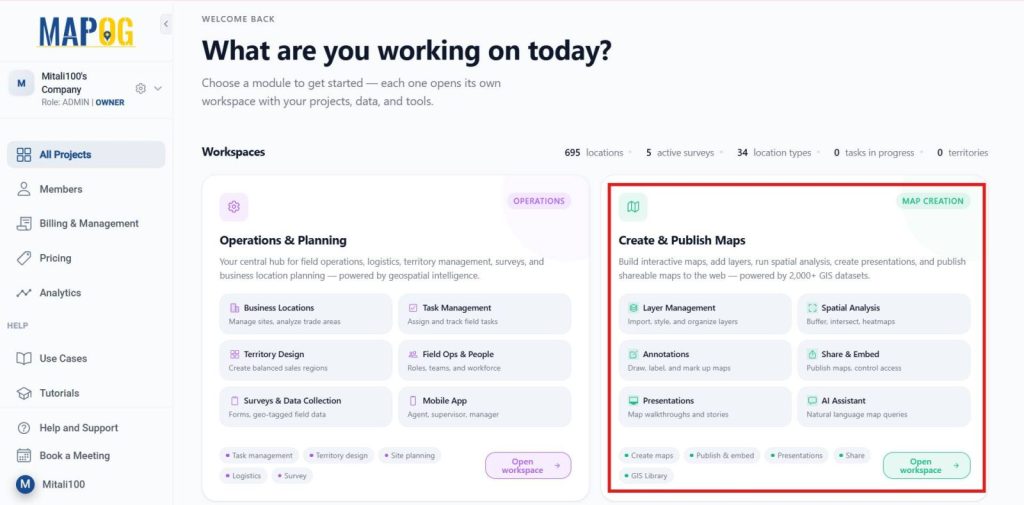
Besides, Start by opening MAPOG and clicking + Create New Map.
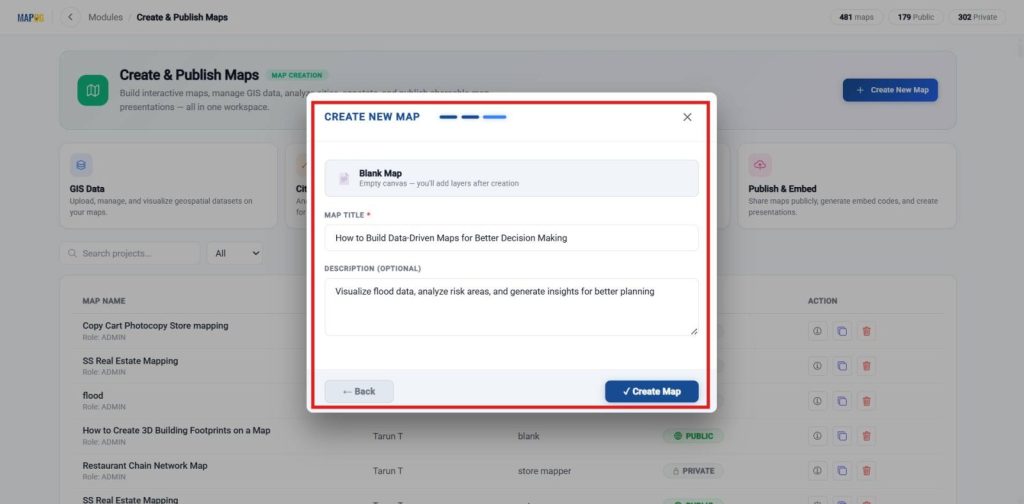
Similarly, Choose a Blank Map to visualize flood data, identify risk zones, and support planning decisions.
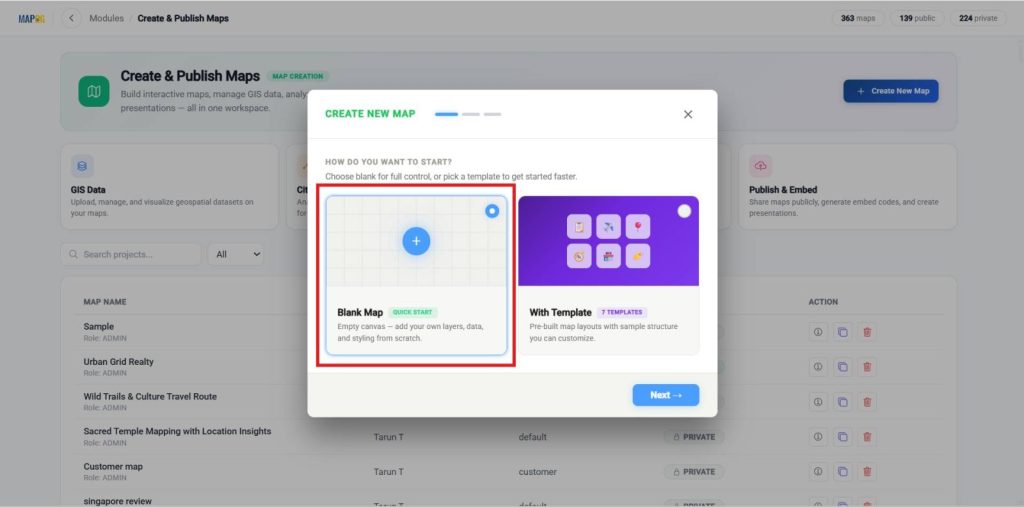
Enter a clear title and a brief description, then click Create to save your map.
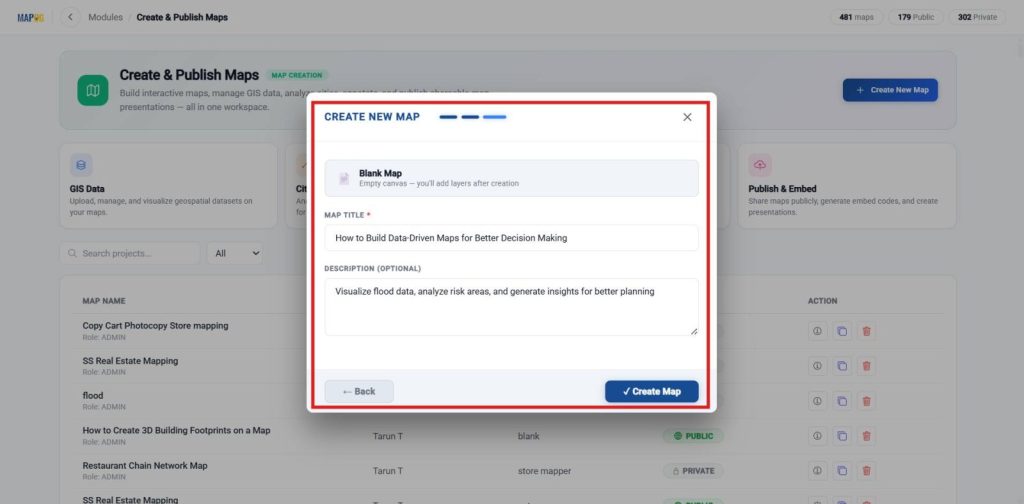
Likewise, A Blank Map lets you visualize flood data, analyze risk areas, and generate insights for better planning.
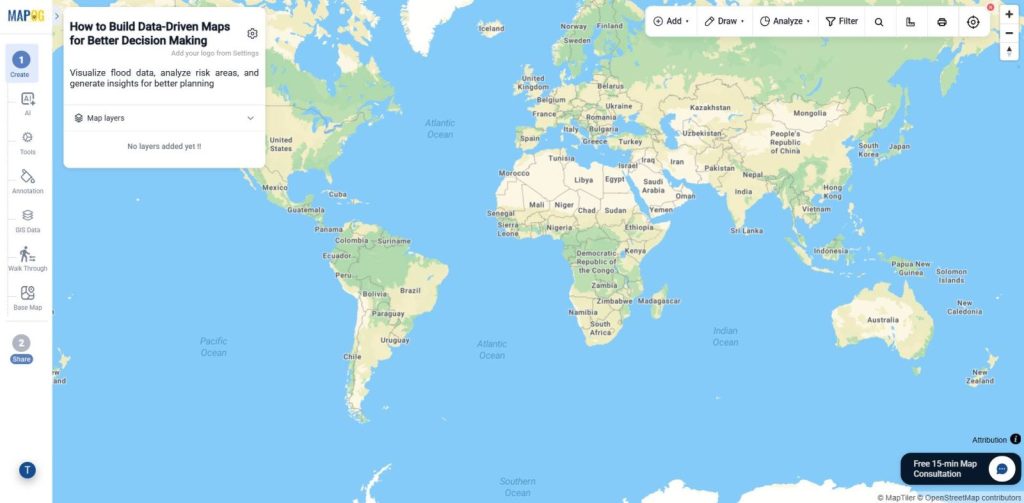
2. Upload and Add Layers
In Process Data, select GIS Data Library and add the following layers.
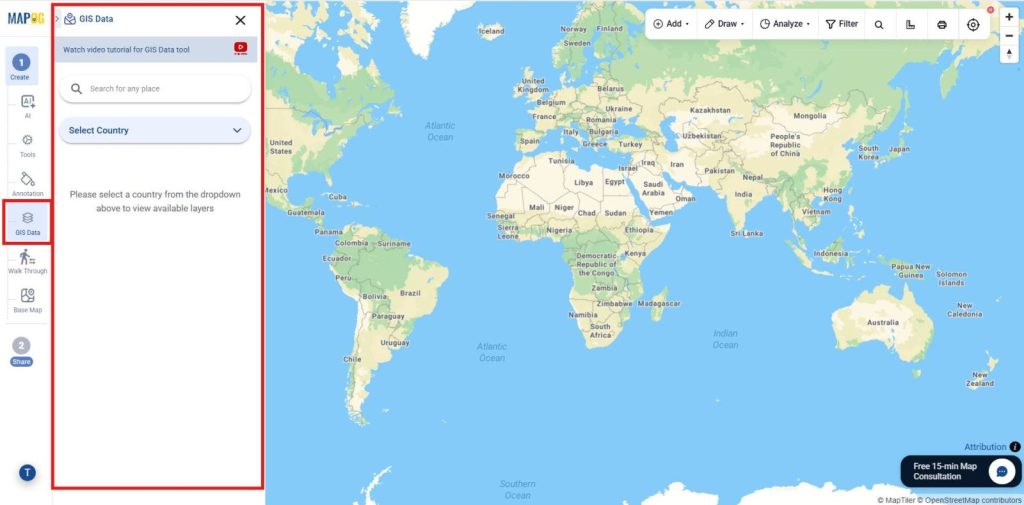
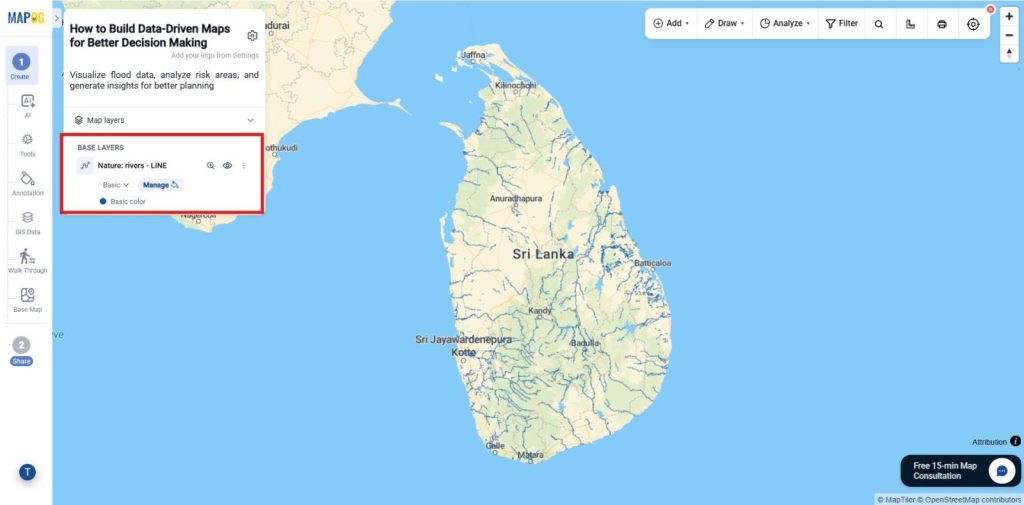
In addition, River Layer: Visualize river networks to identify areas that may be affected by river overflow and flooding. Meanwhile, Navigate to Country → State → Nature → River, select the River layer, and click Add on Map.
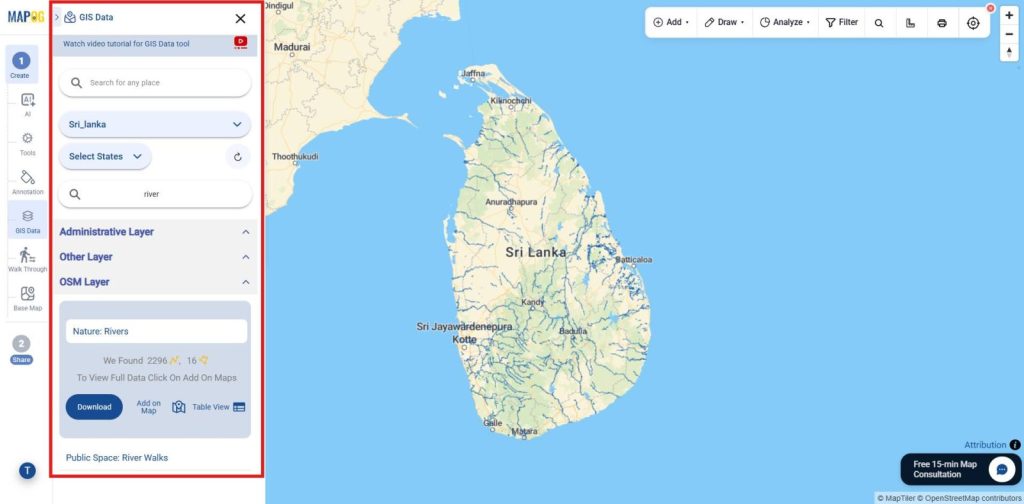
Subsequently, Keep only the line layer and remove the unnecessary layers
Therefore, Residential Building Layer: Navigate to Country → State → Housing → Residential Building, select the layer, and click Add on Map to display residential areas that may be vulnerable to flood events and require mitigation planning.
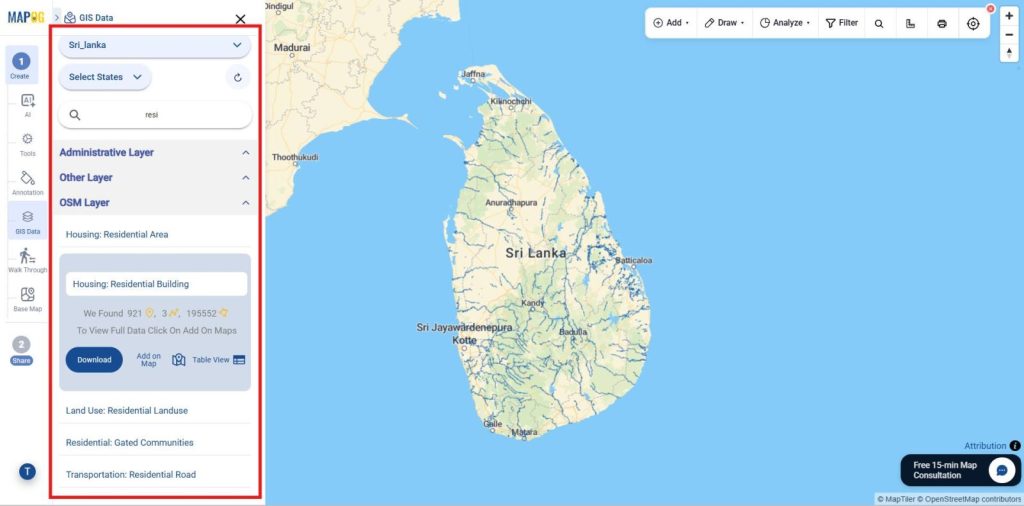
Thus, Keep only the polygon layer and remove all unnecessary layers.
3. Create Buffer Zone for Flood-Prone River Areas
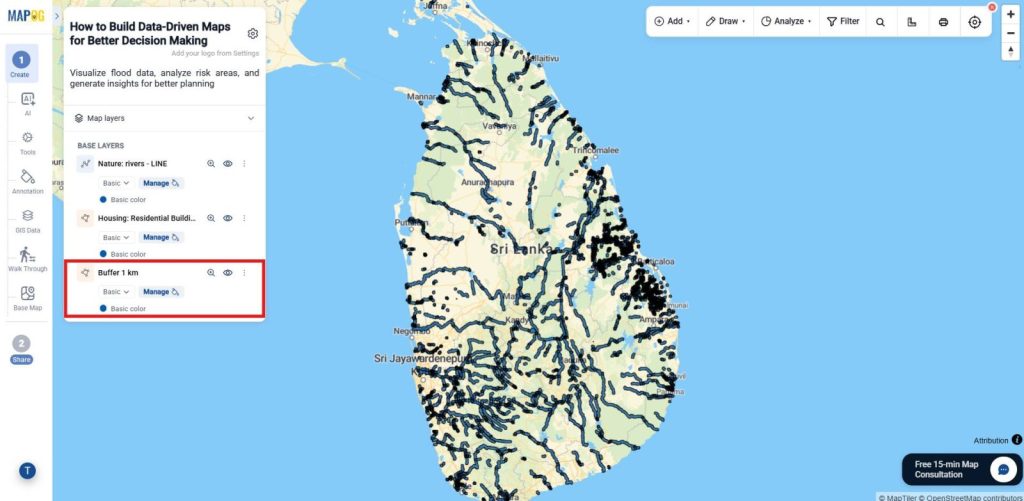
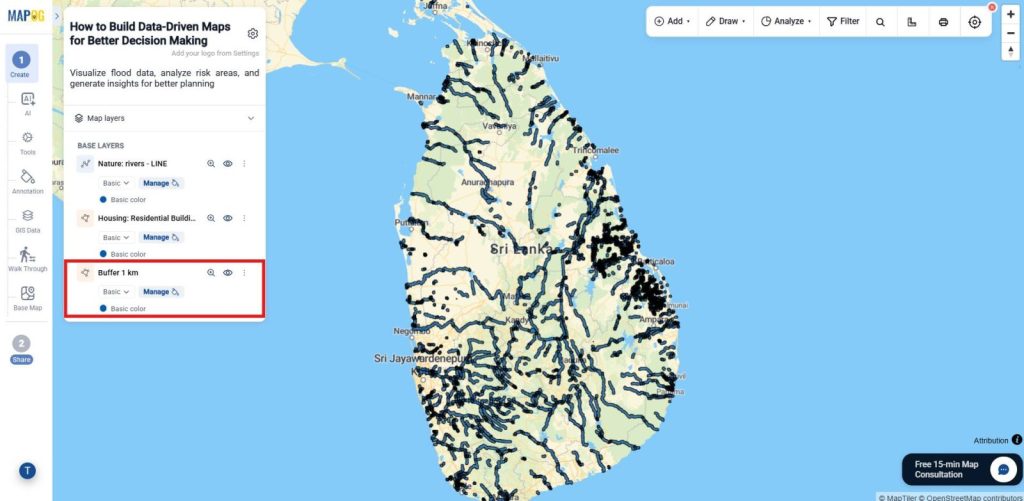
Consequently, Go to Process Data and select the Buffer Analysis Tool.Choose the River Layer as the input layer.Set the buffer distance to 1 km.
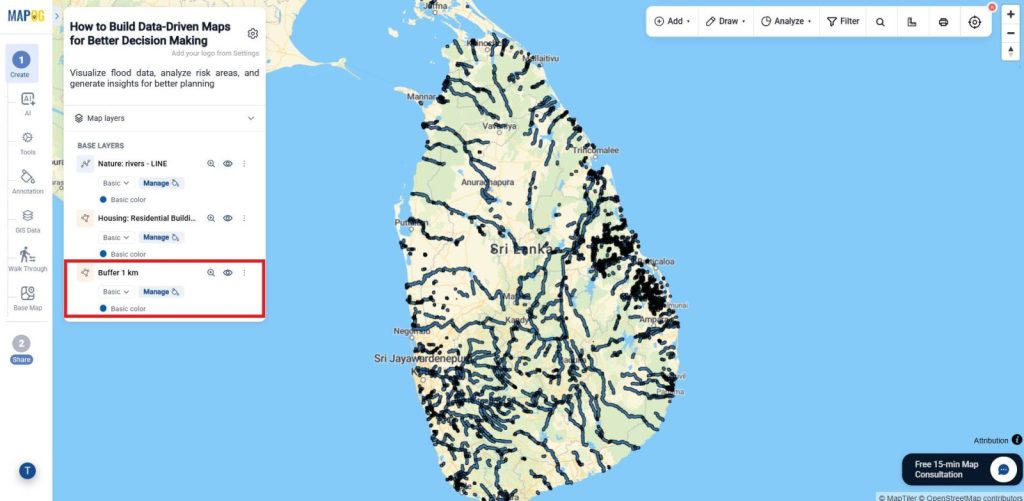
Save the output and rename the layer as Buffer 1 Km.
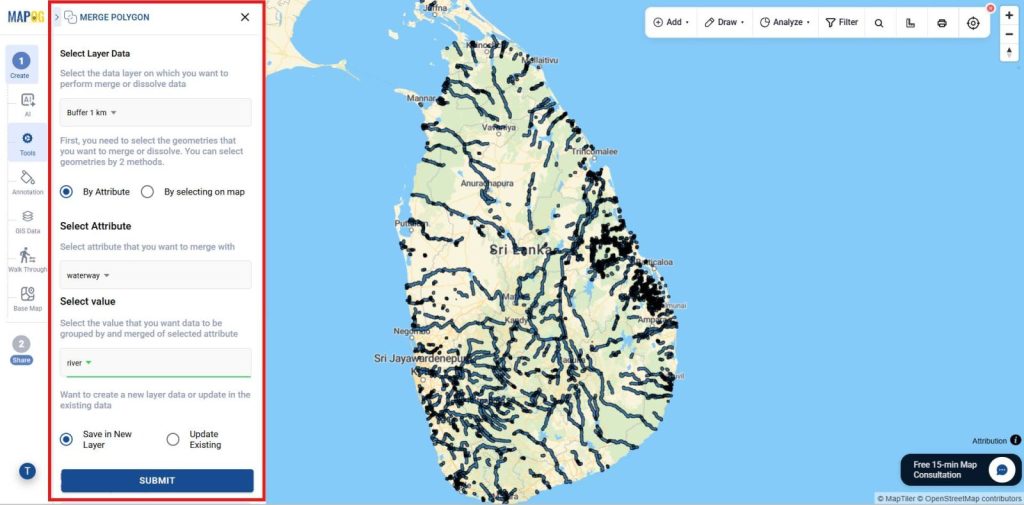
Additionally, Go to Process Data and select Merge Polygon. Furthermore, Choose the River Flood Buffer layer as the input. Select Merge by Attribute.Choose Waterway as the attribute.Set the attribute value to River.Save the output as a new layer.
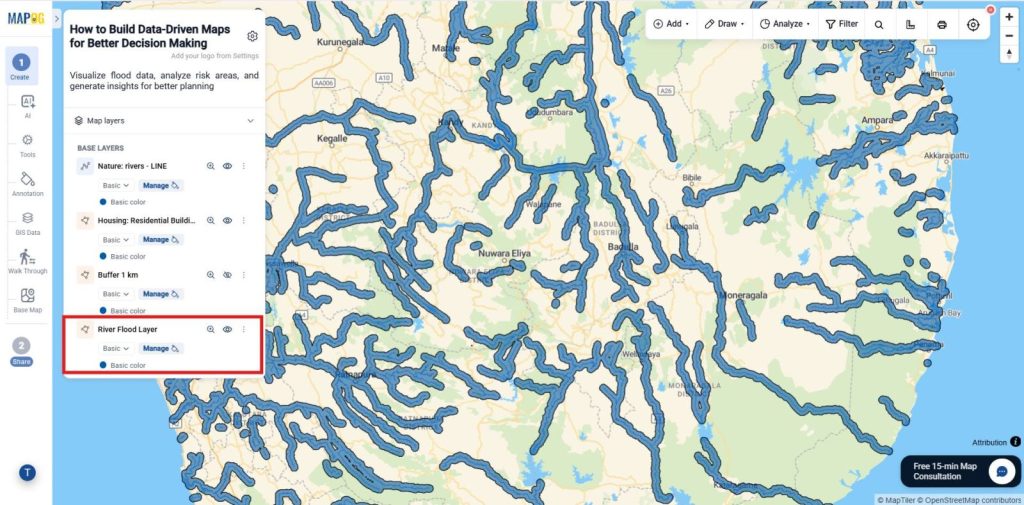
Rename the new layer as River Flood Layer.
4. Filter Residential Areas Within the Flood Buffer
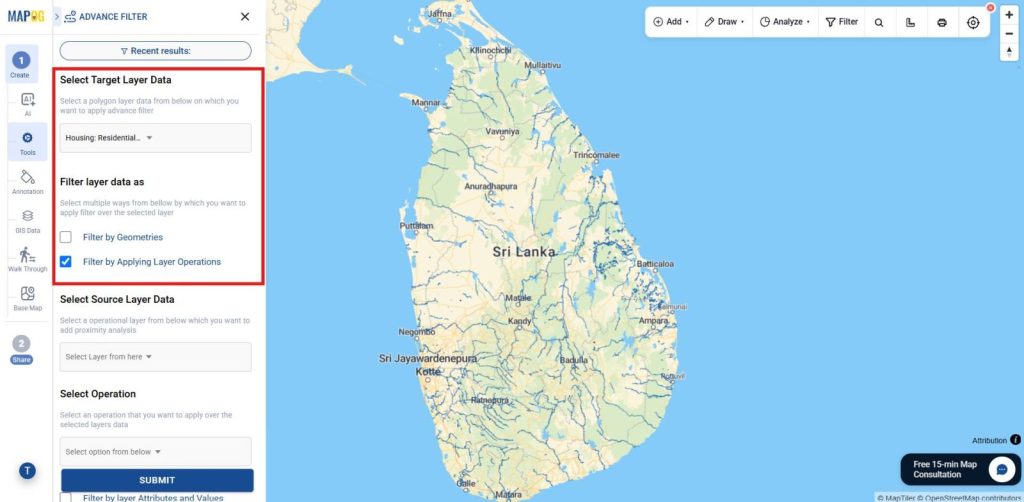
Go to Process Data and select the Advanced Filter Tool. Choose Land Use: Residential as the target layer. Select Filter by Applying Layer Operations.
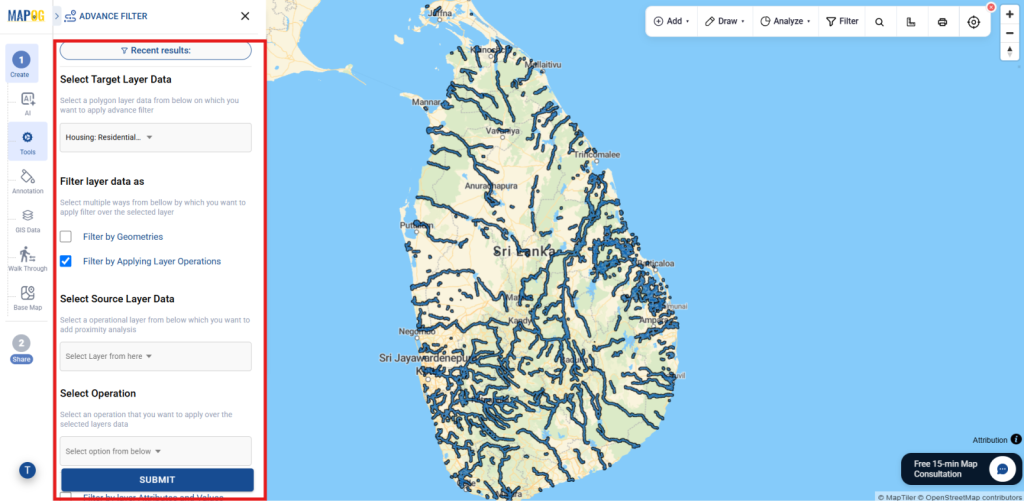
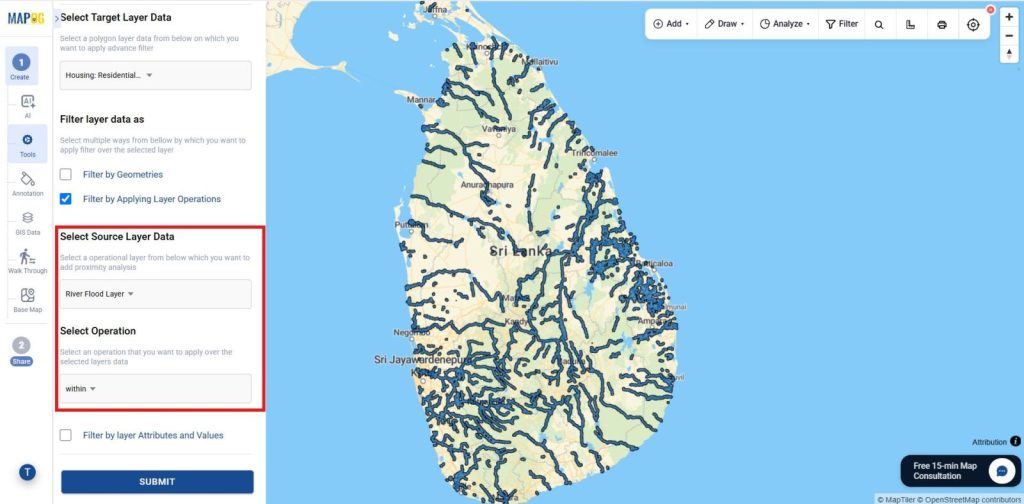
Choose the River Flood Layer as the source layer. Set the operation to Within. Click Submit to extract residential areas located within the flood buffer.
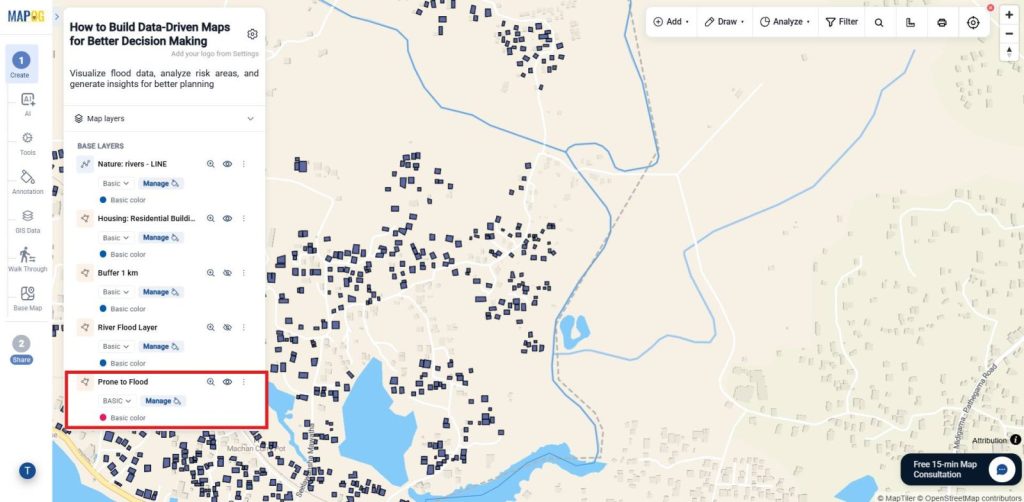
Publish the layer and save and rename the layer.
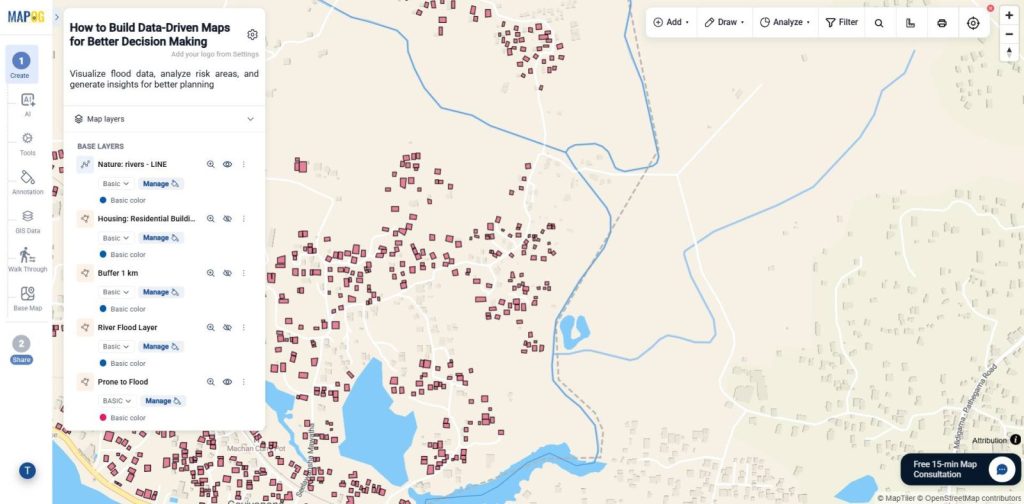
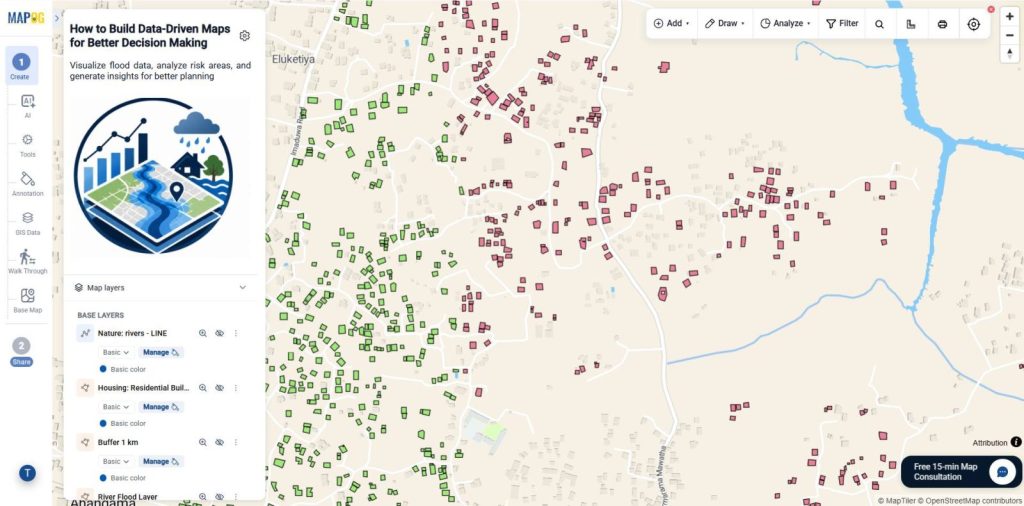
Style the output layer to highlight residential areas that may be at risk of flooding.
5. Identify Safe Residential Zones
Go to Process Data and select the Advanced Filter Tool. Choose Land Use: Residential as the target layer. Select Filter by Applying Layer Operations.
Choose the River Flood Layer as the source layer.Set the operation to Outside. Click Submit to extract residential areas located outside the flood buffer.
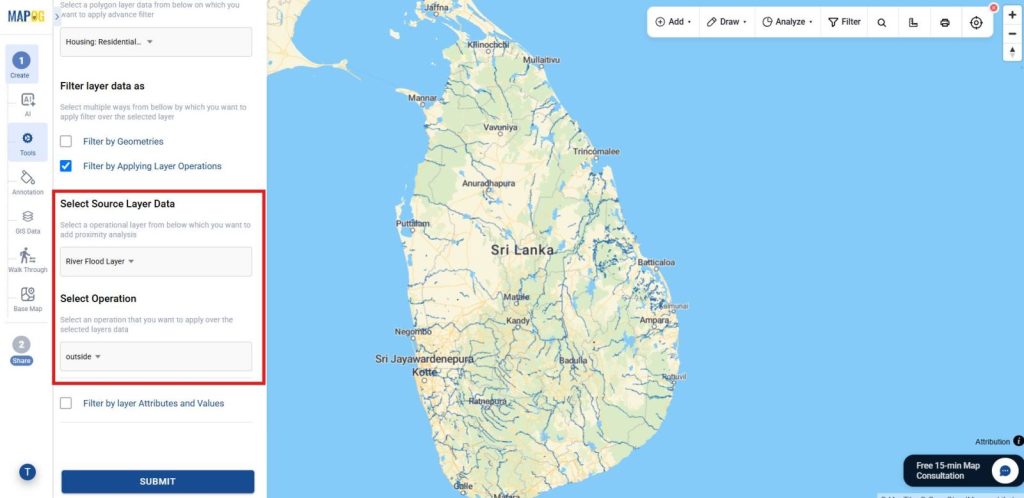
Publish the layer and save and rename the layer.
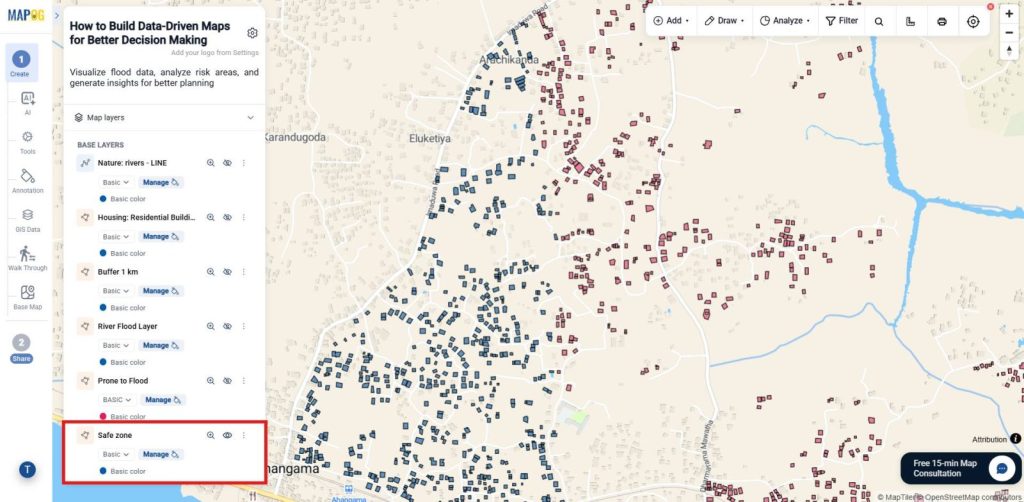
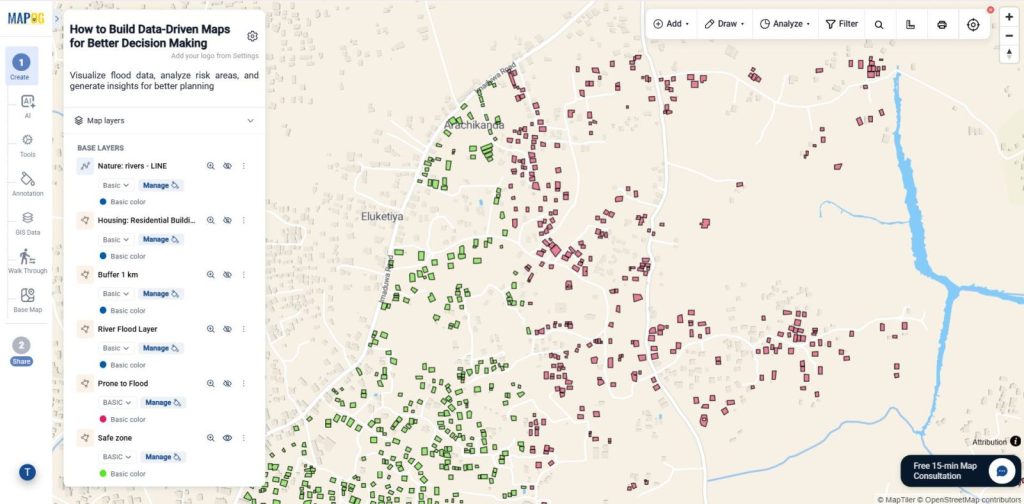
Style the output layer using a different color scheme and label it as Safe Zones to clearly distinguish lower-risk residential areas from flood-prone locations.
7. Adding Brand Logo
Now customize your project branding from Map Settings. Click Replace to upload a company logo or project image, make the required adjustments.
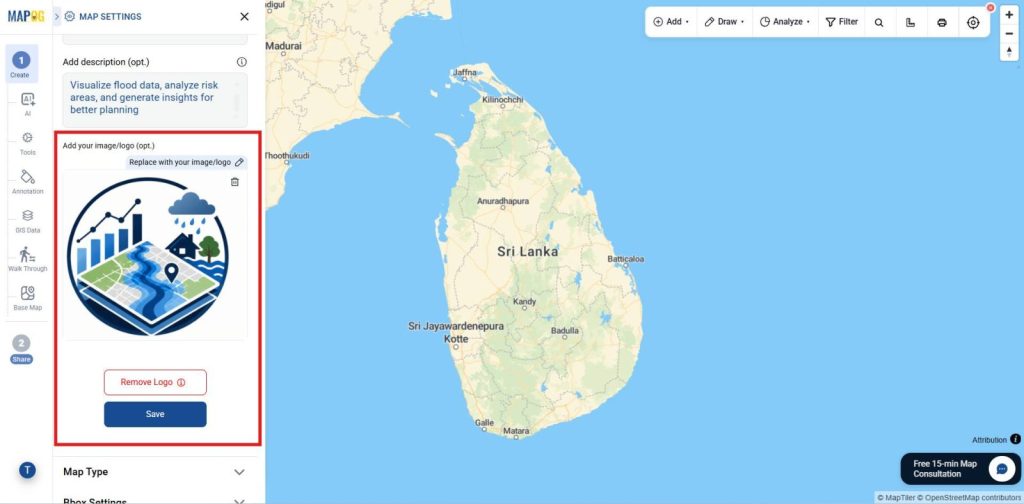
And save it as the branding element.
8. Publish and Share Your Map
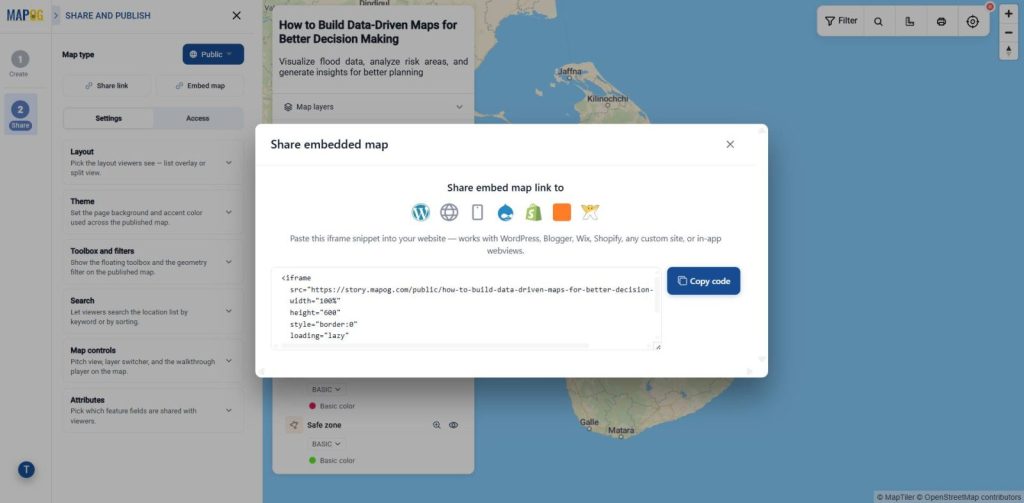
Once setup is complete, use Preview & Share to publish your map and generate a shareable or embeddable link, letting users explore properties by all or selected attributes.
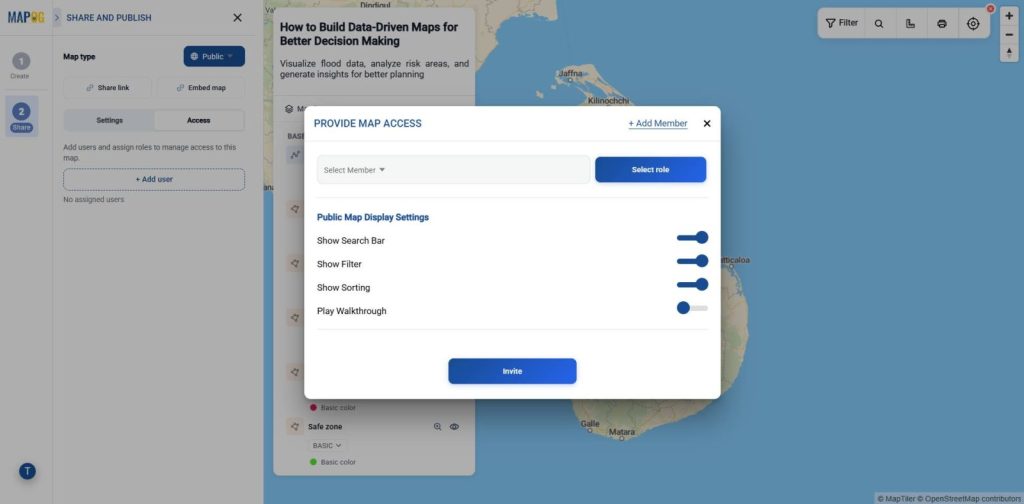
Provide map access by adding users, assigning roles, and enabling shared tools like geometry filters, search, and map controls. Use +Add Users to invite members, assign view/edit permissions, and enable public map features like search, filters, sorting, and shared tools.
Industry Use Cases and Benefits
Visualize flood-risk and safe residential areas on interactive maps to support disaster preparedness, urban planning, emergency response, risk assessment, and community protection, helping organizations make data-driven decisions and improve flood management strategies.
Conclusion
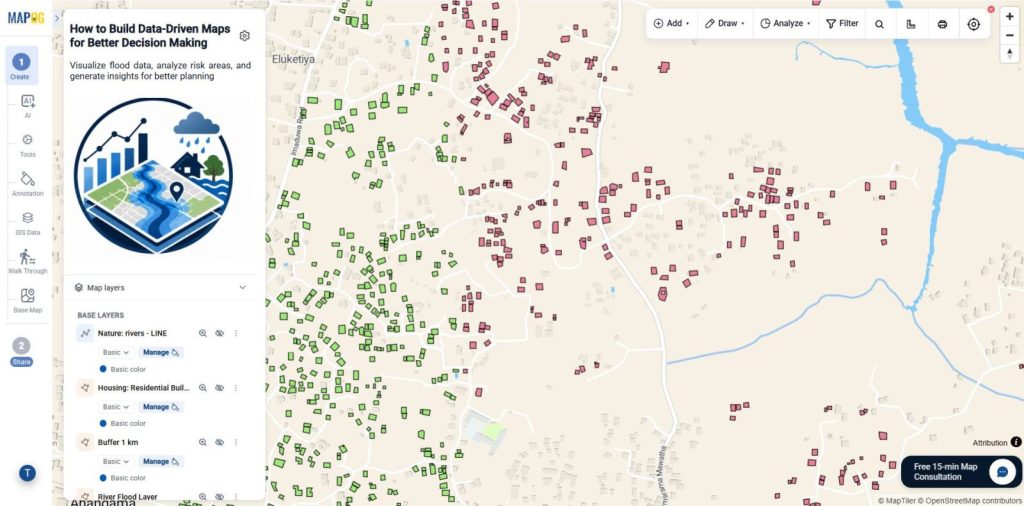
In conclusion, MAPOG simplifies flood risk mapping by combining river and residential datasets with spatial analysis tools. This enables users to identify vulnerable communities, locate safe zones, and generate actionable insights for better planning, risk mitigation, and disaster preparedness without requiring advanced GIS expertise.
Explore helpful blogs