#GISMapping

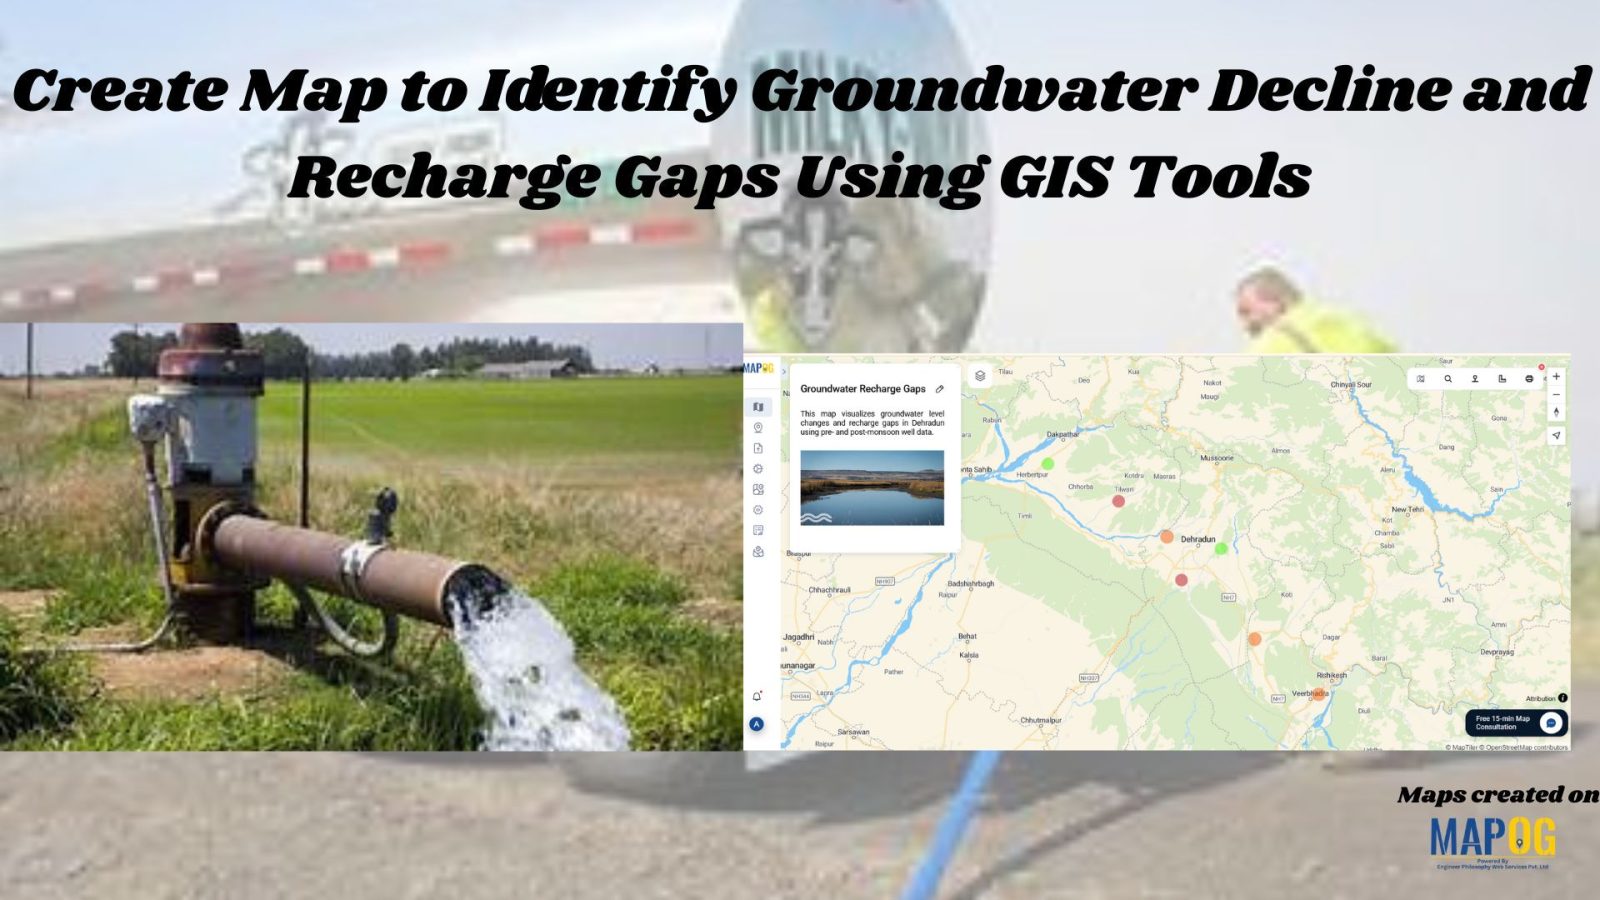
Create Map to Identify Groundwater Decline and Recharge Gaps Using GIS Tools

Groundwater mapping using GIS tools is becoming essential as groundwater decline and recharge gaps raise serious concerns—especially in regions that rely heavily on underground water resources. Fortunately, by using GIS technology, stakeholders can now visualize, Role of GIS In Irrigation Planning and Water Resource Management to these changes more efficiently than ever before. Moreover, with … Read more

Interactive Population Maps

Interactive Population Map with Heat Bubble and Category Styling

Analysing and interpreting population data across various geographic regions can be done visually with Interactive Population Maps with Heat Bubble and Category Styling. It is simple to quickly identify high and low concentration areas on these maps because they use heat bubbles, which vary in size and colour, to represent population density or totals. Furthermore, … Read more

“Visual map showcasing top universities categorized by popular courses such as MBA, Law, Engineering, and more”

Top Universities on Map by Popular Courses: MBA, Law, Engineering & More

In a globally connected world, students, researchers, and academic planners are increasingly turning to smart solutions for understanding how leading institutions are distributed across regions. Whether you’re exploring top engineering schools, renowned MBA programs, or historic fine arts colleges, mapping education institute places offers a dynamic and visual way to grasp academic reach and reputation. … Read more

Ambulance Accessibility & Response Time Analysis

In life-threatening emergencies, every second counts. Consequently, ambulances must reach patients quickly. However, in many cities, emergency response times are slowed down by poor planning, traffic congestion, or lack of infrastructure. This is precisely where Geographic Information Systems (GIS) step in. Platforms like MAPOG are transforming how cities visualize Ambulance Accessibility & Response all without … Read more

GIS for real estate

GIS in Identifying High-Growth Areas for Real Estate Investment

In today’s fast-evolving urban landscape, identifying the right location for real estate investment is both a science and a strategy. GIS helps in Identifying High-Growth Areas is a go-to approach for investors and planners aiming to make informed, data-backed decisions. From analyzing transportation access to mapping nearby amenities, GIS adds a new level of depth … Read more

Clean Cities in India: Mapping with a GIS Perspective

Clean Cities in India: Mapping with a GIS Perspective

Mapping Clean Cities in India is a GIS Perspective which explores how geospatial tools turn sanitation rankings into spatial insight. As India’s cities evolve, sustainability—and cleanliness in particular—has become central to public health and urban development. When evaluating the cleanest city in India, Swachh Survekshan survey offers annual rankings, the “where” behind success often goes … Read more

How to create Major Historical Battles and War Sites Map

History isn’t just about events it’s about where they happened. From ancient conquests to world wars, every major battle unfolded on a map. In this guide, we’ll walk through how to build a stunning “Historical Battles and War Sites” story map using MAPOG. you can transform history into an interactive journey by creating a “Major … Read more

Mapping Crime Hotspots

Mapping Crime Hotspots Using Grids and Heat Bubble Tools

Mapping crime hotspots is a critical approach in understanding and preventing urban crime. By visualizing clusters of criminal activity, law enforcement and urban planners can make informed, data-driven decisions. One modern way to do this effectively is through interactive mapping platforms that offer grid-based analysis and visual heat bubble styles—such as MAPOG’s intuitive tools. This … Read more

Mapping Healthcare Deserts in India

Identifying Areas with Limited Access to Doctors and Medical Facilities Mapping healthcare deserts in India helps expose one of the biggest barriers to healthcare access: geography. Although access to healthcare is a fundamental right, how soon someone can reach a hospital often depends more on location than need. Healthcare desert mapping—regions where timely access to … Read more

How to Upload and Visualize CSV Data on a Map

How to Upload and Visualize CSV Data on a Map

In today’s digital world, knowing how to upload and visualize CSV data on a map is essential for urban planning, environmental monitoring, and compelling visual storytelling. Moreover, with the growing importance of data-driven storytelling and location-based insights, MAPOG provides an intuitive platform to transform your spreadsheet data into interactive maps. As a result, users can … Read more