Crime mapping

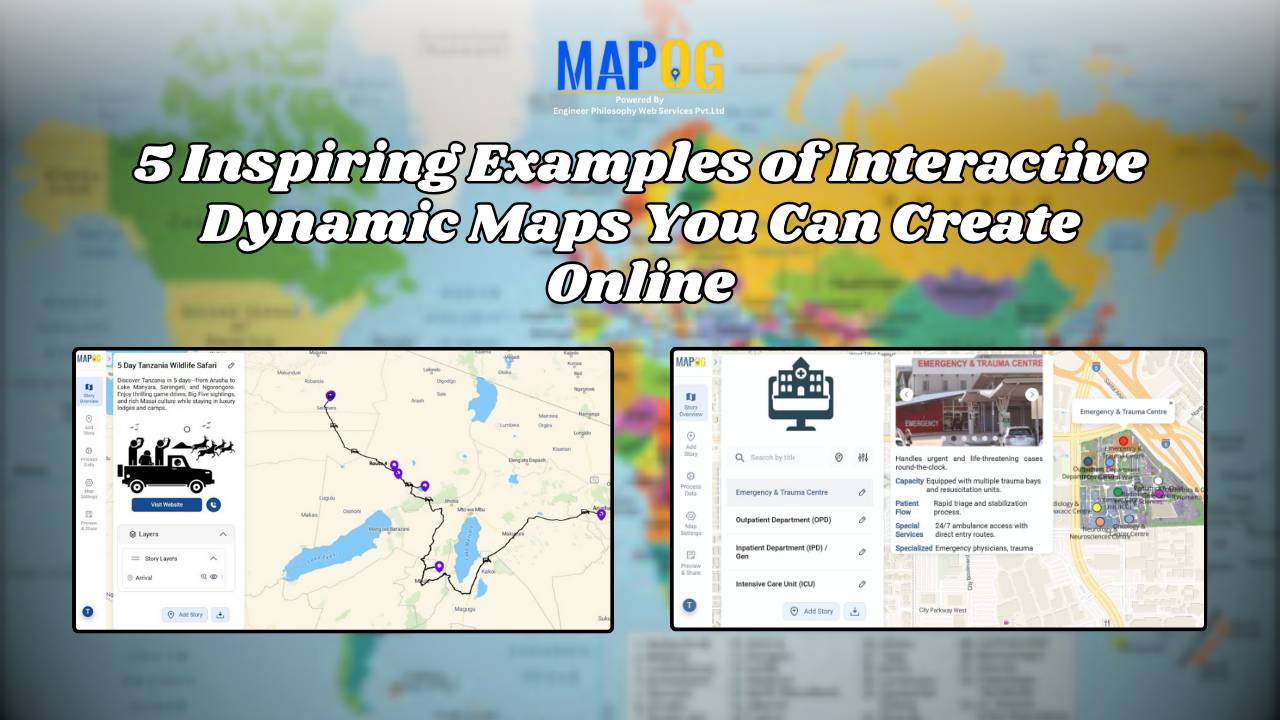
5 Inspiring Examples of Interactive Dynamic Maps You Can Create Online

Interactive and dynamic maps not only transform data into actionable visuals but also let users explore, interpret, and share insights. With MAPOG, you can not only map portfolios, campuses, routes, or stores but also organize, analyze, and visualize trends; moreover, this enables clearer, faster, and connected decisions. Key Concept: Why Create Interactive Dynamic Maps? Interactive … Read more

Mapping Crime Hotspots

Mapping Crime Hotspots Using Grids and Heat Bubble Tools

Mapping crime hotspots is a critical approach in understanding and preventing urban crime. By visualizing clusters of criminal activity, law enforcement and urban planners can make informed, data-driven decisions. One modern way to do this effectively is through interactive mapping platforms that offer grid-based analysis and visual heat bubble styles—such as MAPOG’s intuitive tools. This … Read more