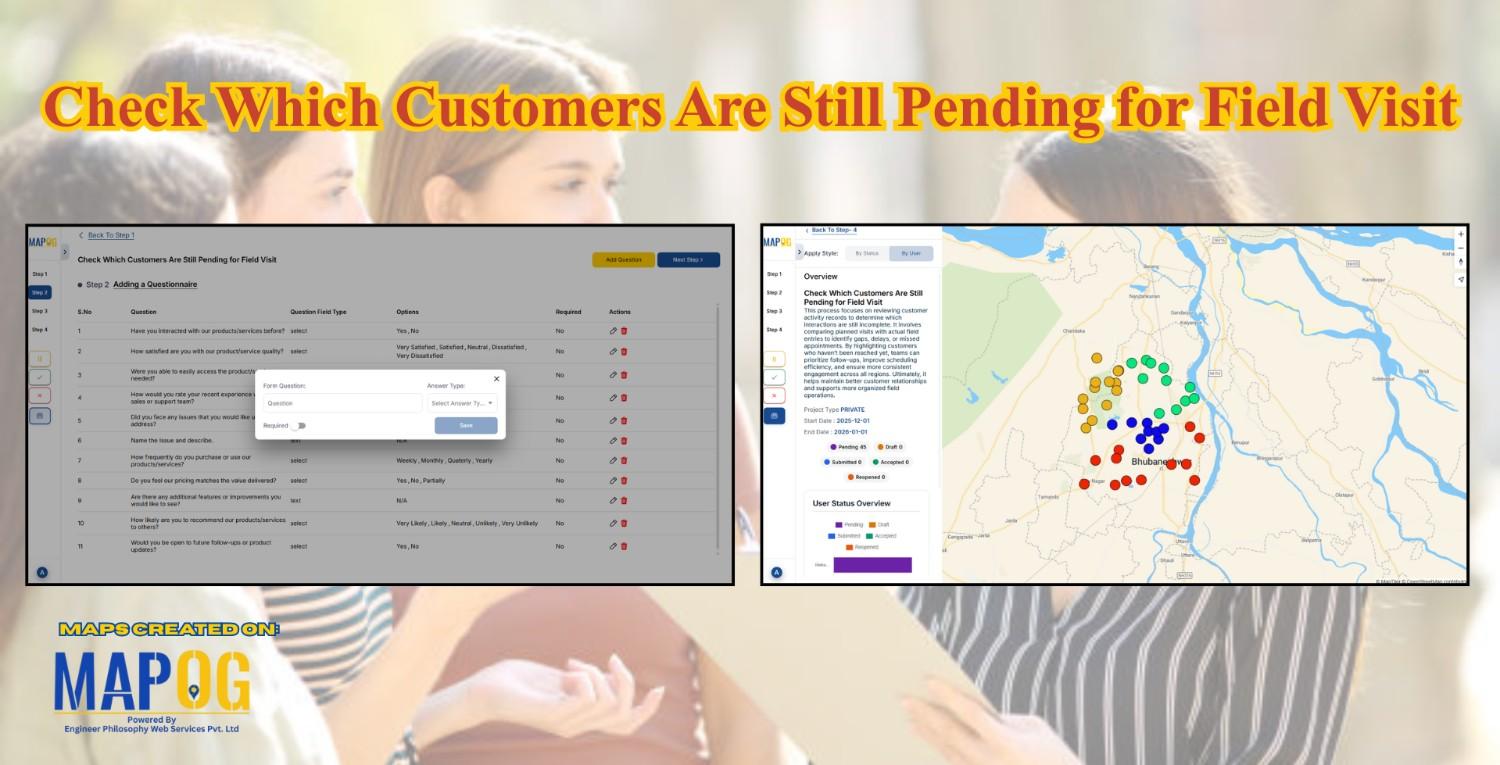
Finance

Why Every Business Needs a Visual Map, Not Just a Dashboard

Why Every Business Needs a Visual Map, Not Just a Dashboard

Dashboards summarize numbers, but visual maps reveal where and why things happen. Business Needs a Visual Map for example, a coffee chain can use MAPOG to see café locations, spot top performers, and analyze competitor proximity in one interactive platform. Moreover, visual maps also help real estate, logistics, healthcare, and many other industries turn complex … Read more

5 Inspiring Examples of Interactive Dynamic Maps You Can Create Online

Interactive and dynamic maps not only transform data into actionable visuals but also let users explore, interpret, and share insights. With MAPOG, you can not only map portfolios, campuses, routes, or stores but also organize, analyze, and visualize trends; moreover, this enables clearer, faster, and connected decisions. Key Concept: Why Create Interactive Dynamic Maps? Interactive … Read more

Manage and Share Location-Based Projects Online with an All-in-One Mapping Tool

In today’s fast-paced project environments, tracking multiple sites, teams, and resources across locations is a major challenge. Therefore, to manage and share location-based projects, and moreover to help construction managers track distributed sites, project mapping now provides an all-in-one solution. With MAPOG, even a simple Excel sheet can quickly transform into an interactive map; as … Read more

Share an Interactive Map with Teammates (View or Edit Access)

Best Way to Share Interactive Maps Online with View and Edit Access

Today, readers and team members expect more than just static information when exploring content or managing data online. Whether it’s tracking locations, updating details, or monitoring progress, interactive maps make collaboration simple and engaging. With MAPOG, you can easily share an Interactive Map with teammates, assigning view or edit access to ensure the right people … Read more

Mapping Hotel Branches for Better Hospitality Management

Effectively managing several hotel locations is crucial for providing consistent service and upholding brand standards in the dynamic hospitality sector. By making it possible to visualise and analyse hotel branch data on interactive maps, Geographic Information Systems (GIS) provide a contemporary solution. Using intelligent GIS tools like MAPOG to map hotel branches improves decision-making, streamlines … Read more

Embedding Maps Boosts Website Engagement: Real Estate Agents

Embedding Maps Boosts Website Engagement: Real Estate Agents

In today’s competitive digital marketplace, real estate agents are increasingly turning to interactive tools to stand out and better serve their clients. One of the most impactful tools in this space is an embedded map. By leveraging Geographic Information Systems (GIS), agents can provide rich, interactive experiences that go far beyond static listings. Through this … Read more

Create an Online Map to Visualize and Collaborate on the 7 Wonders of the World

Learn geography & history by creating an interactive map that highlights the 7 Wonders of the World.

Discover geography and history by creating an interactive map of the 7 Wonders of the World—ideal for students, educators, and explorers. These iconic sites highlight human creativity, engineering, and cultural identity, each reflecting the unique legacy of its civilization. Using Geographic Information Systems (GIS), you can combine geography, history, and travel planning into an engaging … Read more

GIS in Infrastructure Development and Road Network Analysis

GIS in Infrastructure Development and Road Network Analysis

GIS (Geographic Information Systems) plays a transformative role in the Road Network Analysis development and analysis of infrastructure, particularly in designing and optimizing road networks. By integrating spatial data with planning tools, GIS enables engineers, urban planners, and policymakers to make data-driven decisions. It supports the entire infrastructure lifecycle—from feasibility studies and planning to construction … Read more

What Are Heatmaps and How to Create Heatmaps?

What Are Heatmaps and How to Create Heatmaps?

Ever wondered how to visualize data patterns effectively? Heatmaps are an excellent way to analyze trends, highlight intensities, and make data-driven decisions. Whether for website analytics, business insights, or geographic trends, heatmaps simplify complex datasets into easy-to-understand visuals. The best part? You can create heatmaps for free using tools like MAPOG’s Heat Map Style. Let’s … Read more

County-Wise Income Analysis: Thematic Mapping for Better Insights & Decision-Making

The difficulty of visualizing and analyzing earnings data is addressed in “Easy Income Analysis Using Thematic Maps for County-Wise Insights,” where we use quantity thematic styling to depict earnings across several geographic counties. Key Concepts Using quantity thematic design to visually display the income distribution across geographic blocks, the county-Wise Earnings Analysis in MAPOG offers … Read more