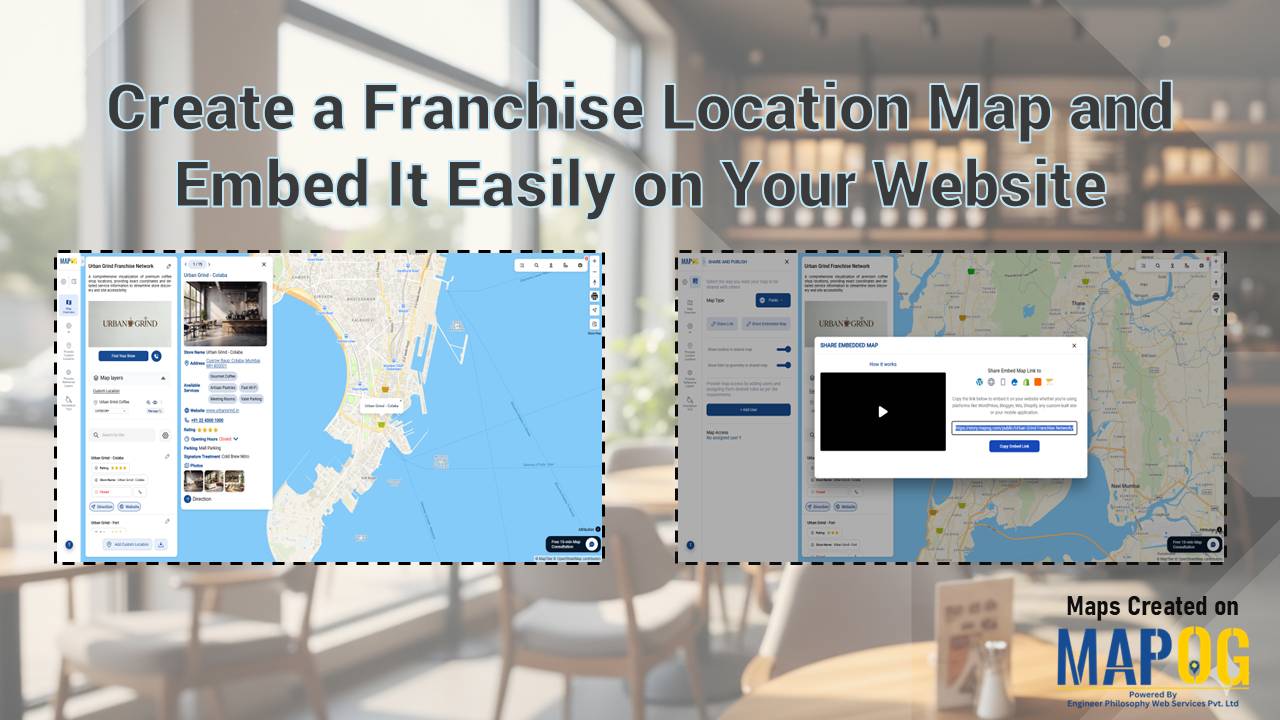
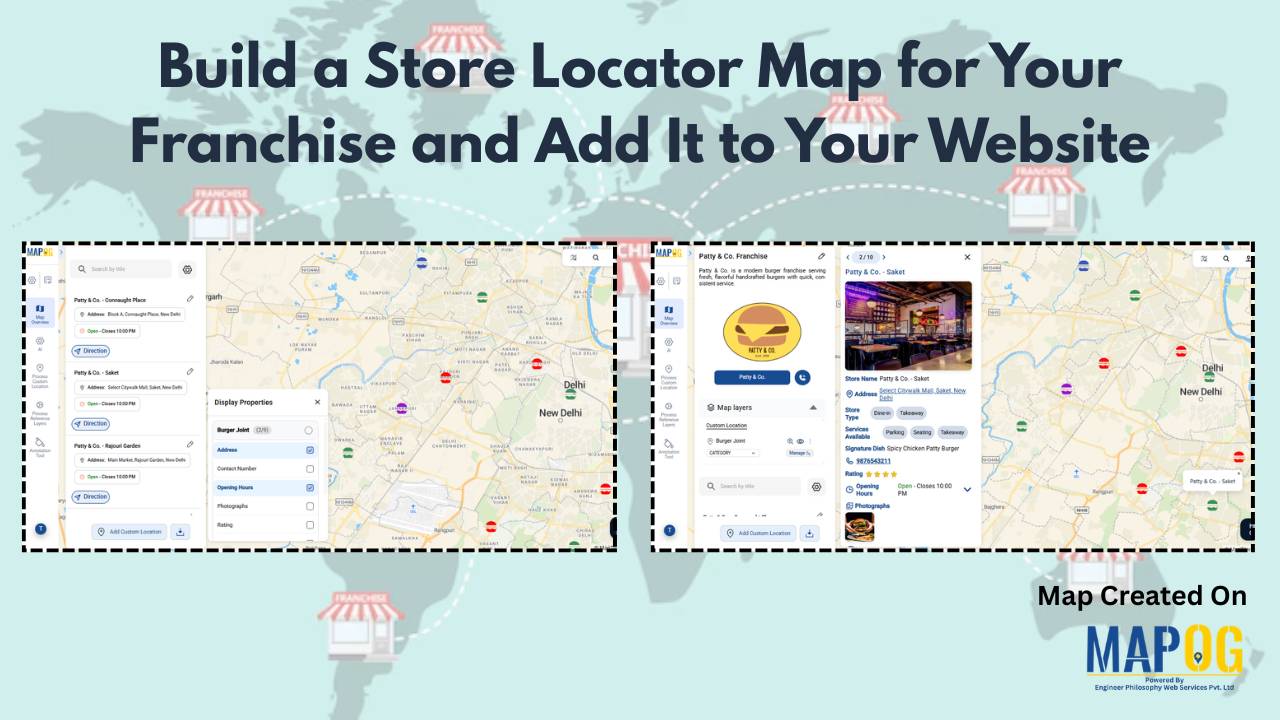
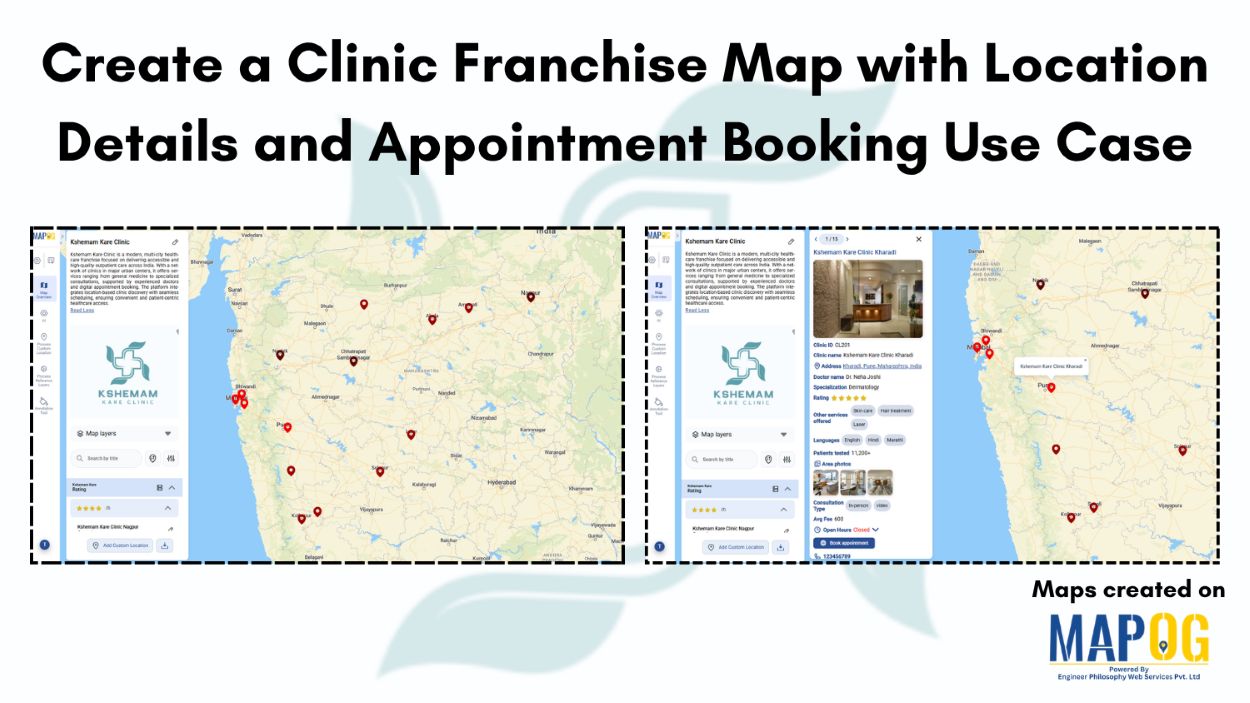
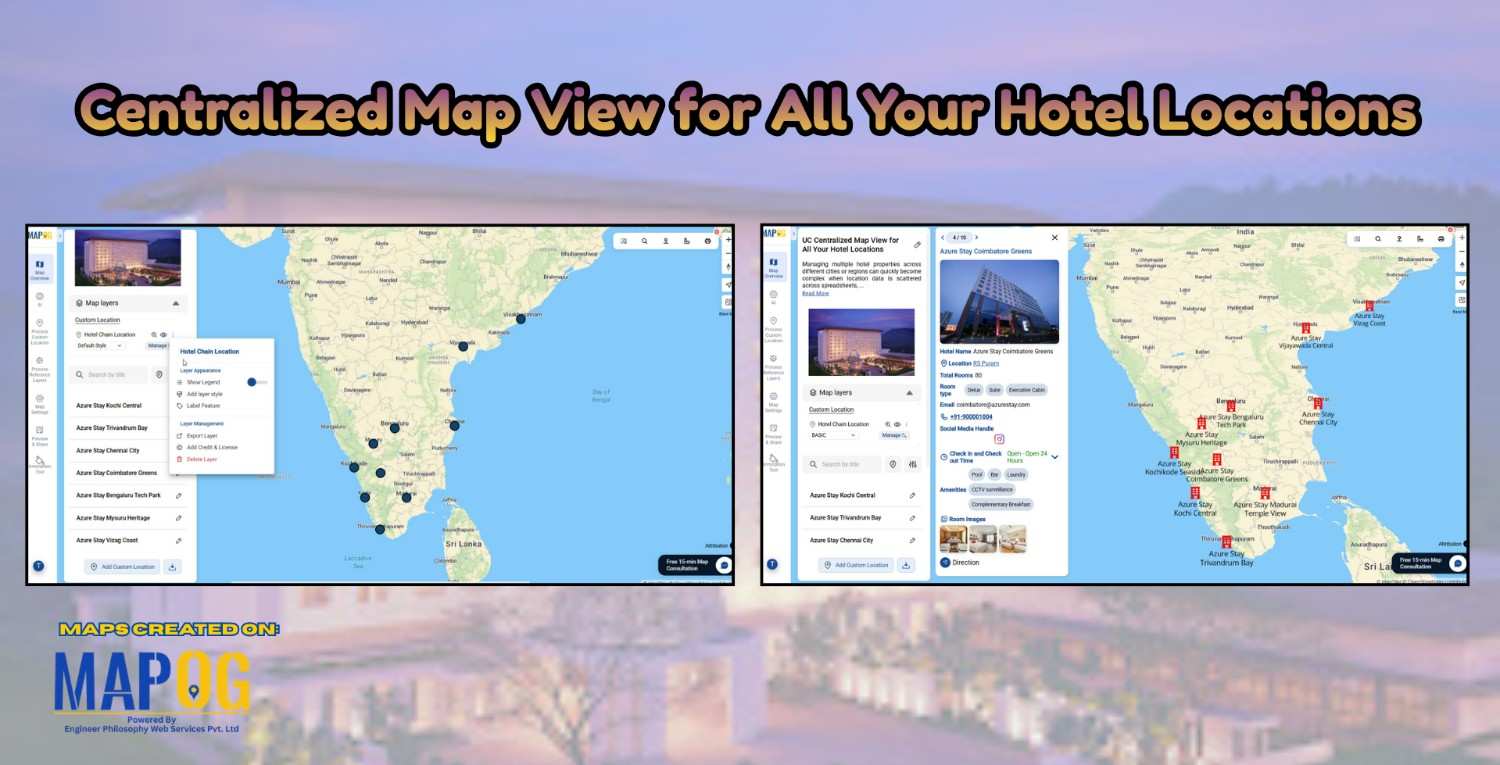
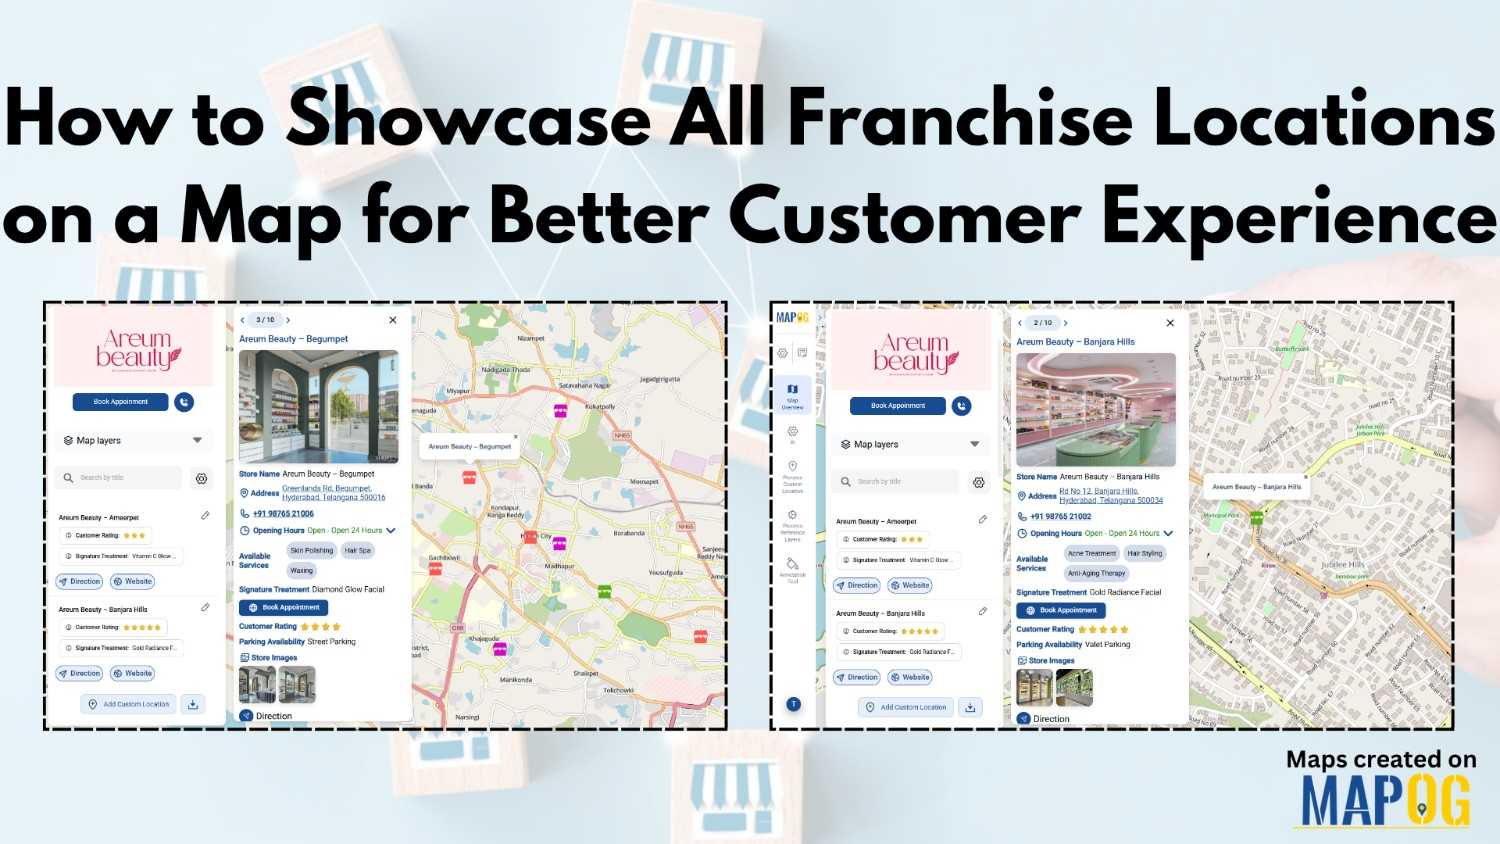
franchise business

How to Collect Customer Feedback On-Ground and view real-time responses on a live map using a mobile data collection platform.

How to Collect Customer Feedback On-Ground and See It Live on the Map

Today’s teams need real, unfiltered insights straight from the field. When you Collect Customer Feedback On-Ground, you get honest input right where customer experiences actually happen. MAPOG’s mobile data collection capability helps make this easier by letting teams gather feedback on-site and see it instantly on a map, giving everyone a clear and immediate view … Read more

Mapping and Planning Products Sales

Mapping and Planning Products Sales and Customers Efficiently

In today’s data-driven business world Mapping and Planning product sales is a necessary step, location is more than just an address; it’s an opportunity. Visualizing your customers on an interactive map helps your team uncover patterns, understand buying behaviors, and plan sales strategies that are not only smarter but also more efficient. With MAPOG, mapping … Read more

Image showing customer coverage map across multiple branches using colored pins and branch-level data.

How to Compare Customer Coverage Across Multiple Branches

When managing multiple branches, one persistent challenge is the lack of clarity around how customer coverage compares from one location to another. As a result, teams often struggle to make informed decisions. Without a structured way to compare customer coverage across multiple branches, they may rely on assumptions rather than spatial evidence. MAPOG helps solve … Read more

Cover image with article title and MAPOG screenshots showing customer location assignments to field teams.

How to Assign Customer Locations to Field Teams for Surveys

Efficient field surveys start with a clear plan, so you need a simple and accurate way to assign customer locations to field teams. When each member knows where to go, your operations move faster, data quality improves, and field time decreases. This structured approach strengthens tracking, balances workloads, and improves coverage. You can manage all … Read more

Download Your Mapped Data in Different Formats

Download Your Mapped Data in Different Formats

Interactive maps do more than just visualize locations—they also store valuable data that can be exported, shared, and analyzed across multiple platforms. For instance, whether you’re tracking coffee shops, field points, real estate listings, or even survey data. MAPOG lets you download your mapped data layers in formats like CSV, XLS, JPG, KML, or SHP. … Read more

Why Every Business Needs a Visual Map, Not Just a Dashboard

Why Every Business Needs a Visual Map, Not Just a Dashboard

Dashboards summarize numbers, but visual maps reveal where and why things happen. Business Needs a Visual Map for example, a coffee chain can use MAPOG to see café locations, spot top performers, and analyze competitor proximity in one interactive platform. Moreover, visual maps also help real estate, logistics, healthcare, and many other industries turn complex … Read more

5 Inspiring Examples of Interactive Dynamic Maps You Can Create Online

Interactive and dynamic maps not only transform data into actionable visuals but also let users explore, interpret, and share insights. With MAPOG, you can not only map portfolios, campuses, routes, or stores but also organize, analyze, and visualize trends; moreover, this enables clearer, faster, and connected decisions. Key Concept: Why Create Interactive Dynamic Maps? Interactive … Read more

Manage and Share Location-Based Projects Online with an All-in-One Mapping Tool

In today’s fast-paced project environments, tracking multiple sites, teams, and resources across locations is a major challenge. Therefore, to manage and share location-based projects, and moreover to help construction managers track distributed sites, project mapping now provides an all-in-one solution. With MAPOG, even a simple Excel sheet can quickly transform into an interactive map; as … Read more

Change Map Icons & Sizes Based on Your Data Values

Often, when faced with a large set of data, it is very difficult to visualize it together. We need the help of data visualization tool in digital maps. Suppose you are a businessperson, who owns several retail chain stores across the city and need to see the performance of your stores in an effective manner. … Read more

Share an Interactive Map with Teammates (View or Edit Access)

Best Way to Share Interactive Maps Online with View and Edit Access

Today, readers and team members expect more than just static information when exploring content or managing data online. Whether it’s tracking locations, updating details, or monitoring progress, interactive maps make collaboration simple and engaging. With MAPOG, you can easily share an Interactive Map with teammates, assigning view or edit access to ensure the right people … Read more