Use Case - Map Analysis

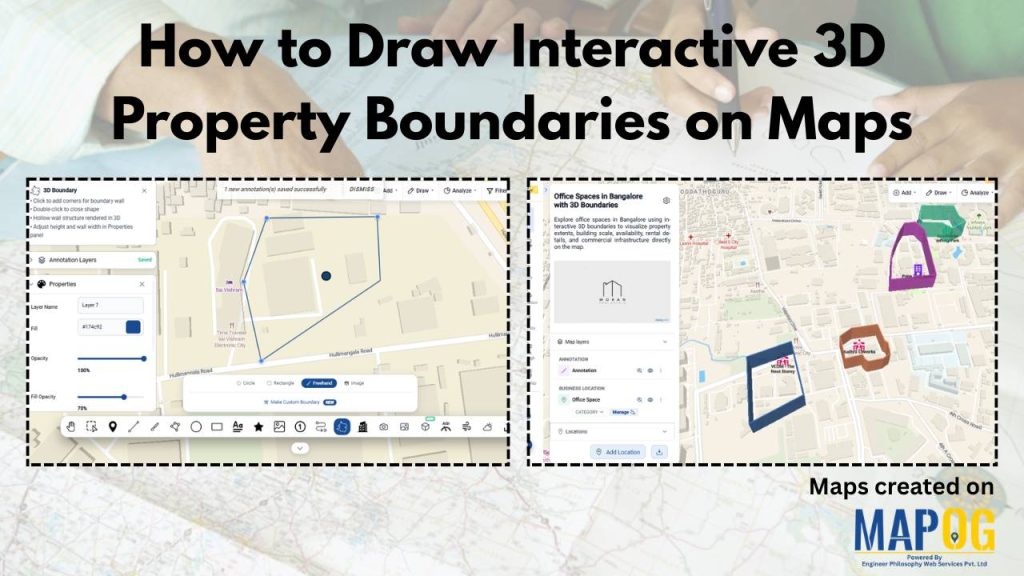
How to Draw Interactive 3D Property Boundaries on Maps
How to Draw Interactive 3D Property Boundaries on Maps

In industries like real estate, construction, infrastructure planning, campuses, and tourism, clearly defining areas on a map is essential for better visualization and decision-making. Interactive 3D property boundaries help transform flat maps into more engaging and easy-to-understand visual experiences. With MAPOG, you can create interactive 3D boundaries, customize their height and styling, organize locations, and … Read more

How Field Teams Can Capture and Submit On-Site Data with Offline Sync Using Mobile Devices
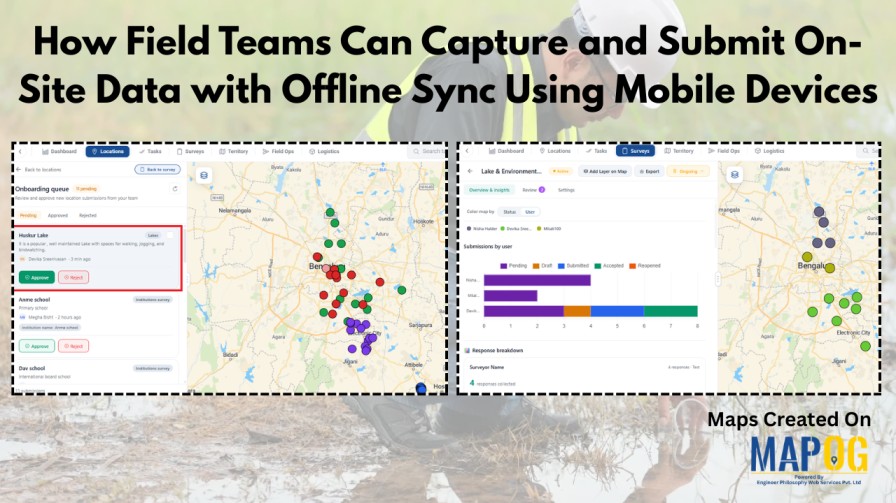
How Field Teams Can Capture and Submit On-Site Data with Offline Sync Using Mobile Devices

Field data collection rarely goes as planned—especially in areas with poor connectivity. Teams often rely on paper notes, scattered photos, or delayed updates, which leads to errors and messy datasets. This is where MAPOG makes a difference. With an offline-first approach, field teams can capture on-site data with offline sync, fill surveys, attach photos, and … Read more

Custom Information Template

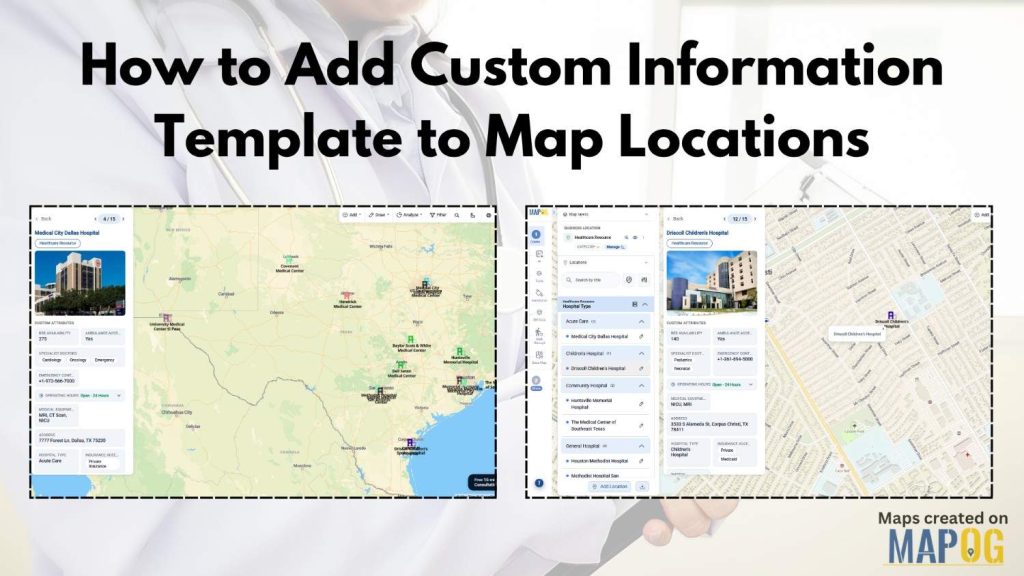
How to Add Custom Information Template to Map Locations
Managing location-based data is still a challenge for industries like healthcare, logistics, emergency response, and retail. Organizations often scatter data across spreadsheets, outdated records, and disconnected systems. As a result, teams struggle to update location details quickly or visualize important resources on a live map. However, MAPOG with custom information template is helping organizations create … Read more

Analyze Bridge and River Crossings

Analyze Bridge and River Crossings Using the Intersection Tool
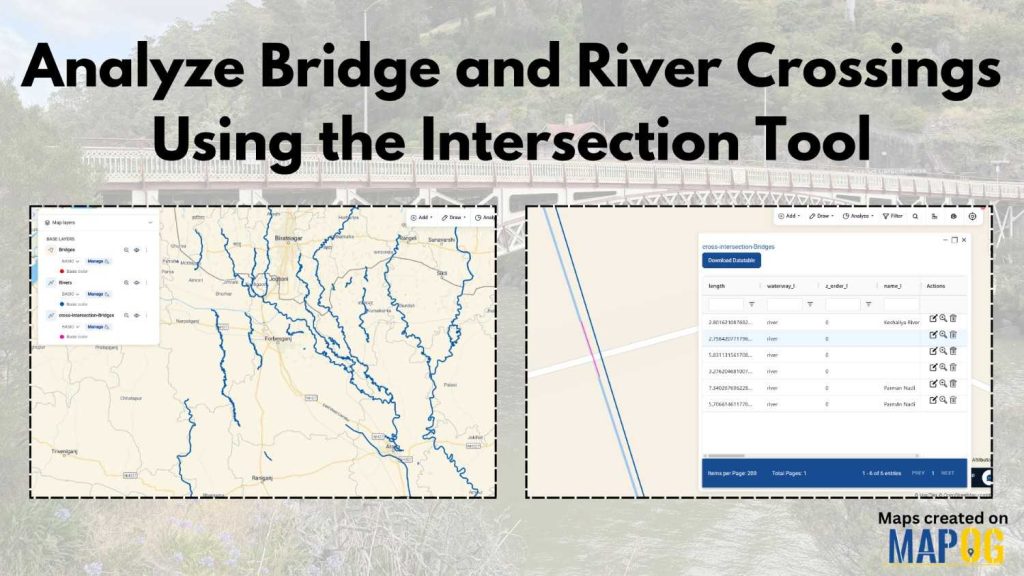
In infrastructure planning and environmental analysis, one persistent challenge is understanding where bridges intersect rivers and how these crossings impact safety, maintenance, and flood risk. Quite often, this data remains scattered, and therefore, decision-makers face slower and less accurate outcomes. However, when you analyze bridge river crossings using modern GIS tools, you can identify patterns … Read more

Plan multi day travel routes

Plan Multi-Day Travel Routes Using Interactive Maps
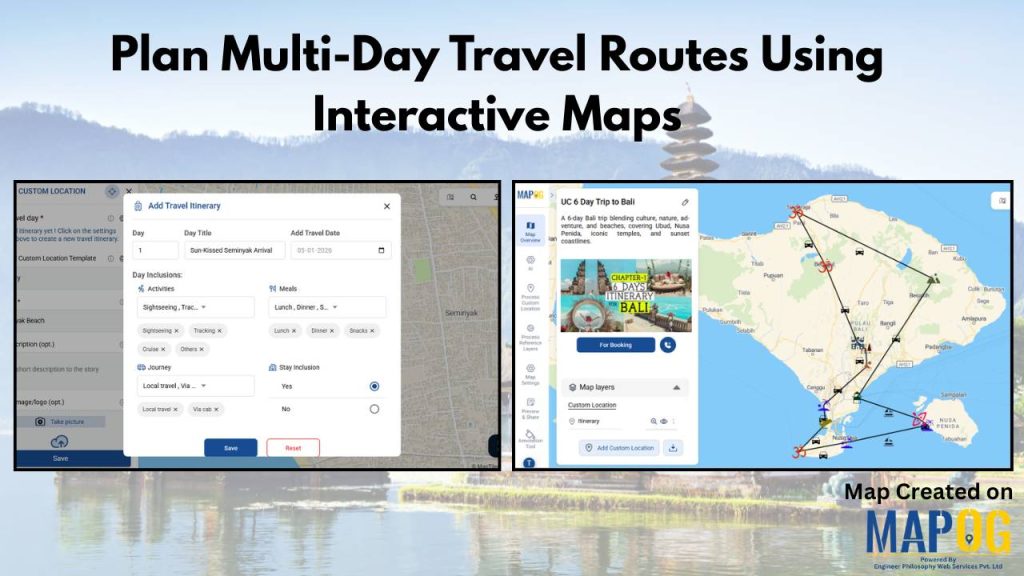
Having to plan multi-day travel routes can quickly become overwhelming when destinations, routes, and travel times aren’t clearly visualized. Traditional itineraries often fail to show how places connect across days, as a result, leading to inefficient routes, rushed schedules, and missed experiences. For travel agencies, and destination management companies, this lack of clarity complicates planning … Read more

Cover Image

Convert Your Excel or CSV Addresses Into a Map in a Simple Way
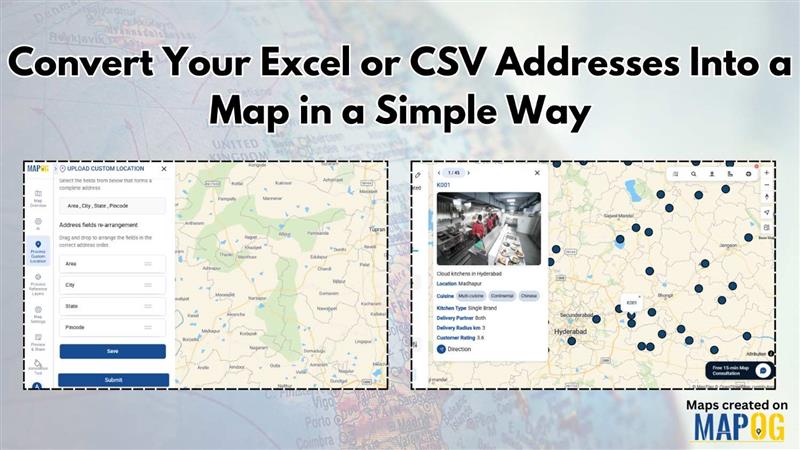
Working with address data in Excel or CSV is common, but understanding that data becomes much easier when you can see it on a map. Whether you’re managing customer locations, store outlets, survey responses, or delivery points, visualizing them geographically helps you uncover patterns, plan better, and make faster decisions. This is why many users now … Read more

cover image

Color-Code Your Customers by Purchase Behavior on a Map

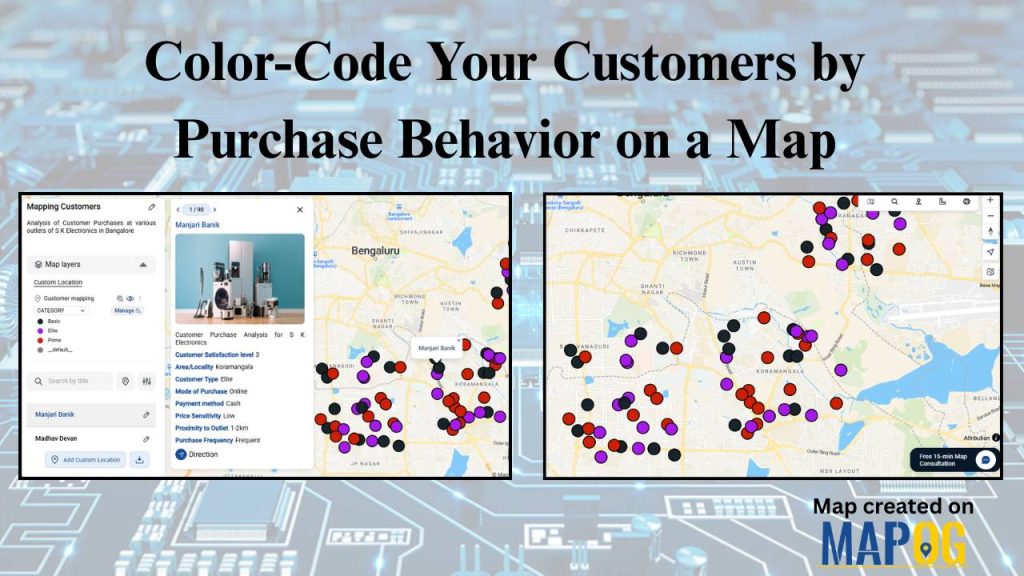
In today’s data-driven retail world, every customer leaves behind a digital footprint — where they live, how often they buy, and how much they spend. Yet, even with this information it can be difficult to decipher the bigger picture or understand where your most valuable customers actually come from. That’s why visualizing customer data matters. … Read more

Automated Tools to Calculate Bearing Angle and Distance on Maps

Automated Tools to Calculate Bearing Angle and Distance on Maps

In the world of navigation and surveying, bearing angle and distance measurements—from true north, clockwise in degrees, and along the ground—form the core of accurate mapping. Traditionally, these demanded manual calculations with compasses and trigonometric tables, risking errors in everything from land deeds to flight paths. However, automation has transformed this process. MAPOG computes bearing … Read more

Why Every Business Needs a Visual Map, Not Just a Dashboard

Why Every Business Needs a Visual Map, Not Just a Dashboard

Dashboards summarize numbers, but visual maps reveal where and why things happen. Business Needs a Visual Map for example, a coffee chain can use MAPOG to see café locations, spot top performers, and analyze competitor proximity in one interactive platform. Moreover, visual maps also help real estate, logistics, healthcare, and many other industries turn complex … Read more

5 Inspiring Examples of Interactive Dynamic Maps You Can Create Online

Interactive and dynamic maps not only transform data into actionable visuals but also let users explore, interpret, and share insights. With MAPOG, you can not only map portfolios, campuses, routes, or stores but also organize, analyze, and visualize trends; moreover, this enables clearer, faster, and connected decisions. Key Concept: Why Create Interactive Dynamic Maps? Interactive … Read more