In the realm of ‘Petrol Pump Availability: Empowering Access’, MAPOG stands as a powerful tool, offering insights that can redefine our understanding of spatial dynamics. In a world constantly moving, access to petrol pumps is paramount. At MAPOG, we’re dedicated to providing a comprehensive solution for visualizing and analyzing Petrol Pump Accessibility: A Spatial Analysis.
Key Concept For Petrol Pump Accessibility: A Spatial Analysis
Petrol pump availability is essential for efficient navigation and strategic planning. By understanding the spatial distribution of petrol pumps, we can optimize routes and enhance accessibility. Links to the data are provided at the end of this article. Also, check out our other blogs, Precision Agriculture: Using GIS Buffer Zones for Eco-Friendly Fertilizer Management, Create a Map to find suitable sites for constructing a new house.
Process For Petrol Pump Availability: Empowering Access:
Step 1:
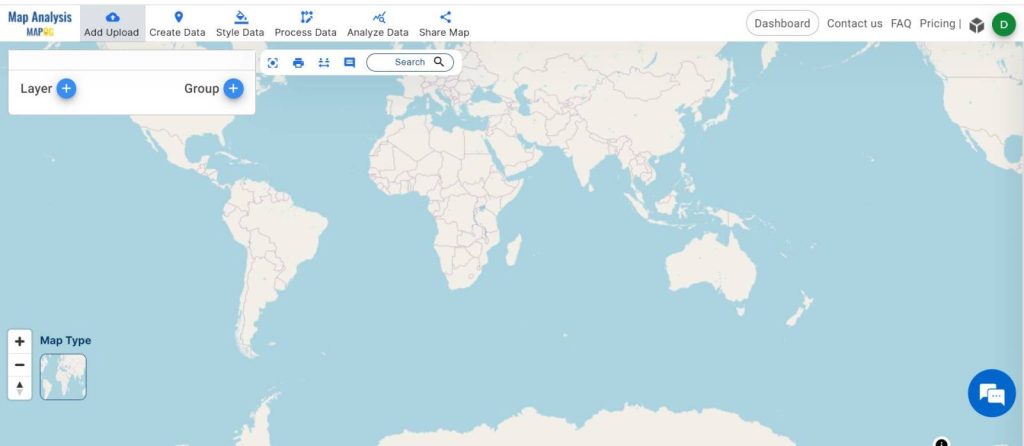
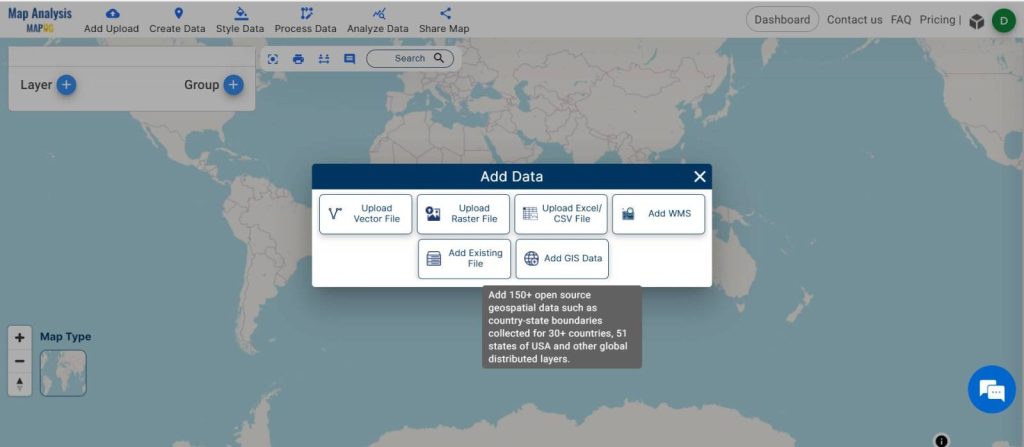
First, open the MAPOG Map Analysis interface. Next, navigate to the “Add Upload” and go to “Add GIS Data“.
Step 2:
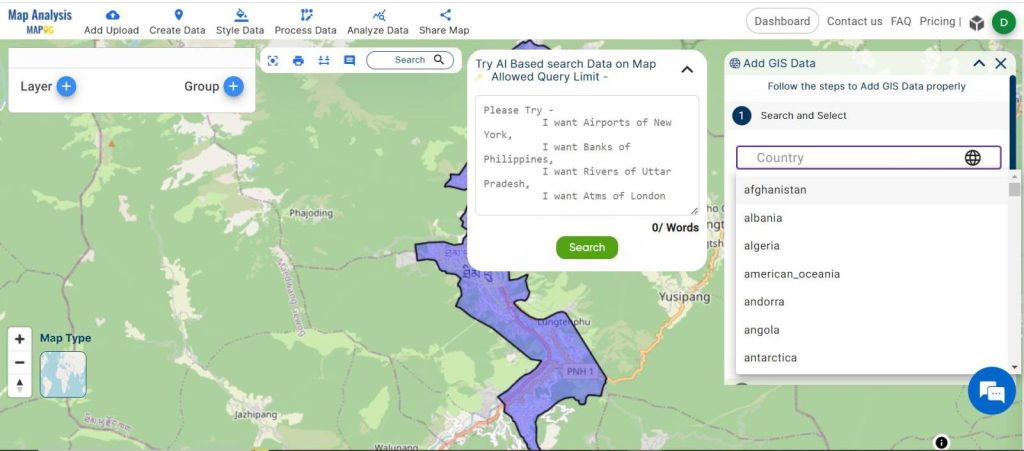
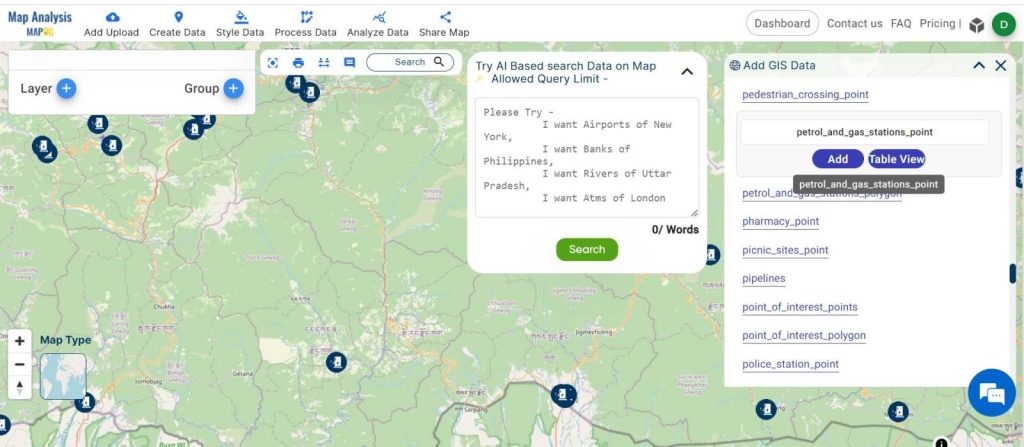
Now, choose the country for which you want to analyze petrol pump and gas station data. Then choose “Petrol Pump and Gas Station” point data and “Add”.
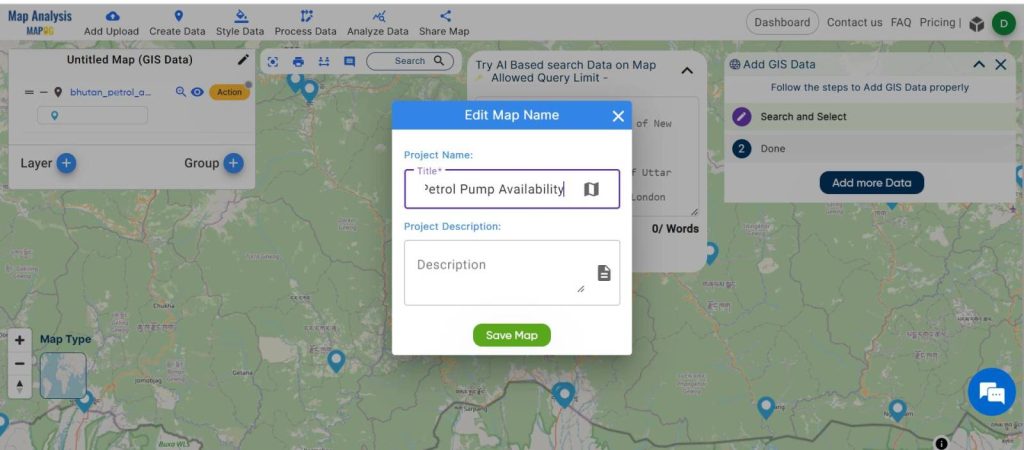
Step 3:
Once the data is successfully added, give a name to the layer from “Edit Map Name”. Enter the name, “Petrol Pump Availability,” and ‘save map’.
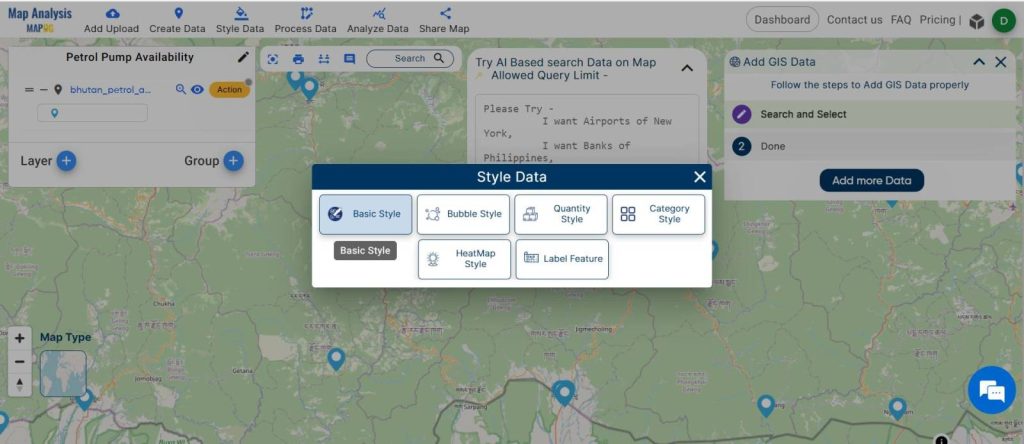
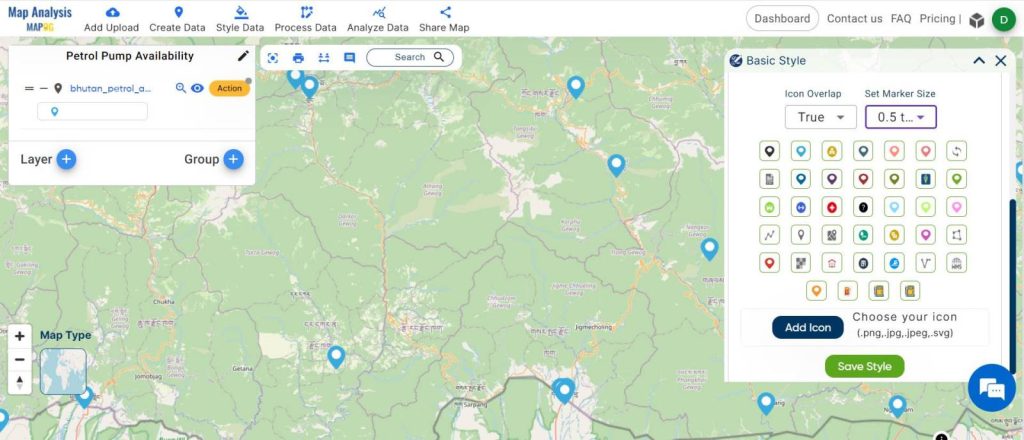
Step 4:
To enhance visualization, modify the appearance of the petrol pump and gas station data by changing the colour and icon associated with it. Navigate to the “Style Data“, select “Basic Style,” choose the desired icon, and ‘save style’.
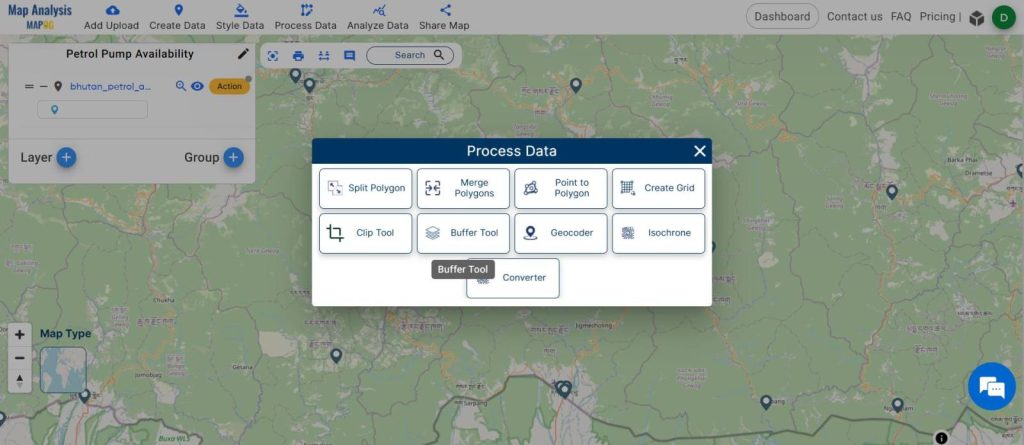
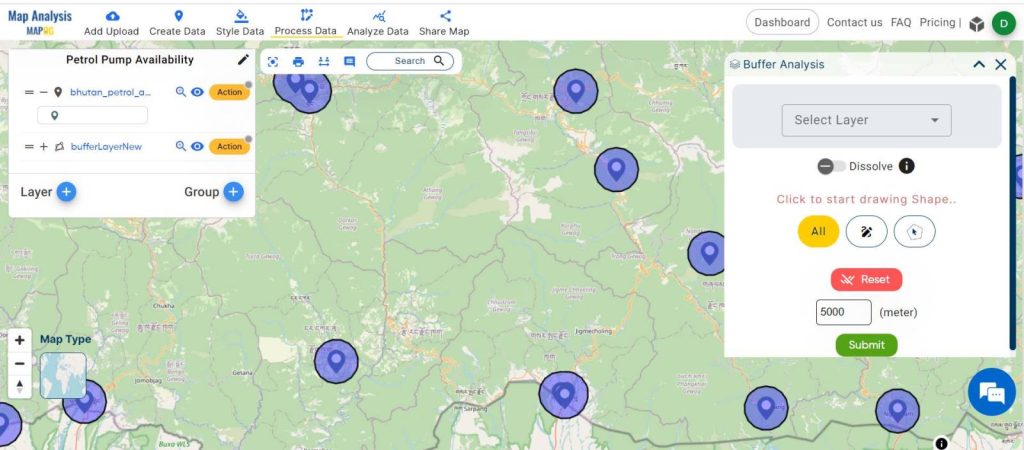
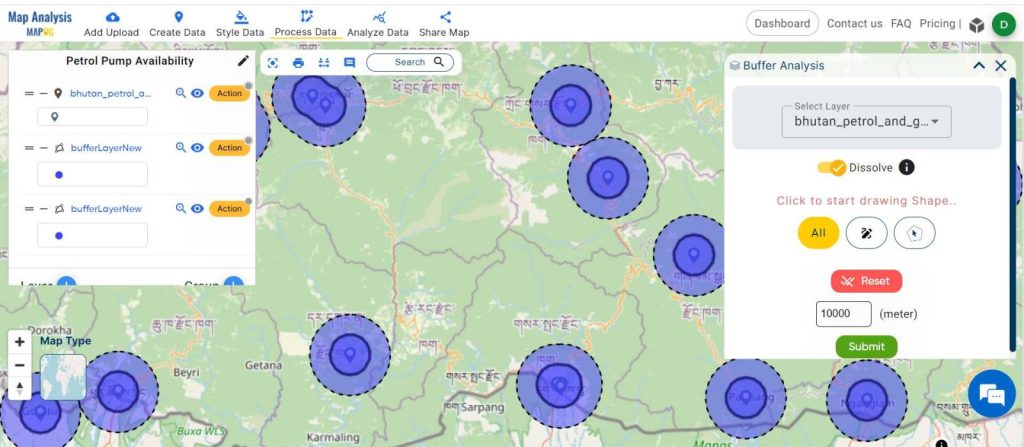
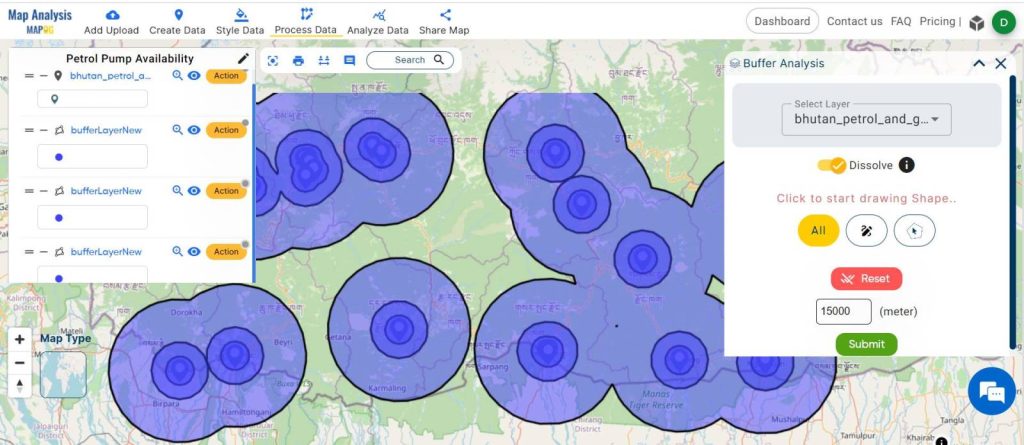
Step 5:
Utilize buffer zones to delineate areas of influence around petrol pump and gas station locations. Access the “Process Data“, then select “Buffer Tool,”. First, select the layer, then put the range of 5000 meters and submit. Also, create 10000 and 15000 meters buffer zones similarly.
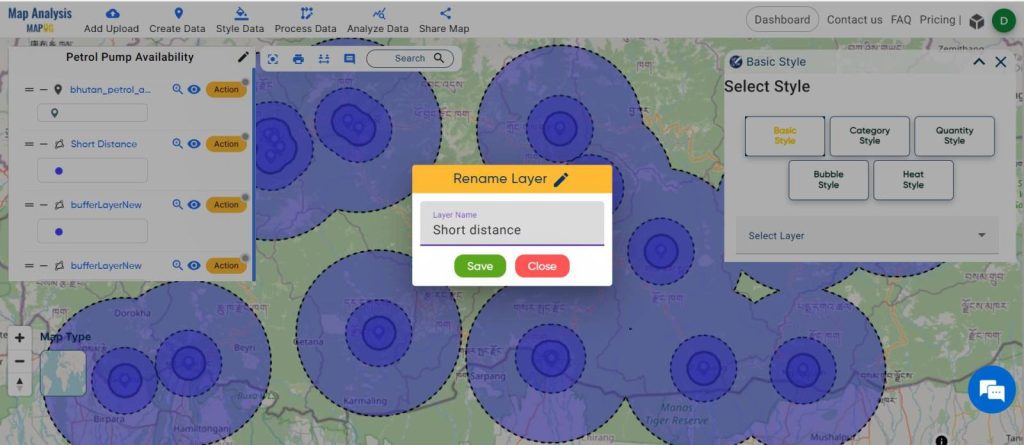
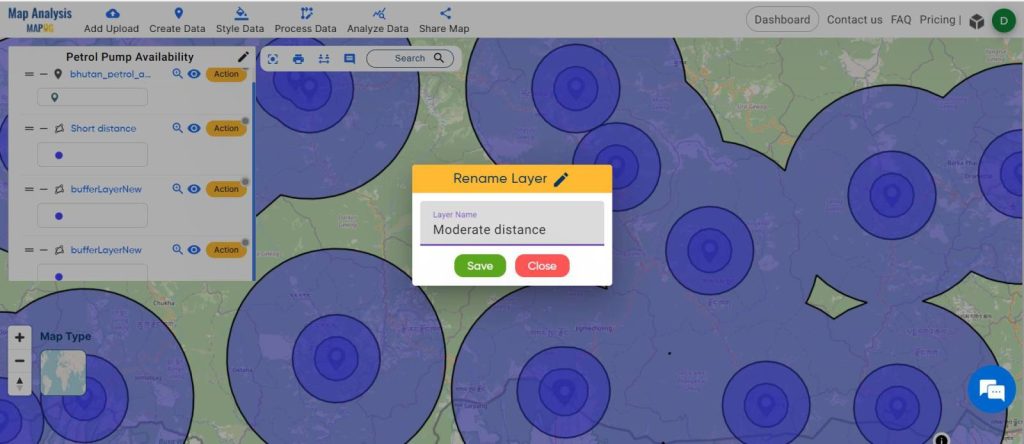
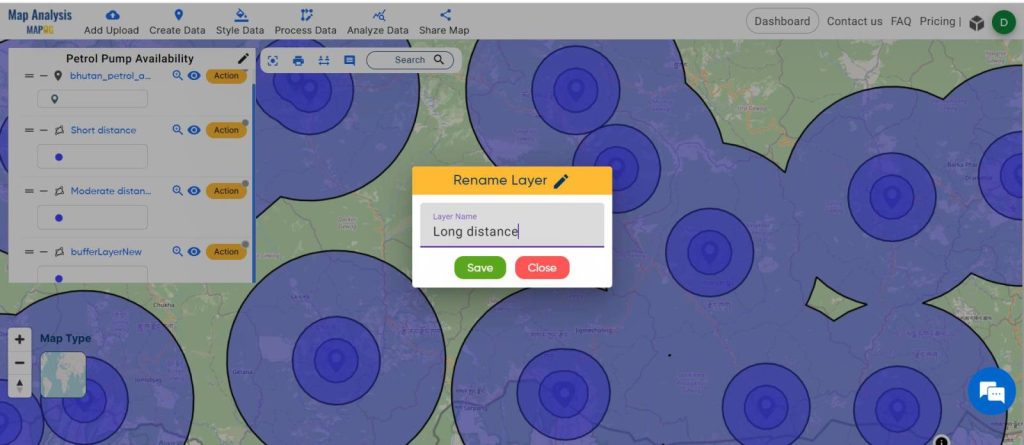
Step 6:
Now, organize your map by renaming the buffer layers according to their respective ranges. Just go to the action button from the respected layer and rename. Name the 5000-meter zone as “Short Distance,” the 10,000-meter zone as “Moderate Distance,” and the 15,000-meter zone as “Long Distance.”
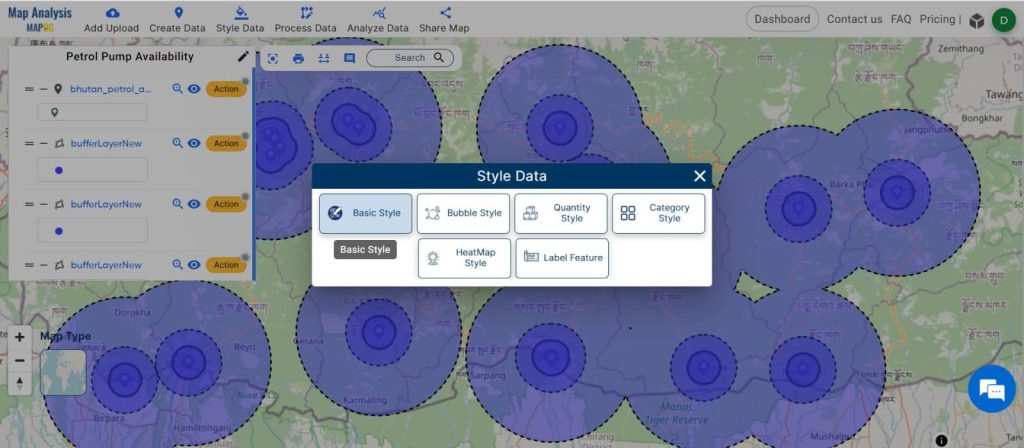
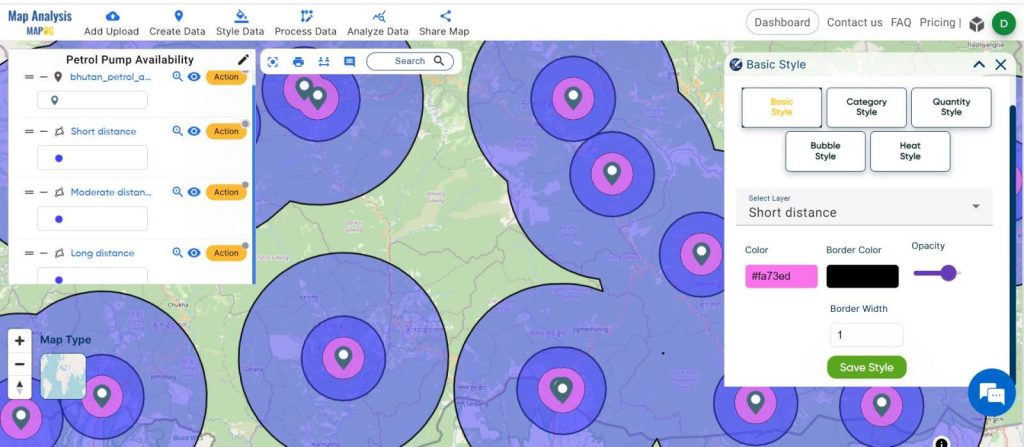
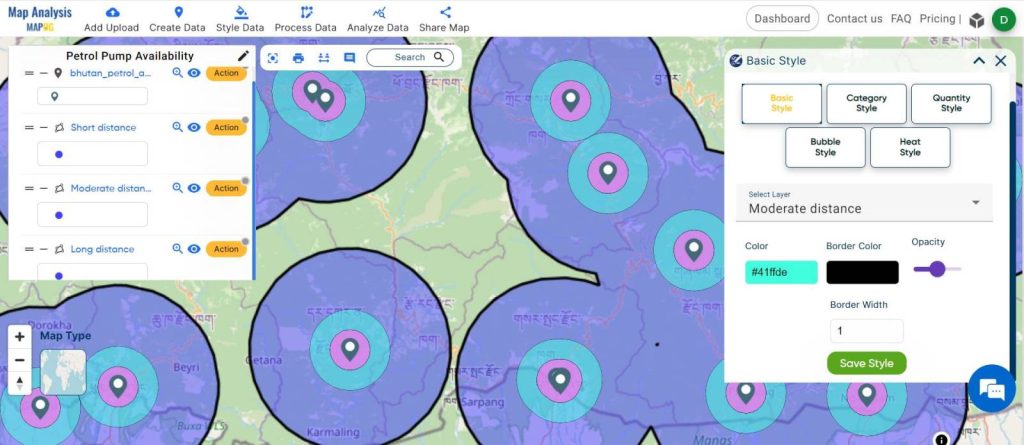
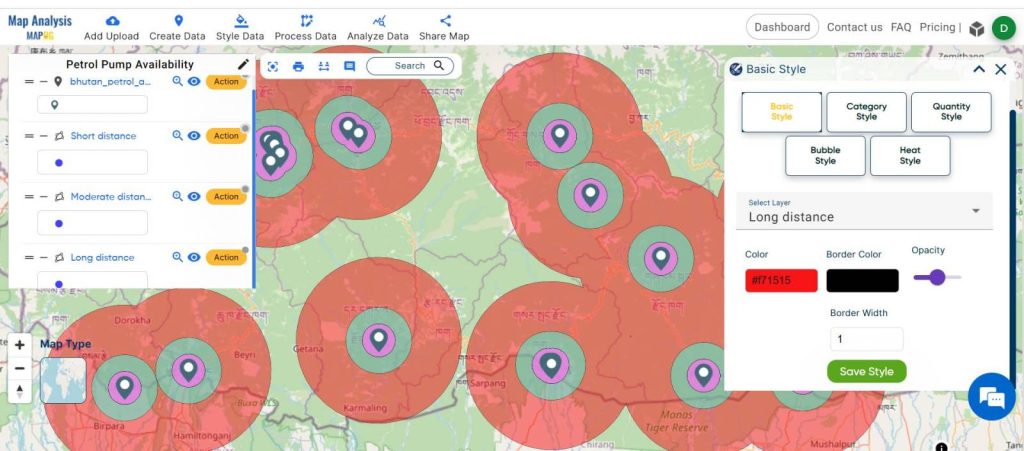
Step 7:
Improve visual clarity by adjusting the colors of the buffer zones to differentiate between different distance ranges. Go to “Style Data“, select “Basic Style,” and select the layer first. then customize the color, and ‘save style’. Change all three buffer zones’ colors like this.
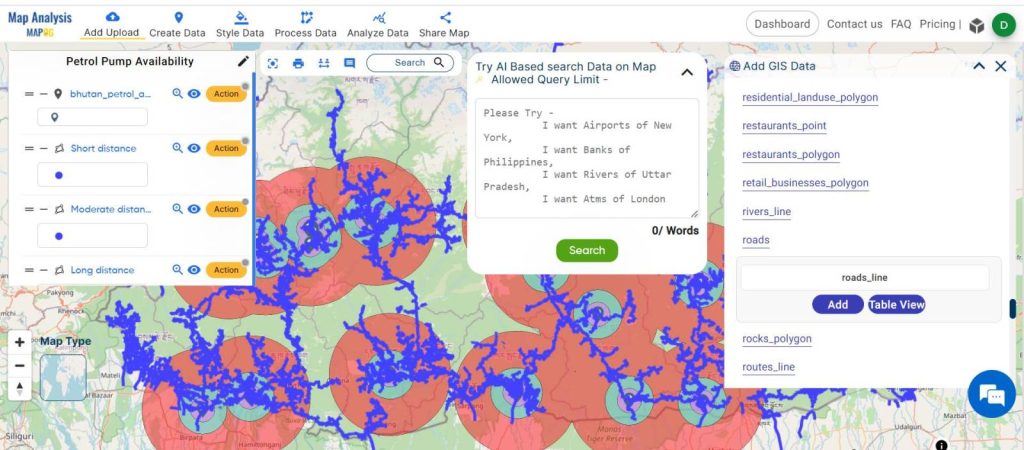
Step 8:
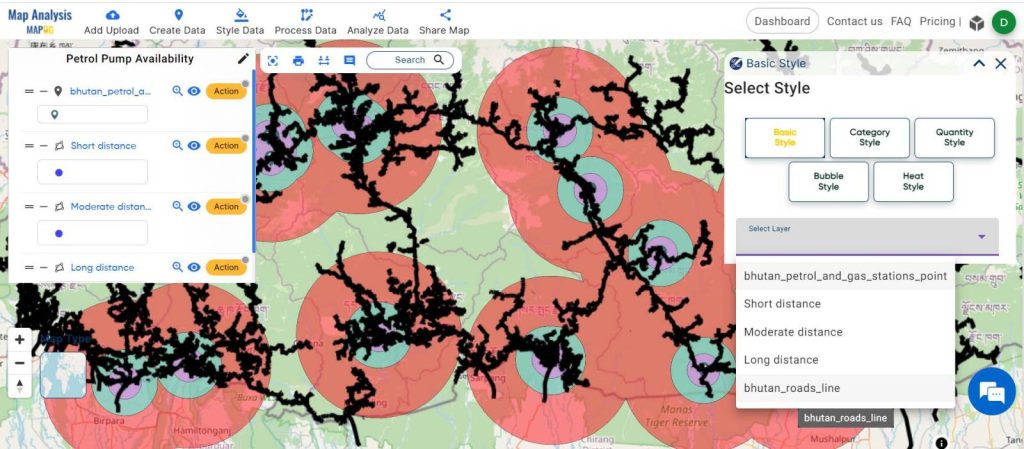
Now let’s enhance spatial context by incorporating road data onto your map. Go to “Add Upload“, select “Add GIS Data,” choose country, and then select appropriate road line data, and add. It’s now added to the map.
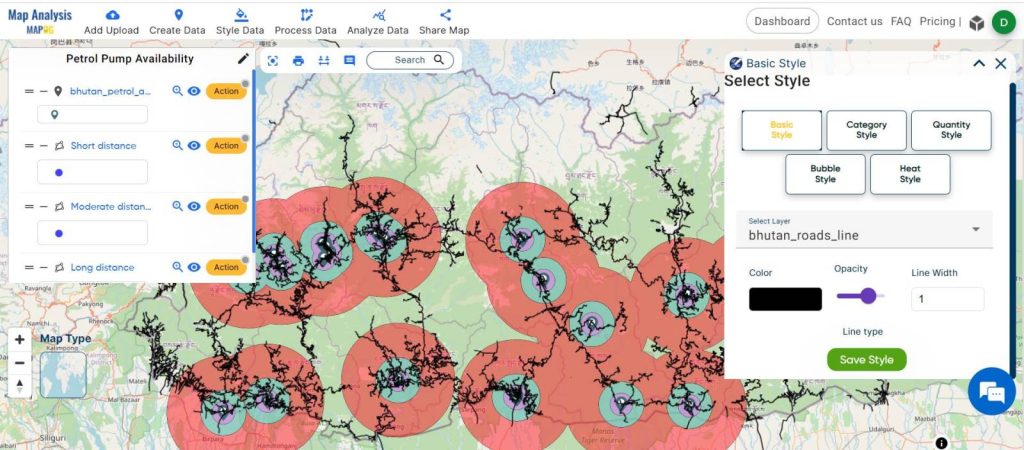
Step 9:
Tailor the appearance of the road data to your preferences by accessing the “Basic Style” options and adjusting parameters such as line thickness, color, and transparency. And save style.
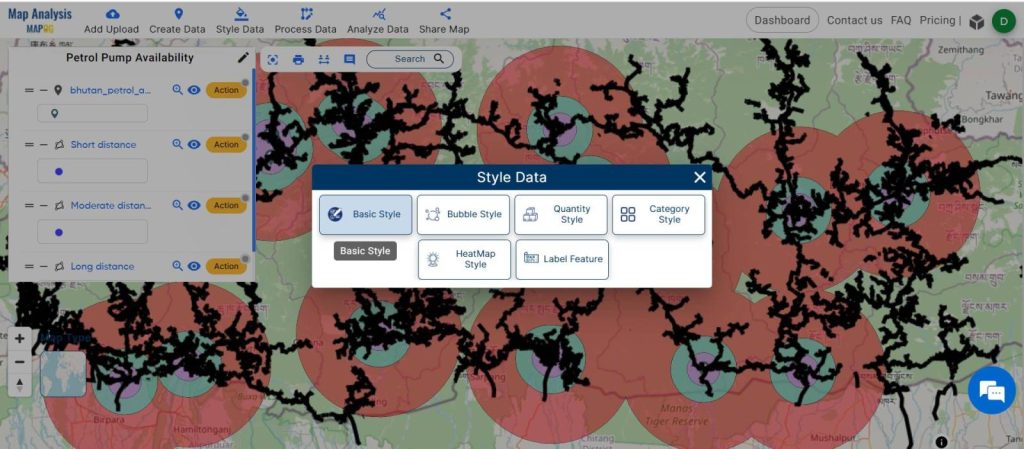
Step 10:
The final map is ready now. Where we have three buffer zones around each petrol pump. And also see the road networks.
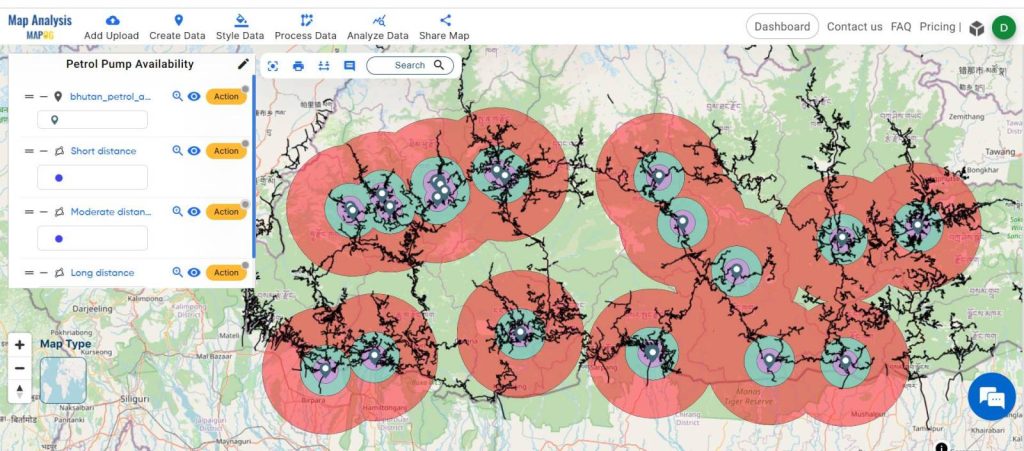
Major Findings From Petrol Pump Availability: Empowering Access:
- Spatial Distribution: Our analysis reveals the spatial distribution of petrol pump availability, highlighting clusters and gaps in coverage.
- Distance Accessibility: By creating buffer zones around petrol pump locations, we identify areas with varying levels of accessibility based on distance.
- Route Optimization: Insights from our analysis enable route optimization for drivers, ensuring efficient fueling stops and reducing travel time.
Industry and Domain:
- Transportation Companies: Optimizing routes for fleets and logistics operations to minimize fueling delays and reduce operational costs.
- Urban Planners: Enhancing city infrastructure by strategically locating new petrol pump facilities to improve accessibility for residents and commuters.
- Drivers: Empowering drivers with information on petrol pump locations and accessibility to facilitate smoother travel experiences and reduce fuel-related stress.
- Fuel Industry: Informing strategic decisions related to petrol pump placement, marketing initiatives, and supply chain management to meet consumer demand effectively.
Conclusion:
Our analysis of petrol pump availability on the MAPOG platform offers a comprehensive solution for spatial analysis and visualization. By harnessing the power of location intelligence, we empower users with actionable insights to navigate efficiently and strategically. As we continue to drive innovation in the realm of GIS, we remain committed to unlocking new possibilities and delivering impactful solutions with MAPOG.