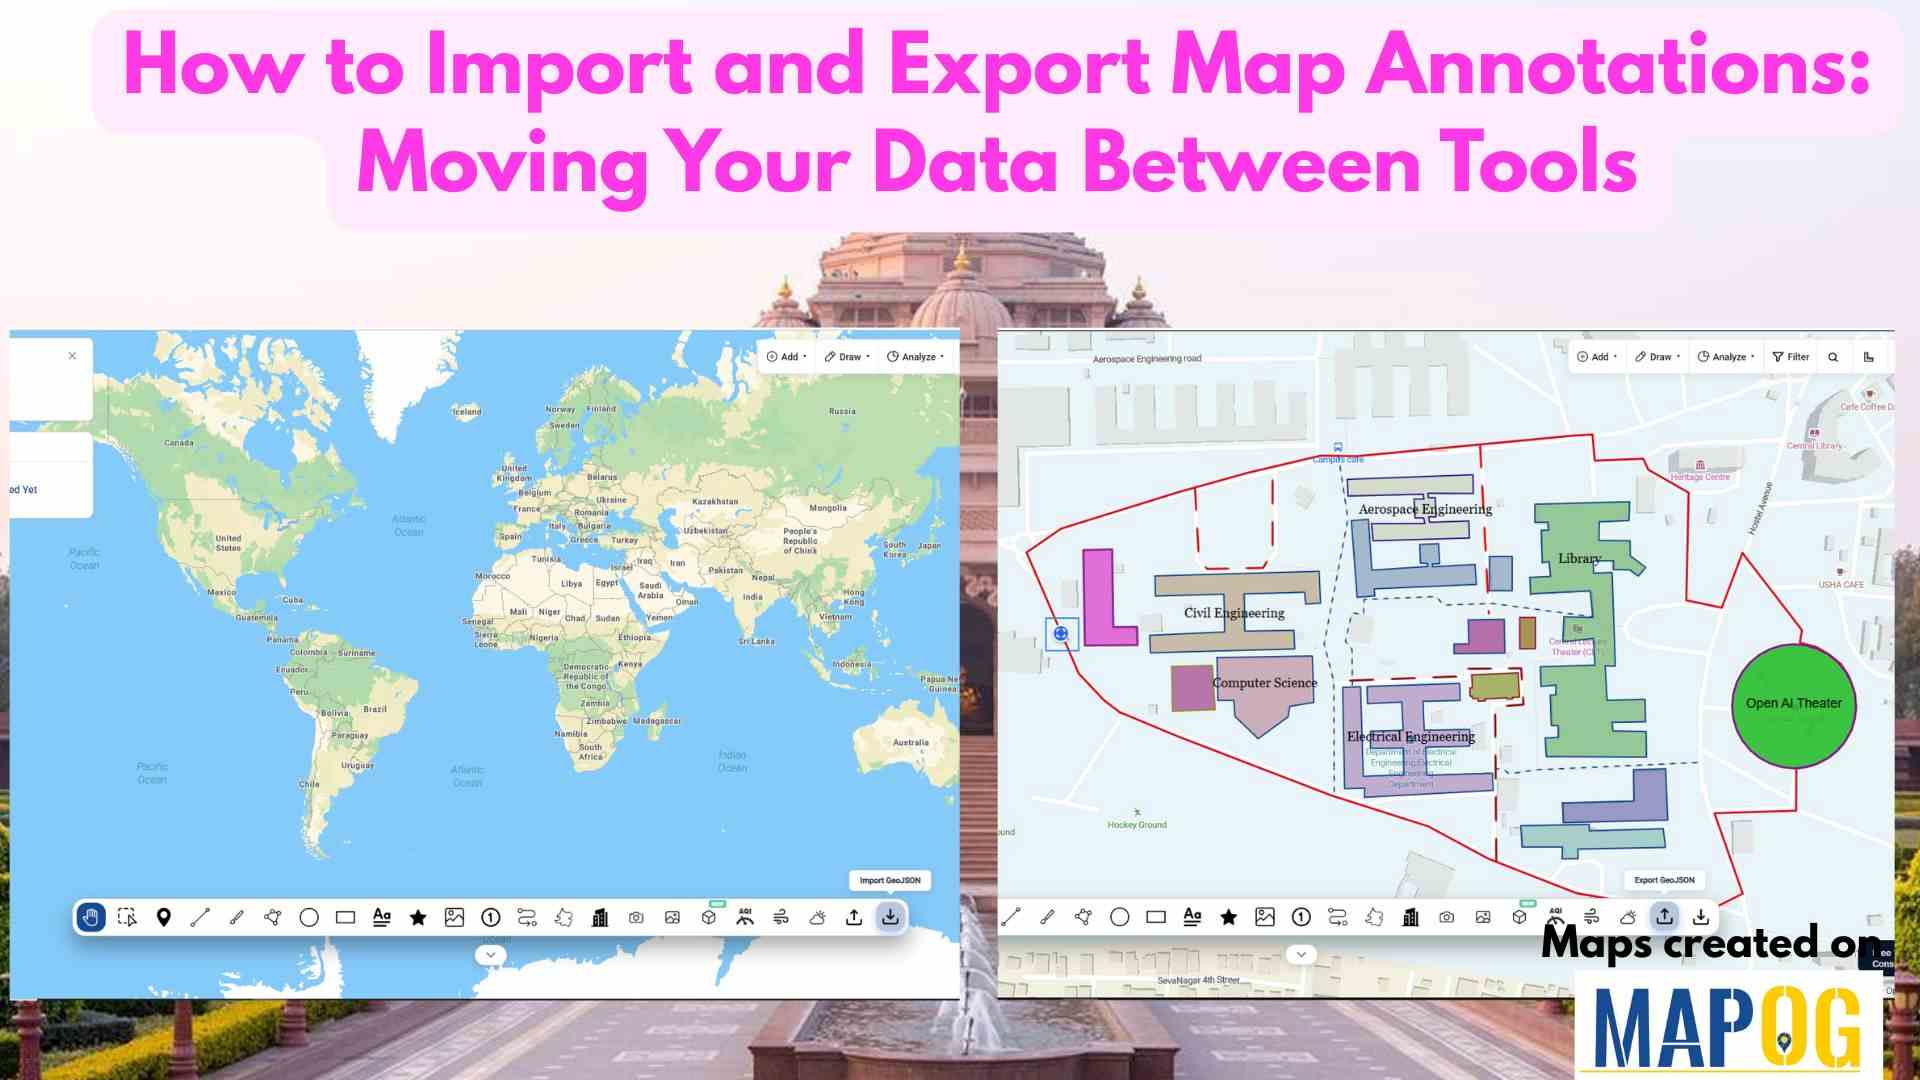
shapefile

Map Farm Land Using Satellite Images

Map Farm Land Using Satellite Images and Add Crop Details with Polygons

Managing agricultural land is challenging due to the need for monitoring large areas. Farmland boundaries, crop types, and seasonal cycles often stay in spreadsheets, causing missed insights when planners map farm land. MAPOG utilizes satellite imagery and georeferencing to map farm land with polygon layers, allowing users to incorporate details like sowing and harvesting dates. … Read more

Real Estate Site Planning

Real Estate Site Planning and Feasibility Analysis Using GIS

In the competitive real estate market, site planning has become increasingly complex, often leading to project delays and increased costs due to challenges in evaluating land suitability and environmental constraints. However, GIS-based workflows, such as those provided by MAPOG, simplify these challenges by allowing planners to visualize and analyze site feasibility effectively, resulting in more … Read more

Interface showing how to download the you mapped data in different formats and different ways.

How to download the you mapped data in different formats

In geospatial projects, one of the biggest hurdles is data lock‑in. Often, mapping platforms restrict downloads to limited formats, forcing teams to spend extra time converting files or risking the loss of important attributes. Consequently, collaboration slows and efficiency drops. MAPOG addresses this challenge by making it simple to download mapped data in a format … Read more

How to Draw 3D Buildings

How to Draw 3D Buildings on a Live or Dynamic Map

In the world of digital mapping, the concept of 3D mapping has changed how we visualize spaces. MAPOG is a mapping tool which allows users to draw realistic 3D buildings with ease, specifically for urban planning, real estate visualization, or educational use. Key Concepts of 3D Buildings You Should Know Drawing 3D buildings on a … Read more

5 Inspiring Examples of Interactive Dynamic Maps You Can Create Online

Interactive and dynamic maps not only transform data into actionable visuals but also let users explore, interpret, and share insights. With MAPOG, you can not only map portfolios, campuses, routes, or stores but also organize, analyze, and visualize trends; moreover, this enables clearer, faster, and connected decisions. Key Concept: Why Create Interactive Dynamic Maps? Interactive … Read more

Uploading shapefiles

How to Import Shapefiles into an Online Mapping Tool

Shapefiles are a popular format for storing geographic data, often used in GIS to define boundaries, and spatial attributes. However, How to Import Shapefiles into an Online Mapping Tool can be complex and difficult to interpret for non-technical audiences or in decision-making processes. Importing shapefiles into MAPOG  transforms static data into interactive, shareable maps that … Read more

Measure Distance & Area on a Map (Free Online Tool)

Measure Distance & Area on a Map (Free Online Tool)

Measuring distance and area is a fundamental tool with a wide range of applications like calculating land parcels, determining the lengths of roads and rivers. Leveraging MAPOG one can measure distance and area enabling to analyze and manage geospatial data for more informed and efficient decision making. Key concept and importance The key concept of … Read more

GIS in land use and zoning analysis for better city planning

GIS in Land use and Zoning analysis for better city planning

In today’s fast-changing urban landscape, GIS in land use and zoning analysis for better city planning plays a vital role in shaping smarter, more livable cities. Whether it’s managing population growth, conserving green spaces, or optimizing infrastructure, city planners increasingly depend on GIS to make informed decisions. This article explores how GIS tools enhance zoning … Read more

Flood Risk Mapping with Interactive Web Maps: A SaaS Platform Approach

Flood Risk Mapping with Interactive Web Maps: SaaS Approach

A SaaS-based flood risk mapping platform leverages interactive web maps to provide risk assessments. Using GIS, AI, and hydrological data, it enables governments, insurers, and communities to visualize flood-prone areas, enhance preparedness, and optimize response strategies. Cloud-based accessibility ensures scalability, data integration, and seamless user collaboration for proactive risk management. Key Concept How Flood Risk … Read more

Role of GIS In Irrigation Planning and Water Resource Management

Role of GIS In Irrigation Planning and Water Resource Management

GIS plays a vital role in irrigation planning and water resource management by optimising site selection, assessing water demand, designing irrigation networks, and analysing crop suitability. Additionally, it enhances decision-making through spatial analysis, monitors water distribution, prevents water logging, and integrates data for sustainable and efficient water resource utilisation. Key Concept in Monitoring GIS in … Read more