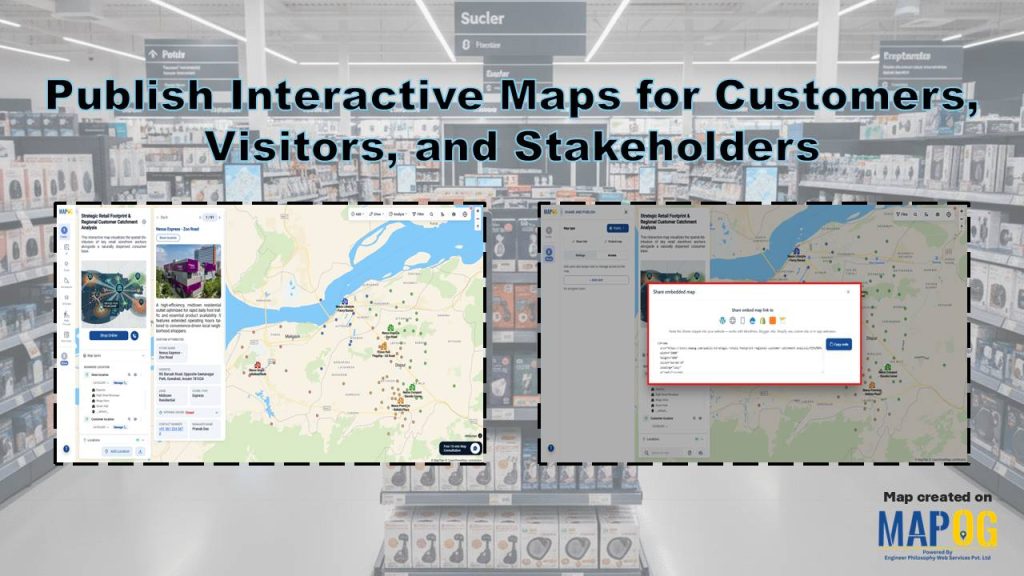
Retail businesses operate across multiple locations and serve diverse regions, so they need efficient ways to share store locations and catchment areas. Many retailers now Publish Interactive Maps for Customers to deliver clear location insights. These maps help customers find nearby stores and explore details quickly, while stakeholders gain visibility into market reach. MAPOG simplifies this process through interactive mapping and CSV or Excel uploads, enabling fast and accurate map publishing.
Key Concept of Publish Interactive Maps for Customers
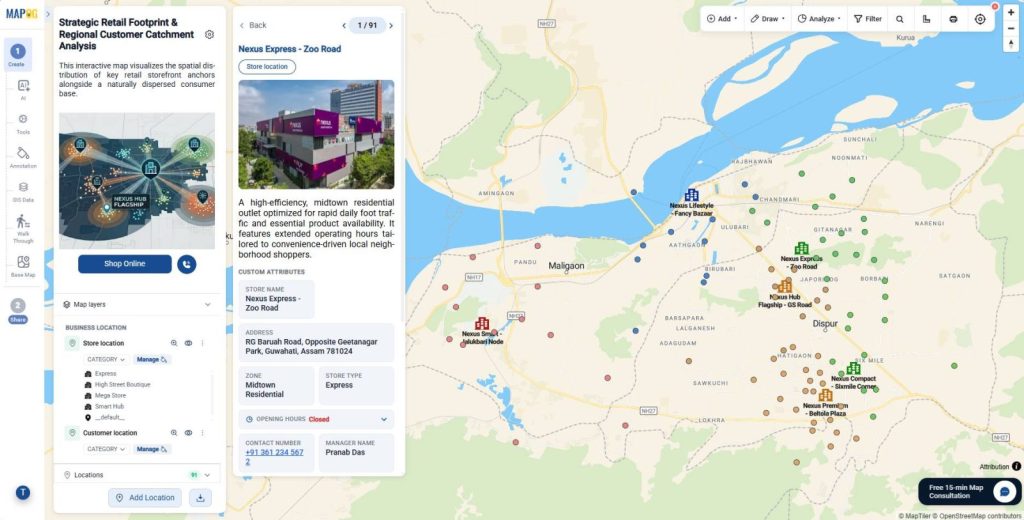
The core idea behind Publish Interactive Maps for Customers is to present store and catchment data in a clear, usable format. Retailers show store locations, catchment areas, delivery zones, and coverage on one map.
Interactive maps include filters, search, and store details. Customers find the nearest store quickly, while stakeholders review coverage and growth areas. As a result, retailers improve engagement and share location insights more clearly.
Steps- by- Step Workflow to Create Interactive Maps
1. Create a New Map
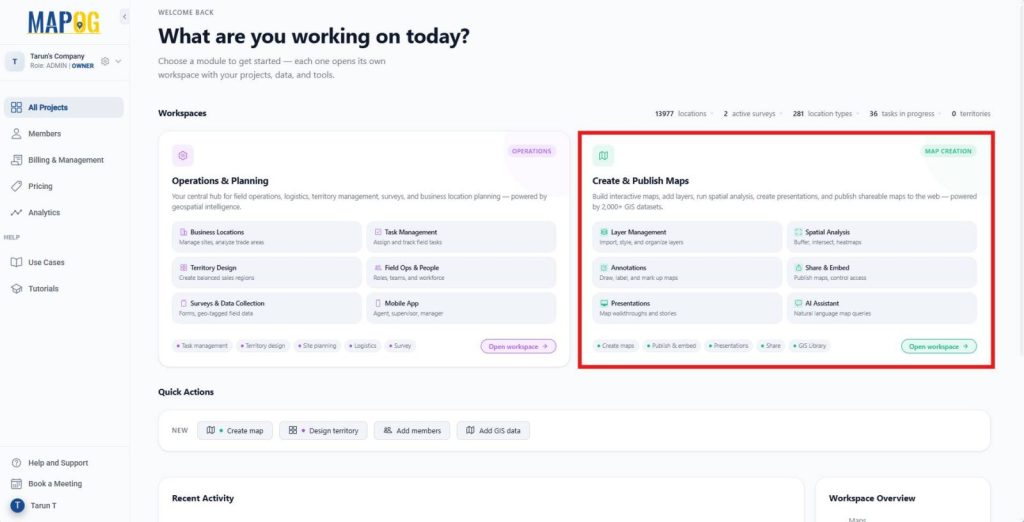
First, log in to the MAPOG and open the Create & Publish Maps module.
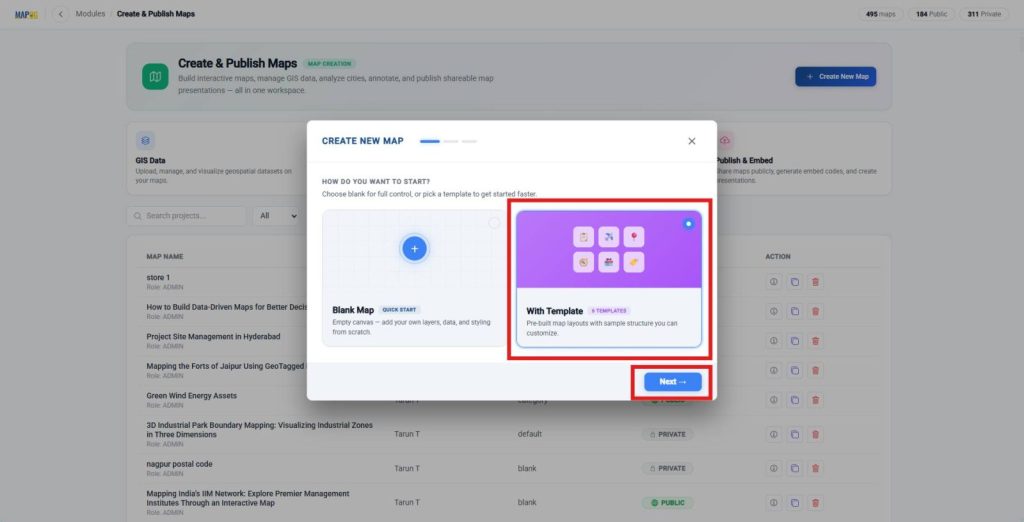
Next, click Create New Map and select with Template.
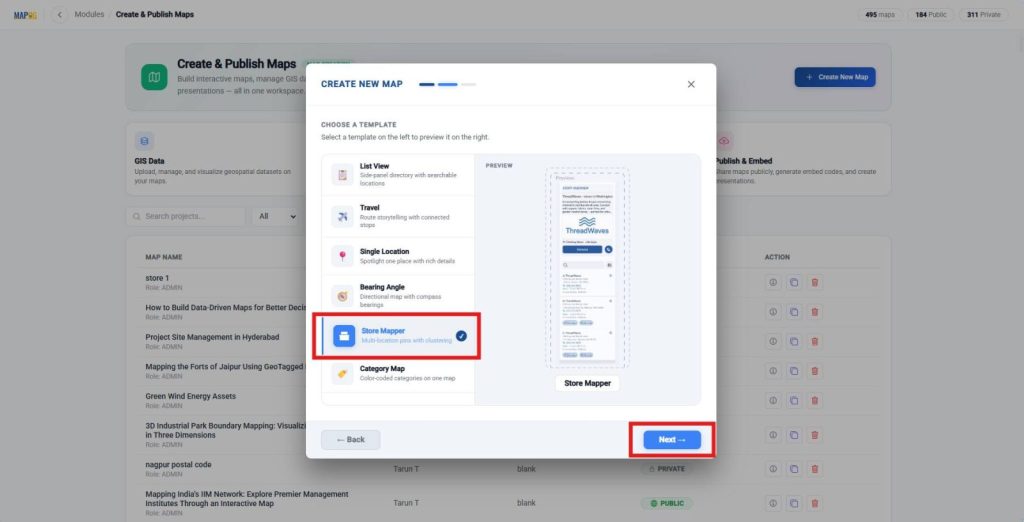
Then, choose the Store Mapper template for multi-location pins with automatic clustering and click Next.
After that, enter a suitable map title and description, click Create Map to open the map interface.
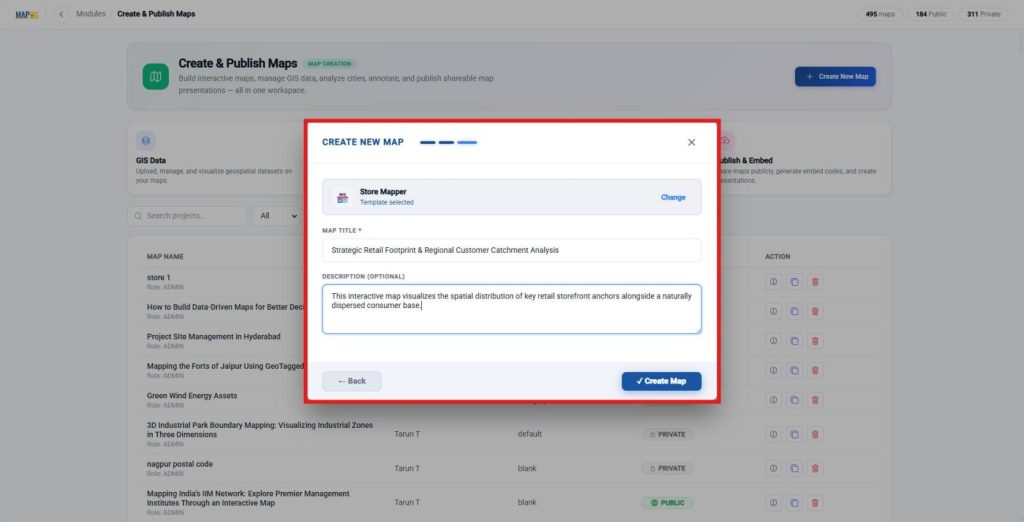
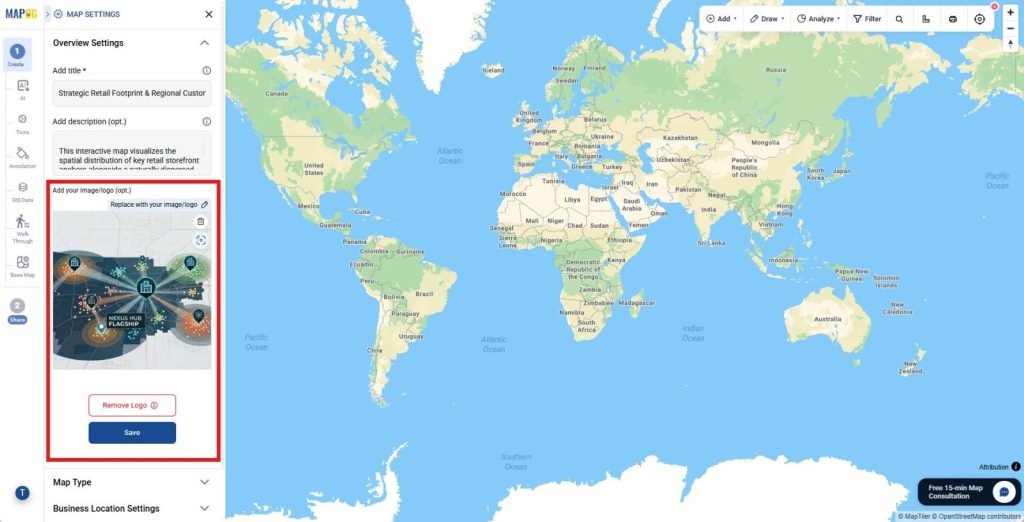
Also, open Map Settings and upload your company logo or cover image.
2. Create New Business Location Template
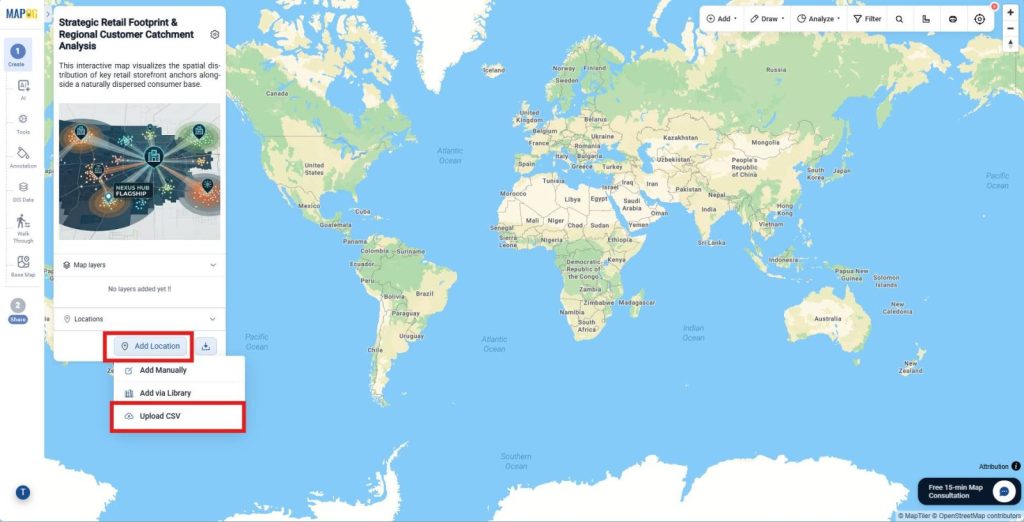
Next, click Add Location and choose Upload CSV.
Open Business Location Settings.
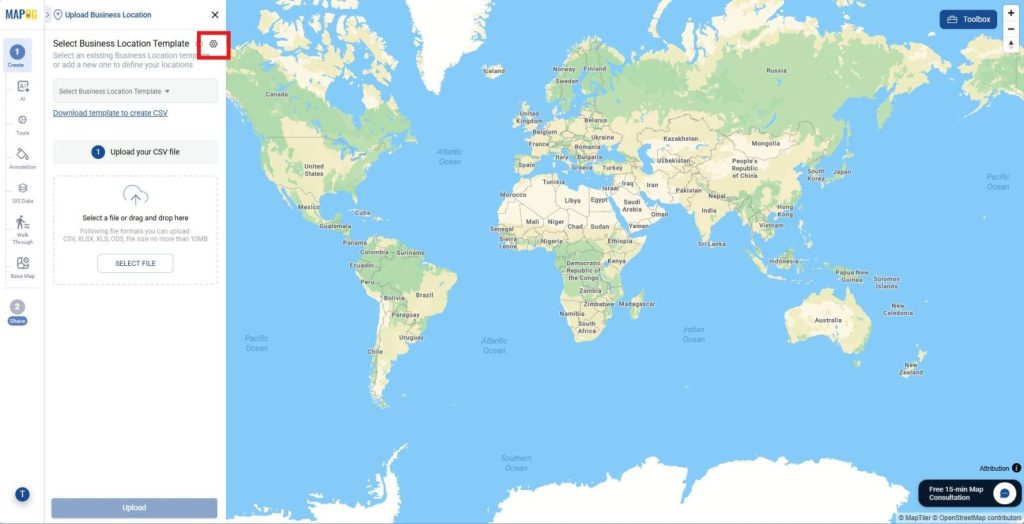
Then, click New Type and enter a business location type name. Afterward, choose a color and select Point as the geometry type.
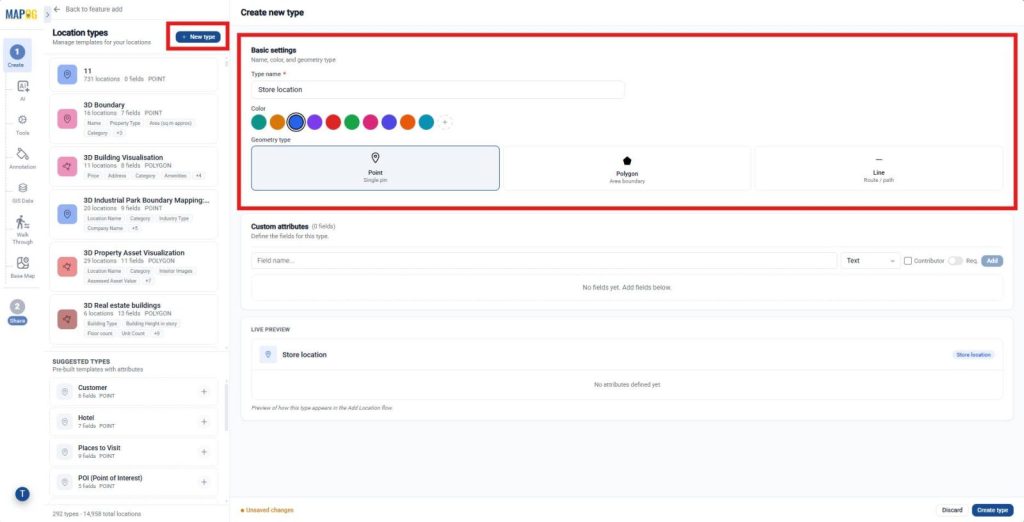
Now, add custom attributes such as Store Name with field type text, Address with field type Address, Website, Images. Additionally, enable contributor editing if multiple users will manage store information. Finally, click Create Type to save the reusable template for future imports.
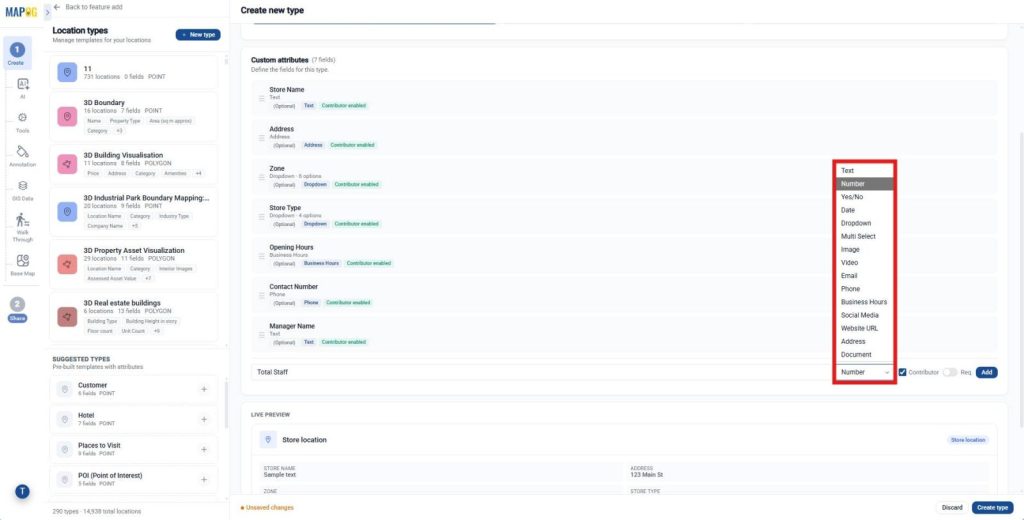
3. Upload and Configure Store Locations
Now, return to Add Location and select the newly created business location type. Then, browse and select your retail store Excel or CSV file and click Upload.
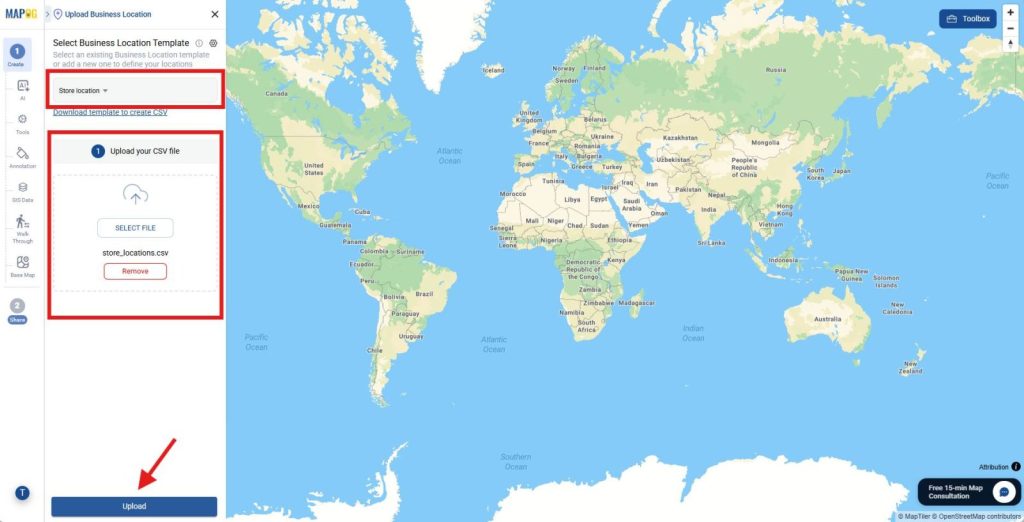
Next, select a Unique ID column or if the spreadsheet lacks a unique ID, allow the platform to generate one automatically.
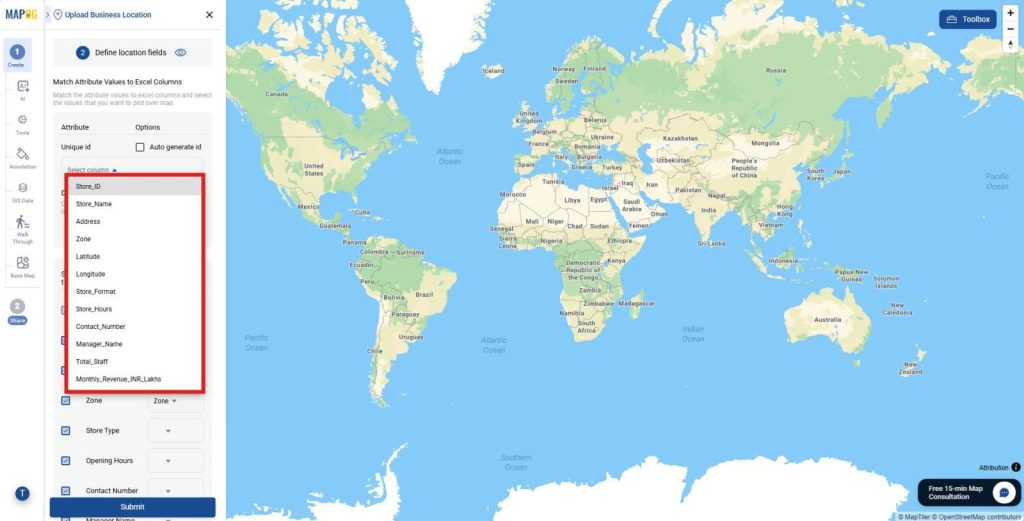
Then, map every spreadsheet column with its corresponding attribute.
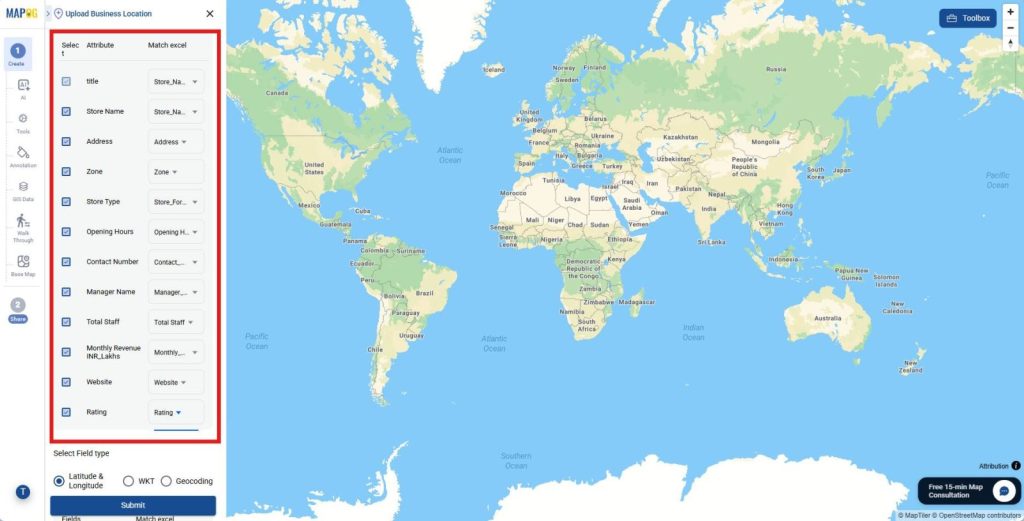
Also, match the latitude and longitude fields correctly for accurate plotting.
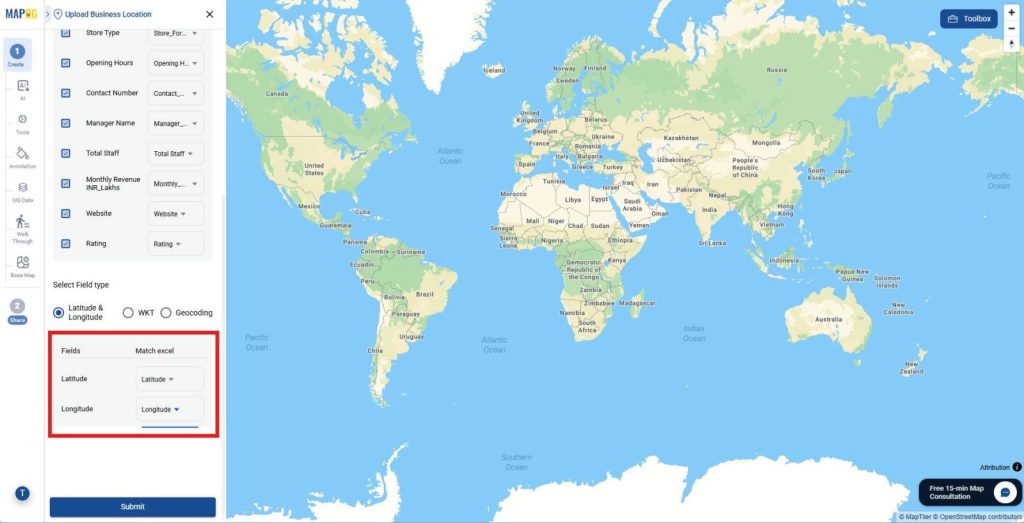
Finally, click Submit to import and plot every store location.
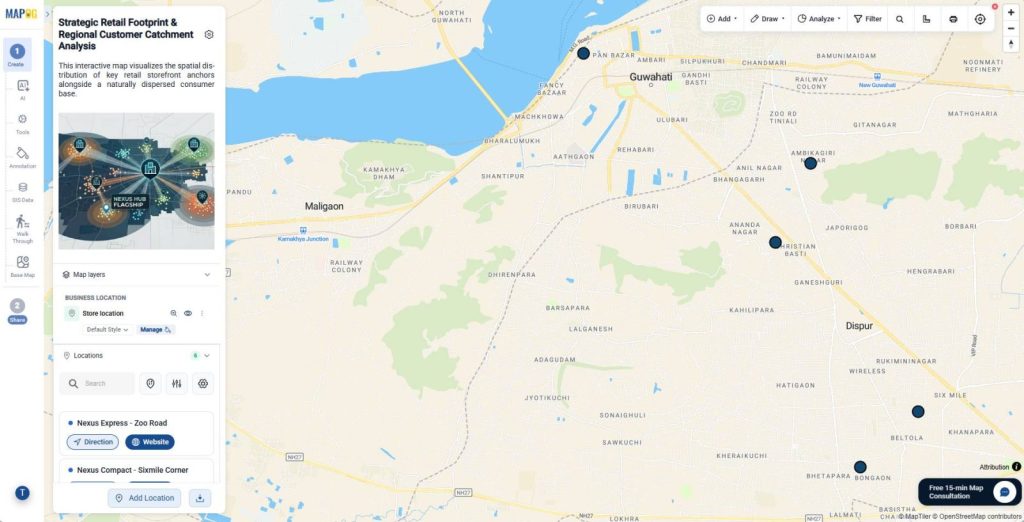
4. Edit Store Details
After the upload completes, click the Pencil icon beside any store location. Then, open the Edit business location details, add store descriptions, upload photos, update contact details, or edit existing information.
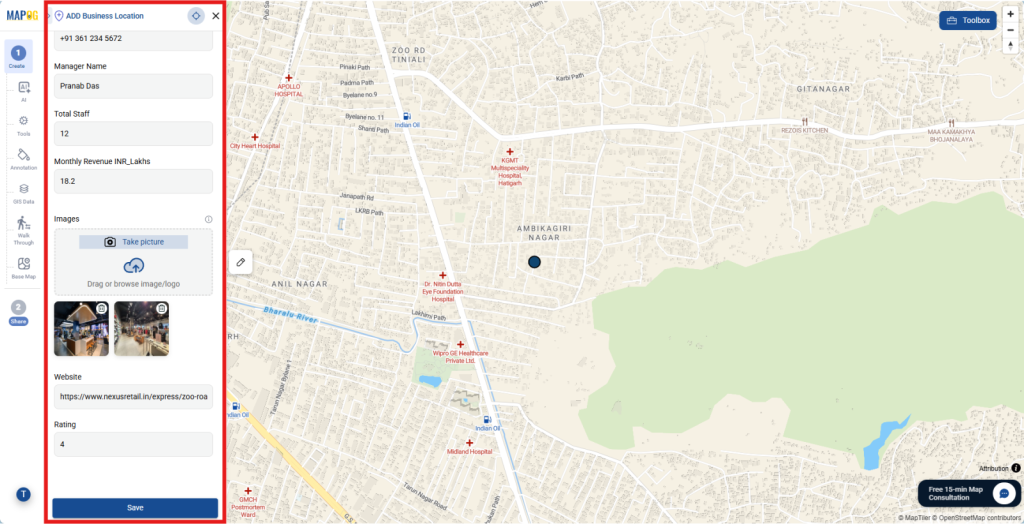
5. Style and Configure Display Properties
Next, click the Three Dots beside the map layer and select Add Layer Style. Then, choose a category field such as Store Type or Sales Zone.
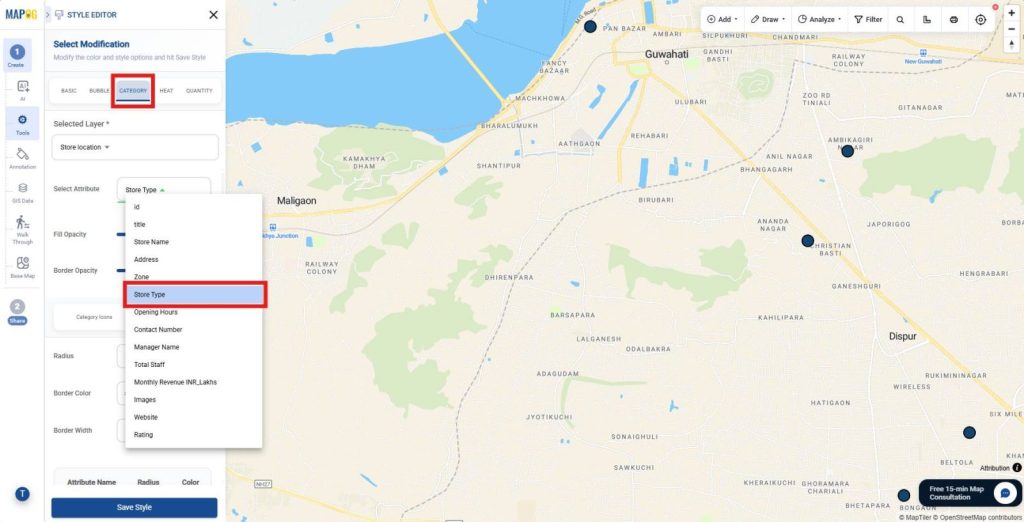
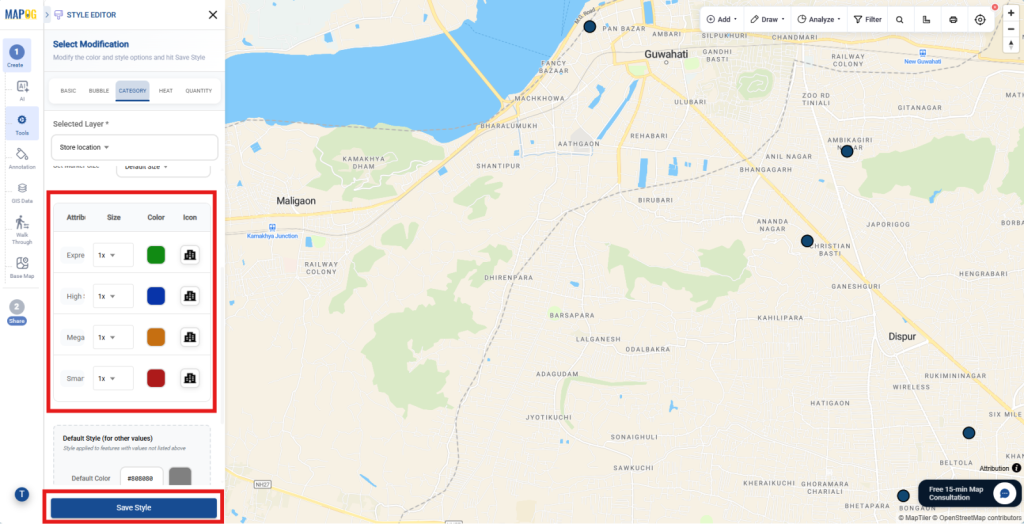
After that, assign different icons and colors to each category and click Save Style. Furthermore, enable the map legend for better interpretation.
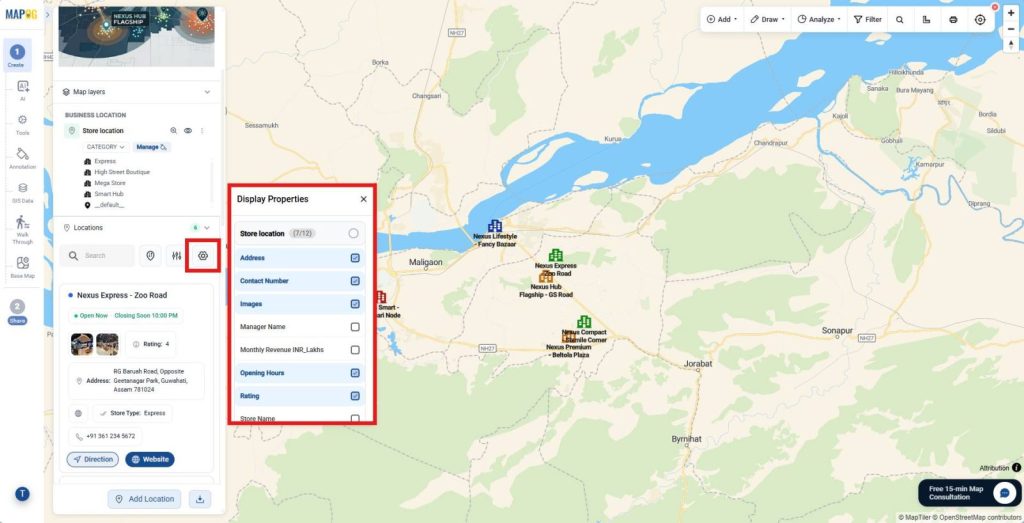
Now, open Display Properties and select the fields to display beside each location. For example, display store addresses, phone numbers, images, and websites. As a result, customers can quickly identify important store information.
6. Import Customer Data
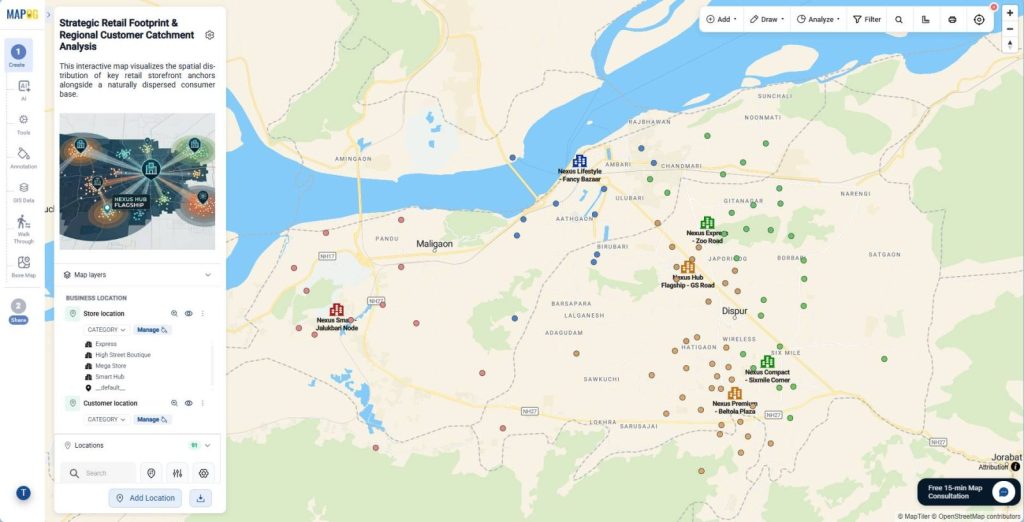
Next, upload the customer catchment CSV or Excel file using the same process. This approach displays both store locations and customer distribution on one interactive map.
7. Add Action Button
Open Map Settings and navigate to the Action Buttons section. Here, add website links and phone numbers to each location.
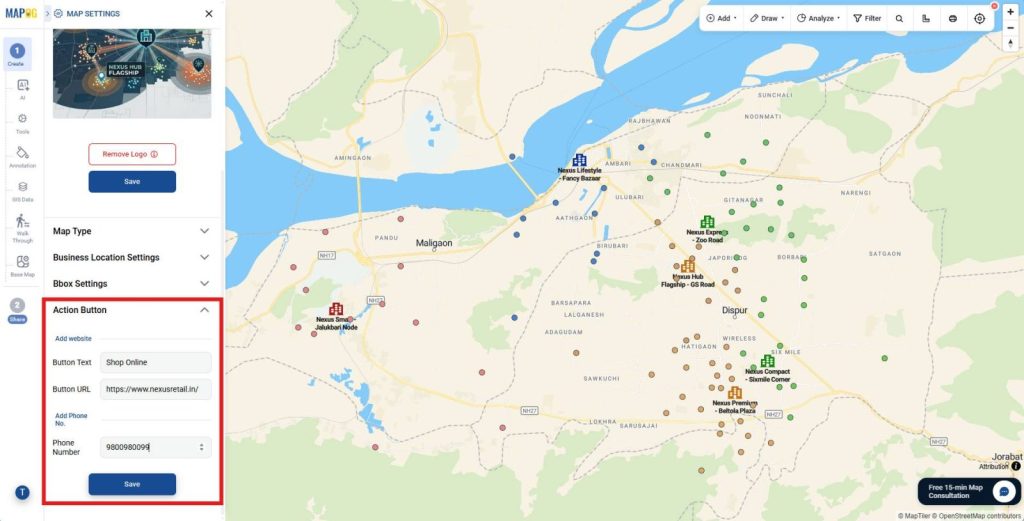
Consequently, customers can contact stores directly and explore locations with greater convenience.
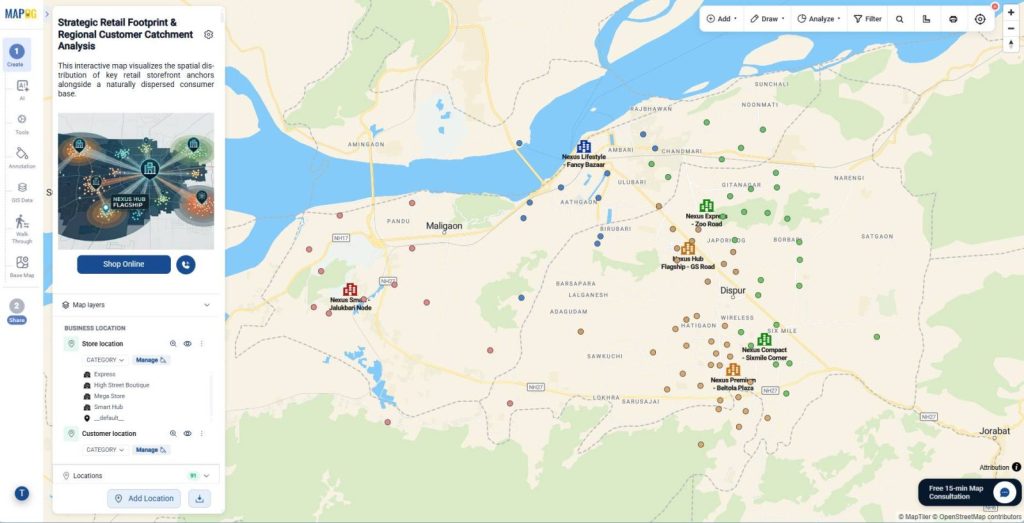
8. Share and Publish Interactive Maps
When the map is ready, open the Share & Publish section. Then, select Private Map to restrict public access.
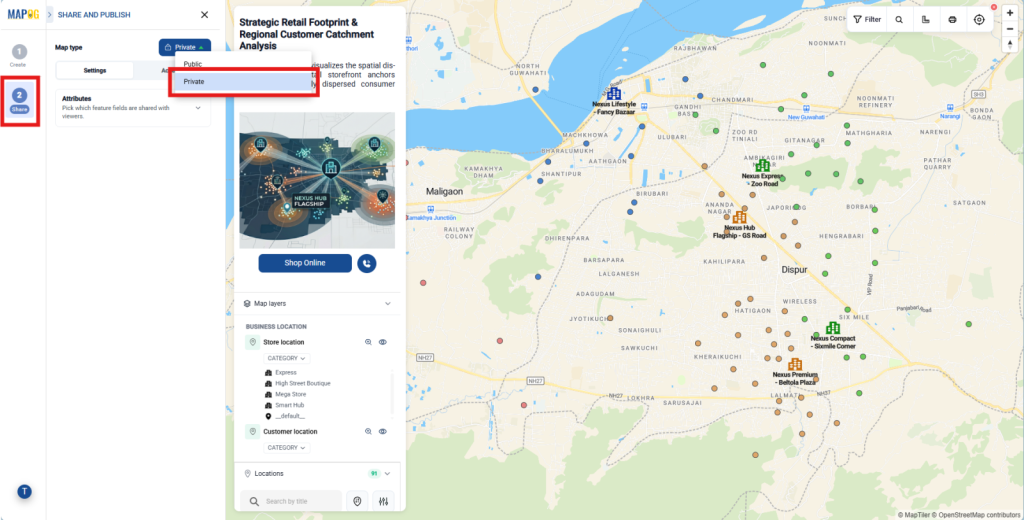
Next, click Add User, and go to add member to add new members.
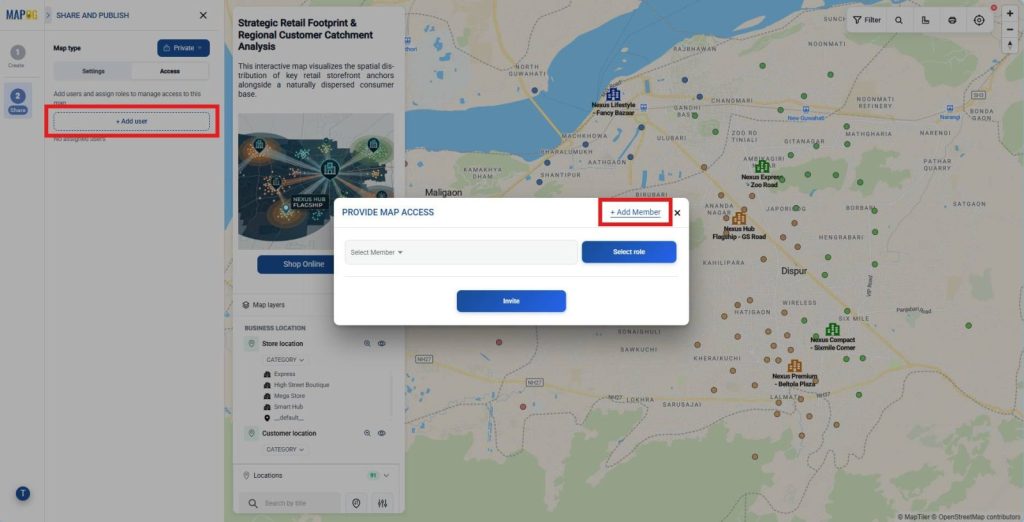
enter the member’s email address. After that, choose Admin for full access or Others to assign Editor, Contributor, or Viewer permissions. Finally, click Send Invite.
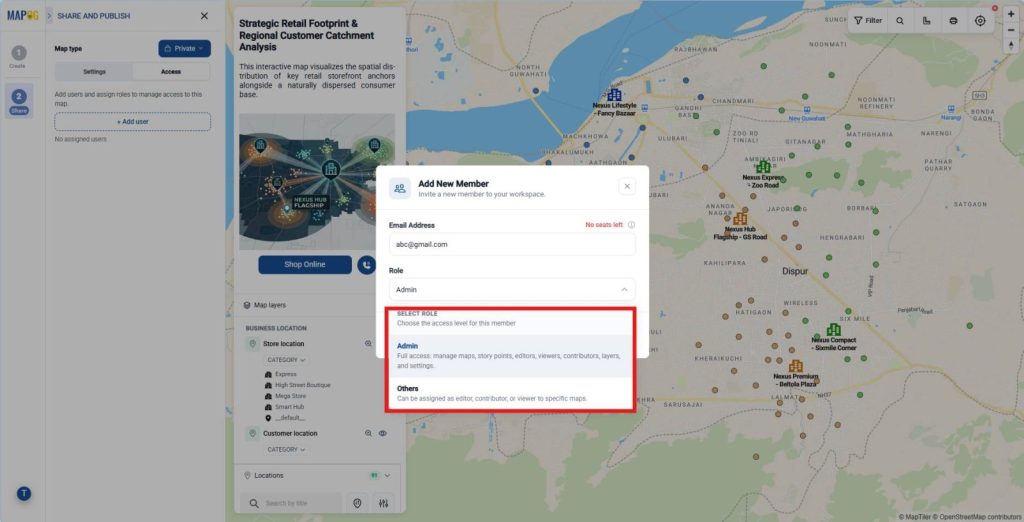
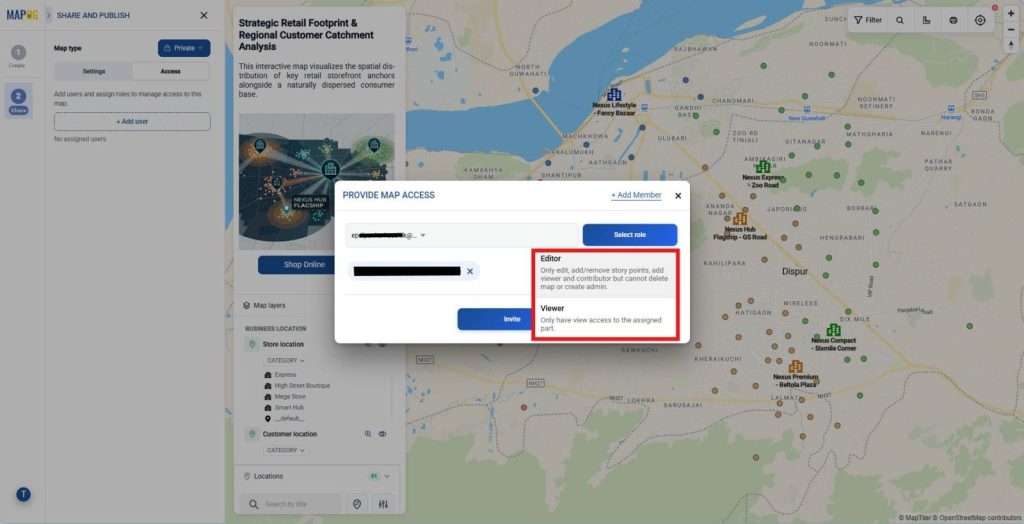
After that, return to the member list, select members from the list and assign the appropriate role, including Editor, or Viewer then click Invite. Therefore, each stakeholder receives suitable permissions while sensitive retail and customer catchment data remains secure.
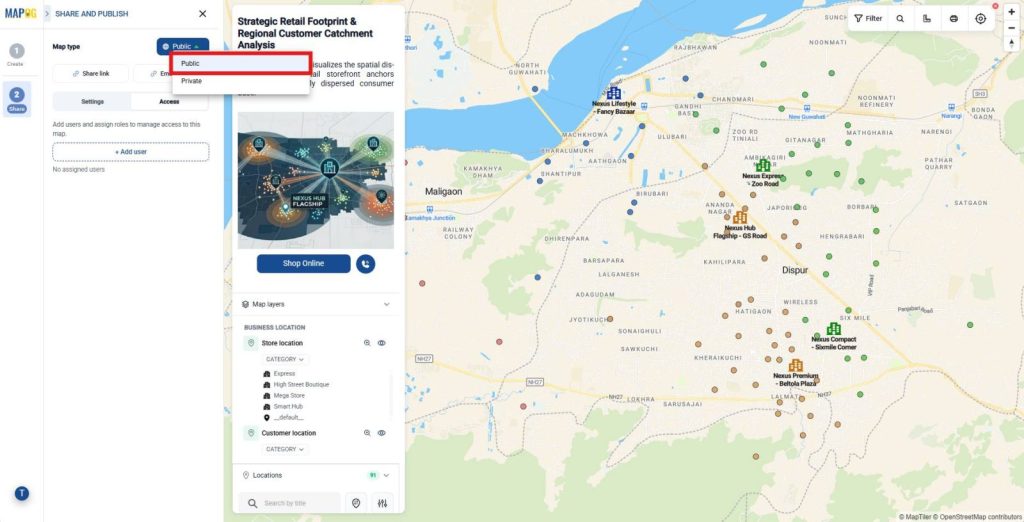
Then, select Public Map to publish the interactive retail map.
Next, click Share Link to generate a public URL for emails, social media, or customer portals.
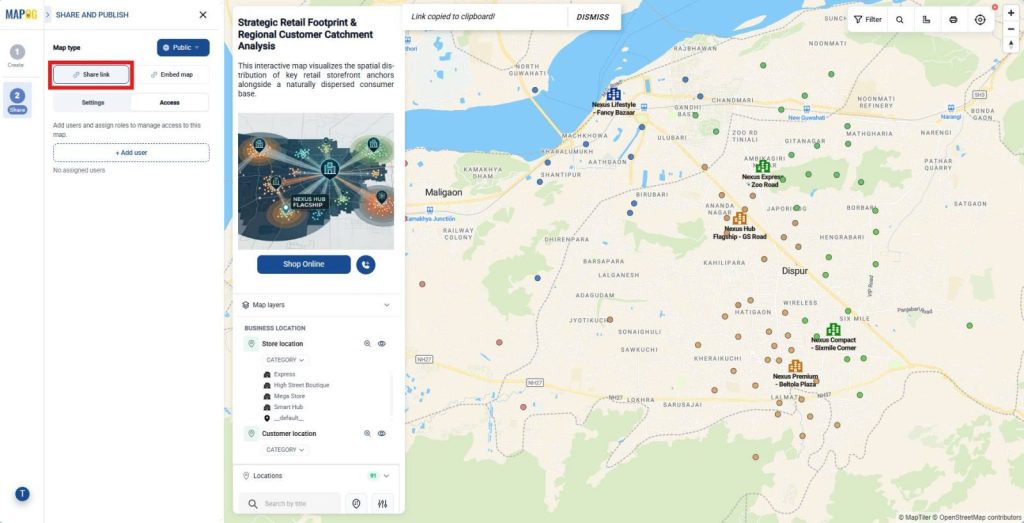
Alternatively, click Embed Map and copy the generated embed code. Then, paste the code into your website or landing page.
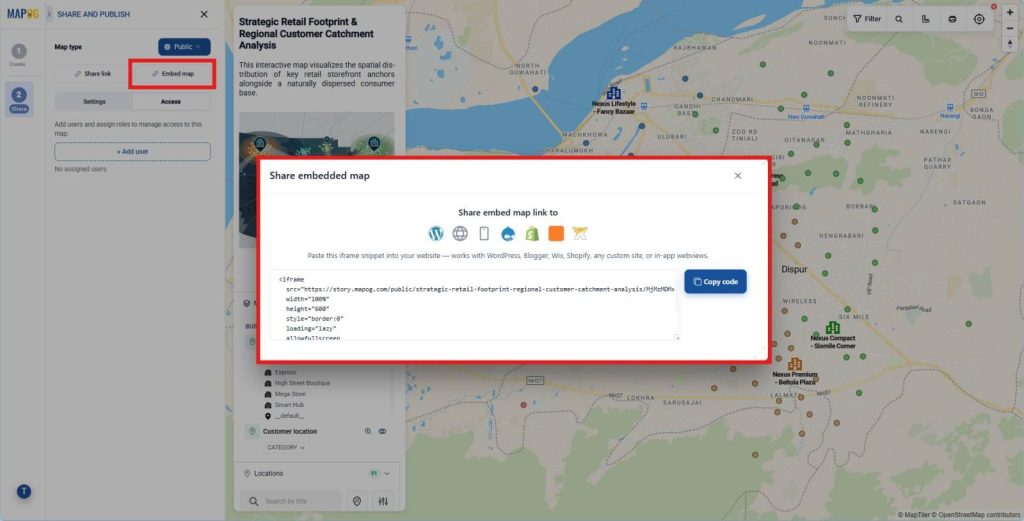
As a result, customers can locate nearby stores, explore catchment areas, and access store details from any device.
Industries and Domains Benefitting from Interactive Maps for Customers
- Retail & Business: Plot outlet locations, sales zones, and customer clusters to optimize regional coverage.
- Real Estate: Showcase property portfolios with location context, images, and custom attributes.
- Tourism & Heritage: Display attractions, visitor routes, and footfall heatmaps visually.
Conclusion
Location data plays a critical role in modern retail strategies, so businesses increasingly Publish Interactive Maps for Customers to improve accessibility, showcase market presence, and strengthen relationships. MAPOG supports this through interactive mapping and CSV or Excel uploads, enabling retailers to publish accurate, engaging maps that enhance customer experience and drive growth.