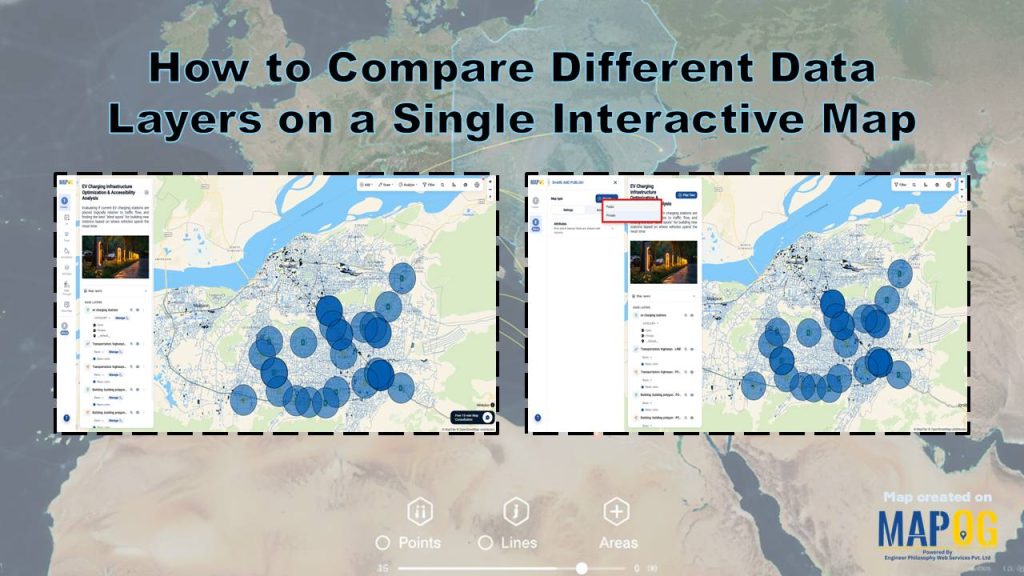
When you bring multiple datasets onto one map, clarity starts to replace confusion. Tools like MAPOG make it seamless to Compare Different Data Layers on a Single Interactive Map, turning scattered information into a unified visual story. Instead of switching between sources, users interact with everything in one place. As a result, patterns surface faster, overlaps become visible, and insights feel almost immediate. This approach simplifies complexity and supports smarter, faster decisions.
Key Concept of Compare Different Data Layers on a Single Interactive Map
Compare Different Data Layers on a Single Interactive Map means viewing multiple datasets together within one map interface. Each dataset appears as a separate layer, such as points, lines, or areas. Users can switch layers on or off, adjust their style, and change their order. Therefore, they can quickly observe relationships, differences, and spatial patterns across datasets in the same location.
Steps- by- Step Workflow to Compare Different Data Layers on a Single Interactive Map
1. Create Your Map
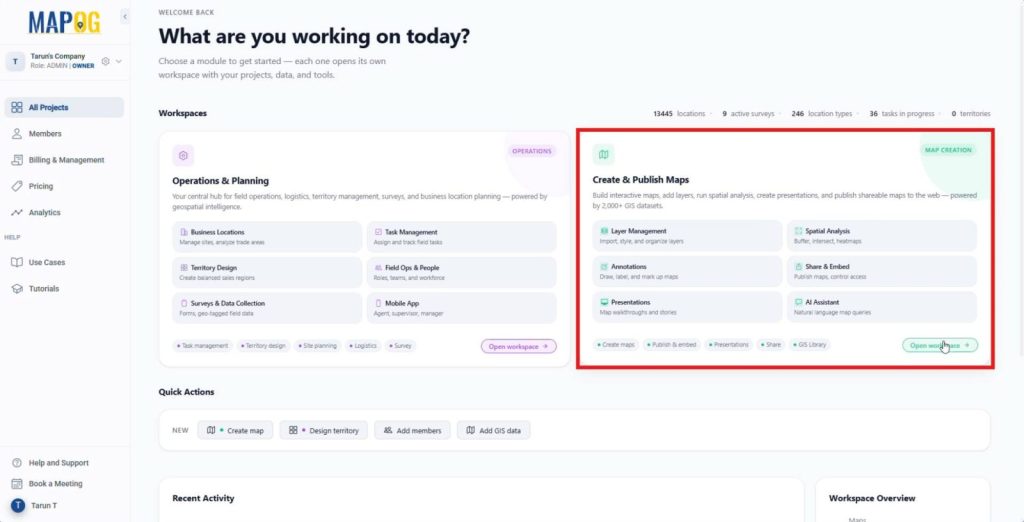
Open MAPOG and navigate to the Create & Publish Maps workspace,
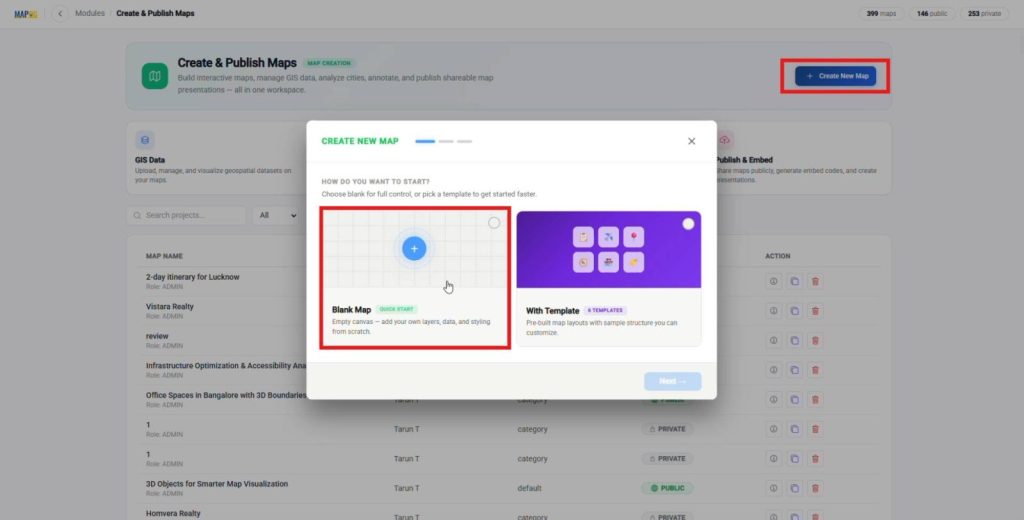
Next, click create new map, then select a blank map, a blank map works as an empty canvas, which lets you add your own layers, data, and styling from scratch without any preset elements.
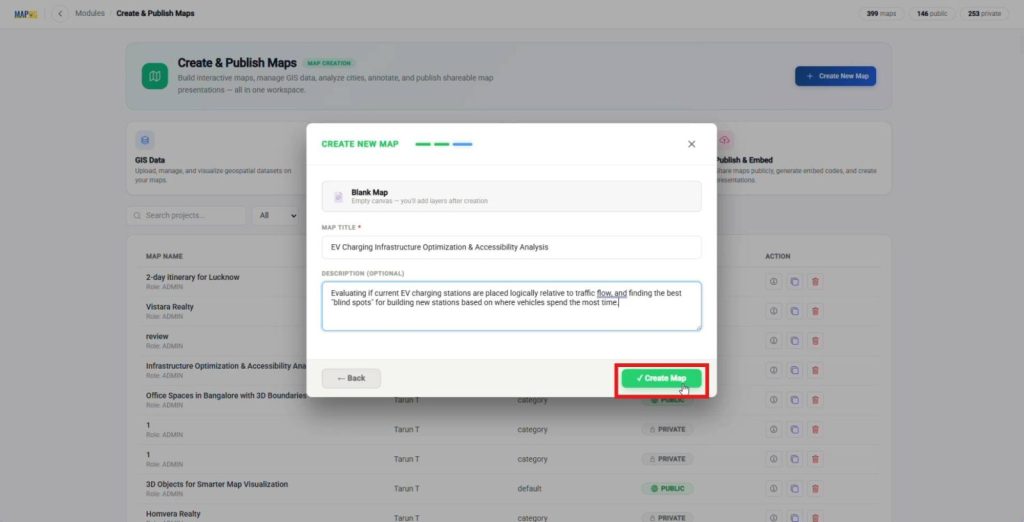
Add a clear title and description so your map starts with a defined purpose and direction. Click Create Map to enter the interface and begin your workflow.
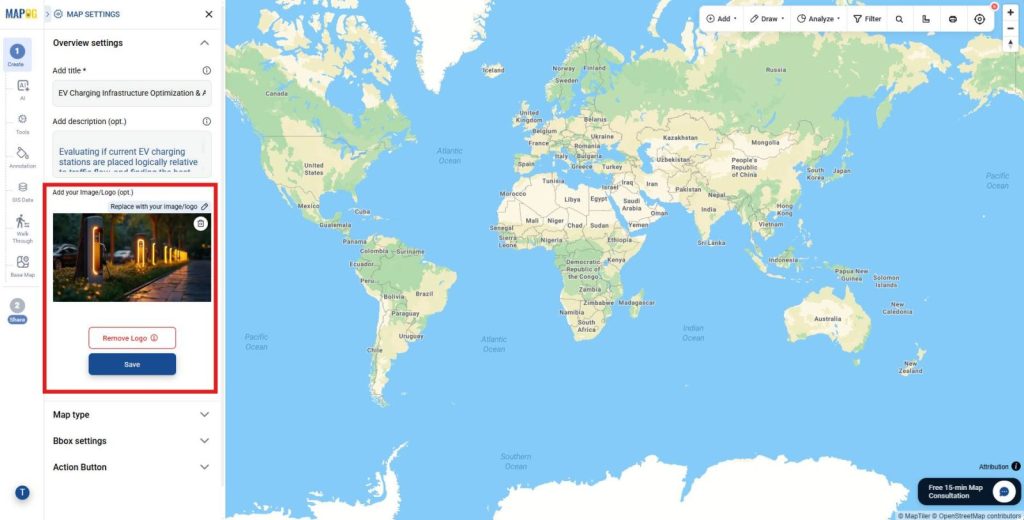
Open Map Settings and upload a map logo to add clear branding and a professional look.
2. Add Key Data Layers
Next, go to the GIS Data tool.
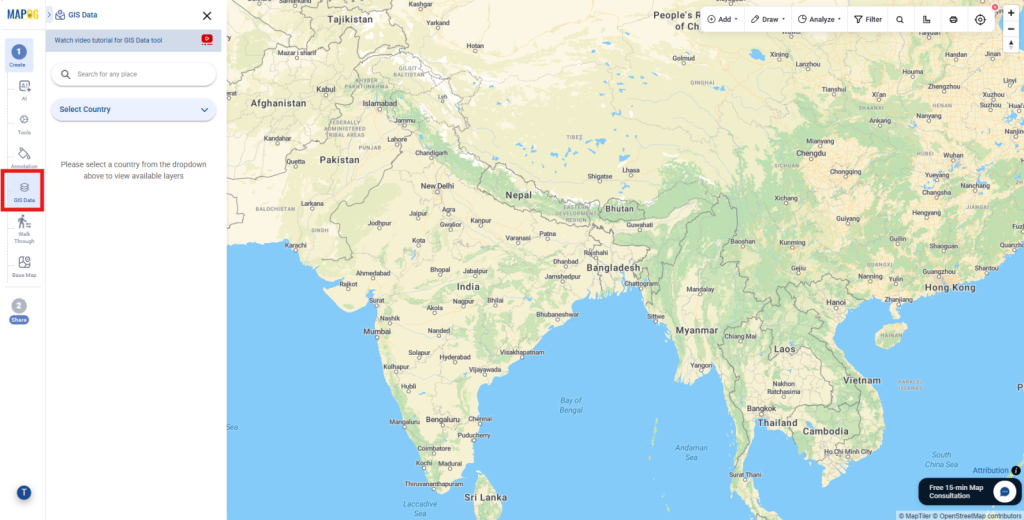
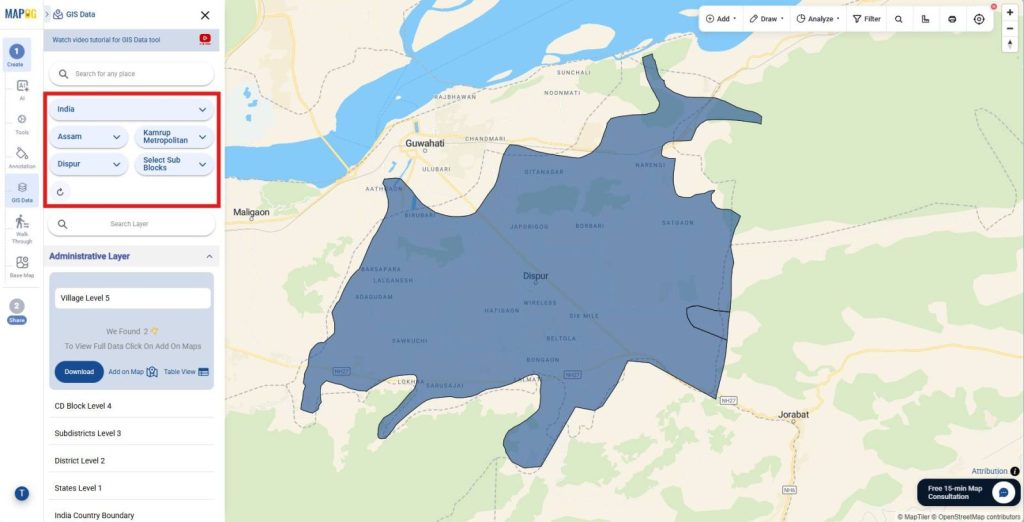
select your country, then refine it to your specific region so your analysis stays relevant and focused.
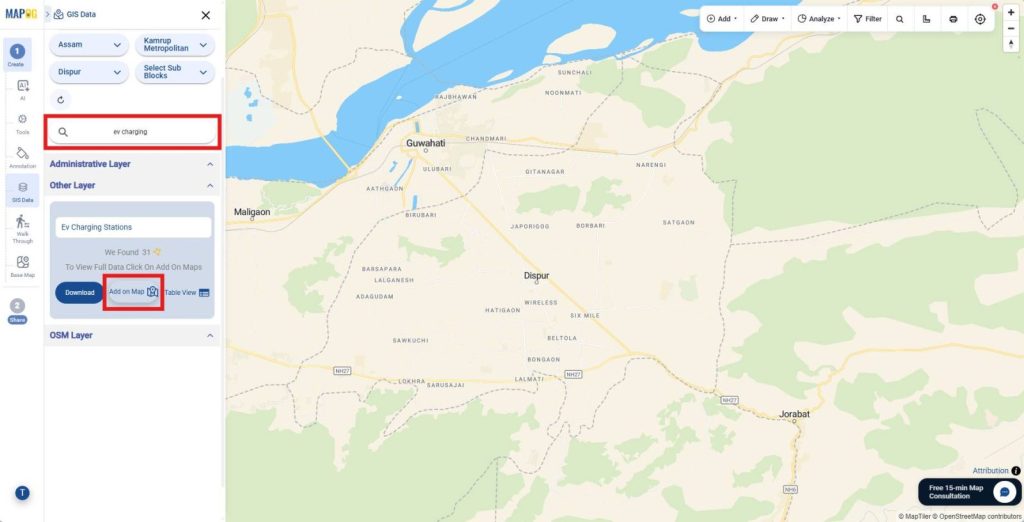
After that, search for EV charging stations and add them to the map,
then add highways and buildings in the same way so multiple datasets come together in one view and reveal spatial relationships.
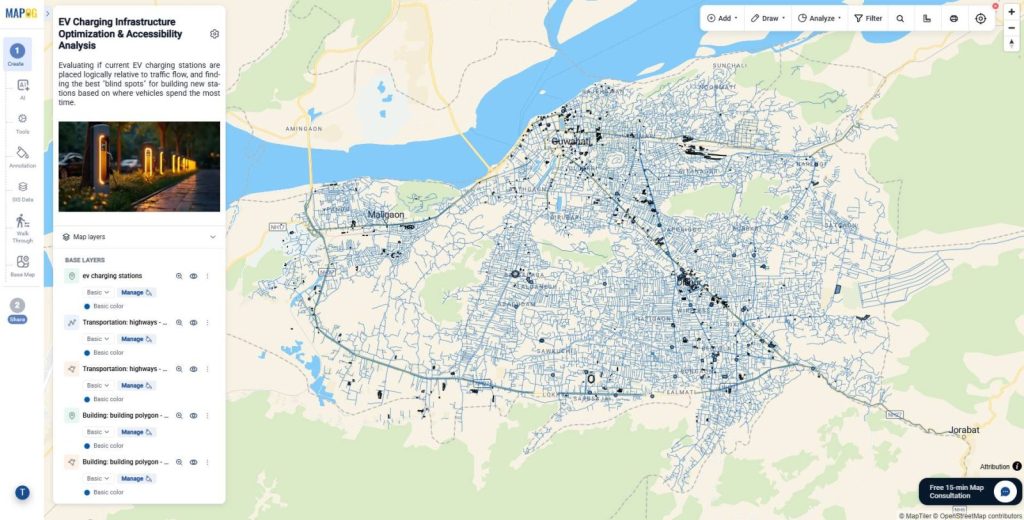
3. Style for Clarity
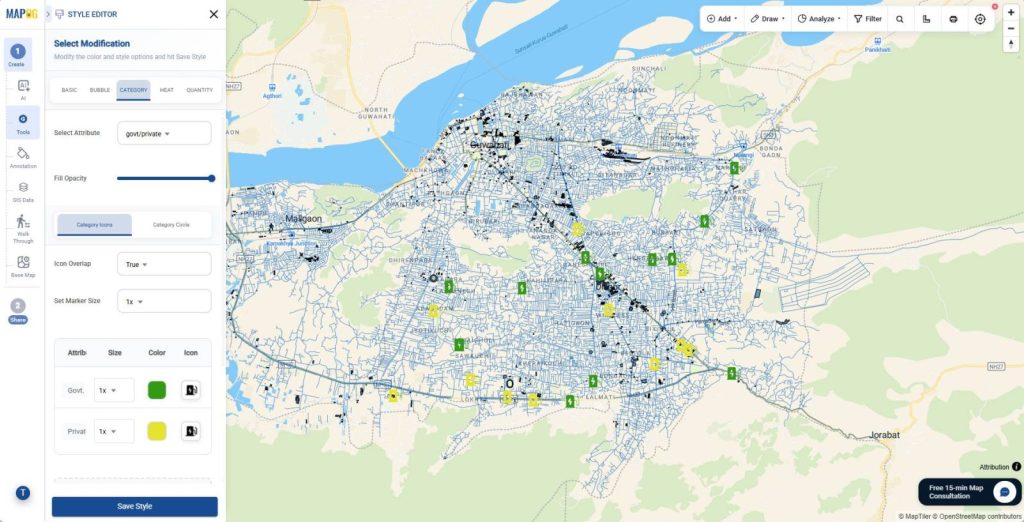
Then, go to Add Layer style and go to the Category section, where you categorize EV charging stations based on selected attributes, choose distinct colors, and add icons so each layer stands out clearly and improves interpretation. Save the style to apply changes.
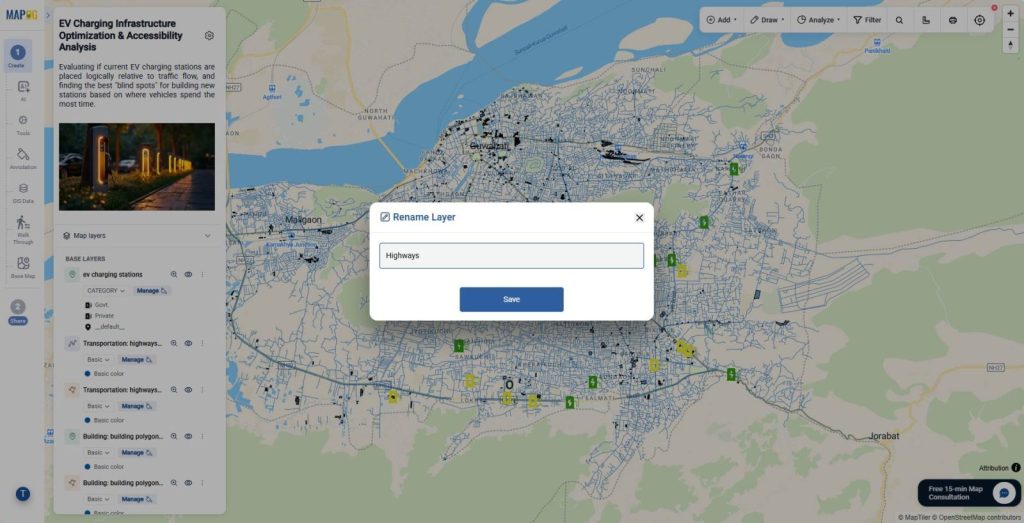
In addition, go to Map Layers, click the three dots, and rename each layer with clear labels so your map stays organized and easy to understand as complexity increases.
4. Analyze with Buffer
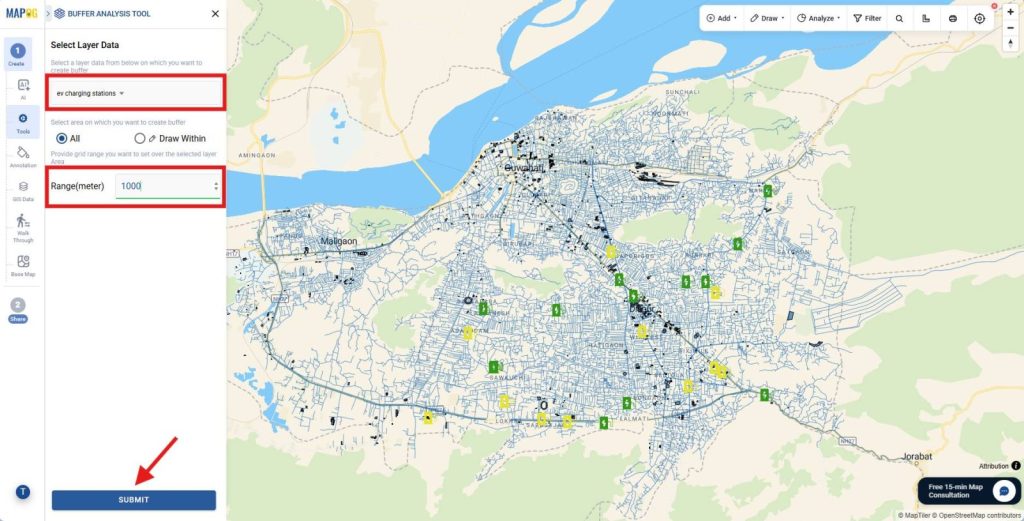
Once your layers are ready, open Tools and search and navigate to select the Buffer tool,
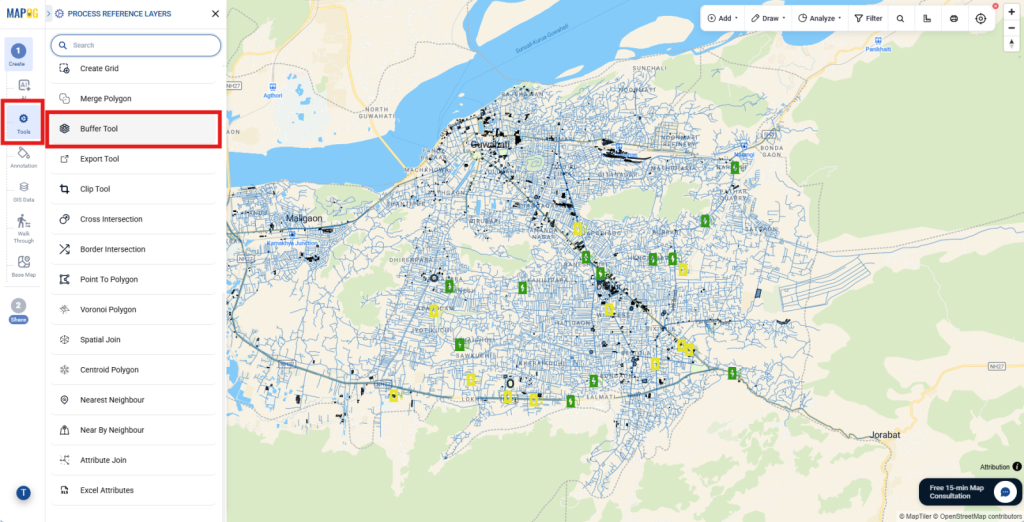
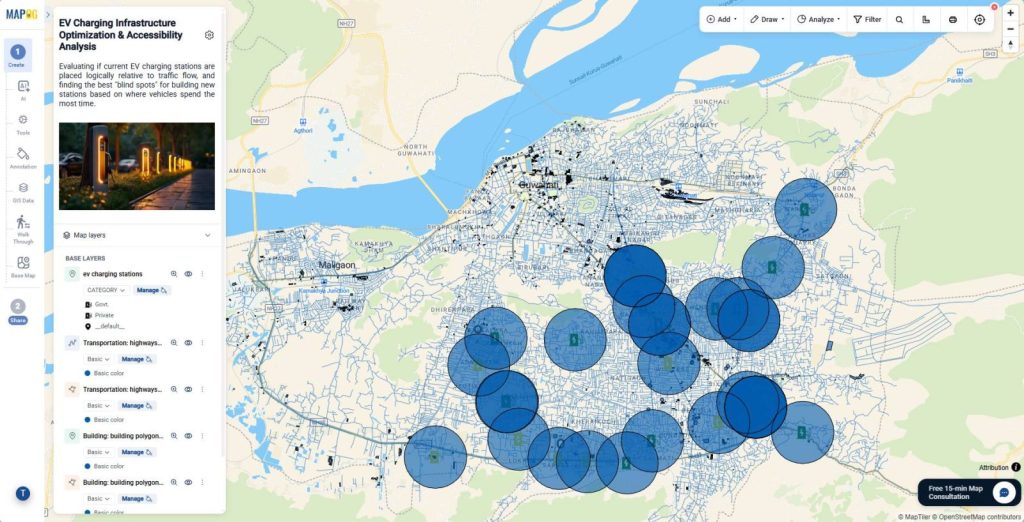
choose the EV charging station layer, and apply a range in meters to create a 1 km buffer zone so you can clearly see coverage and accessibility.
5. Share and Collaboration
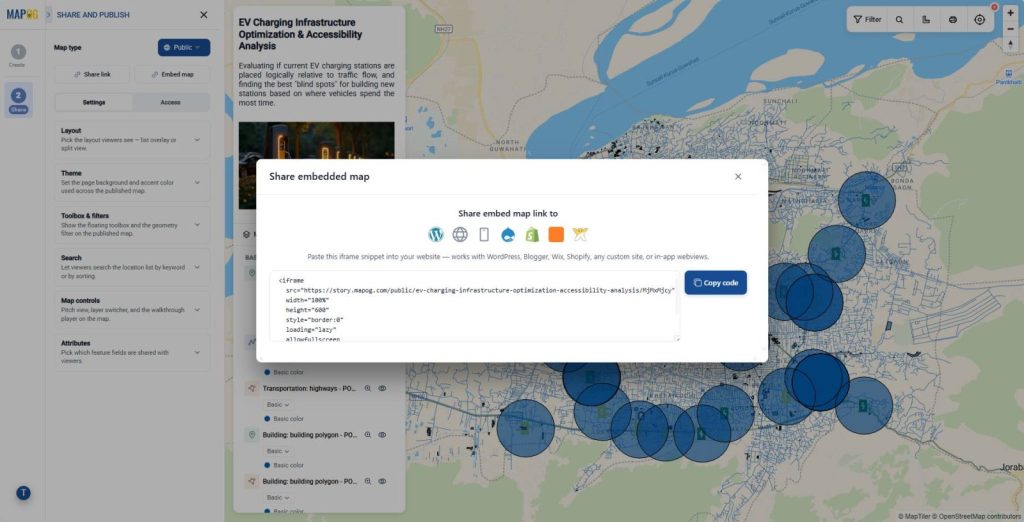
Finally, move to the Preview & Share section, set your map as public or private, enable geometry filters and sorting options, and share it through links or embed it to any website so your insights become interactive and accessible.
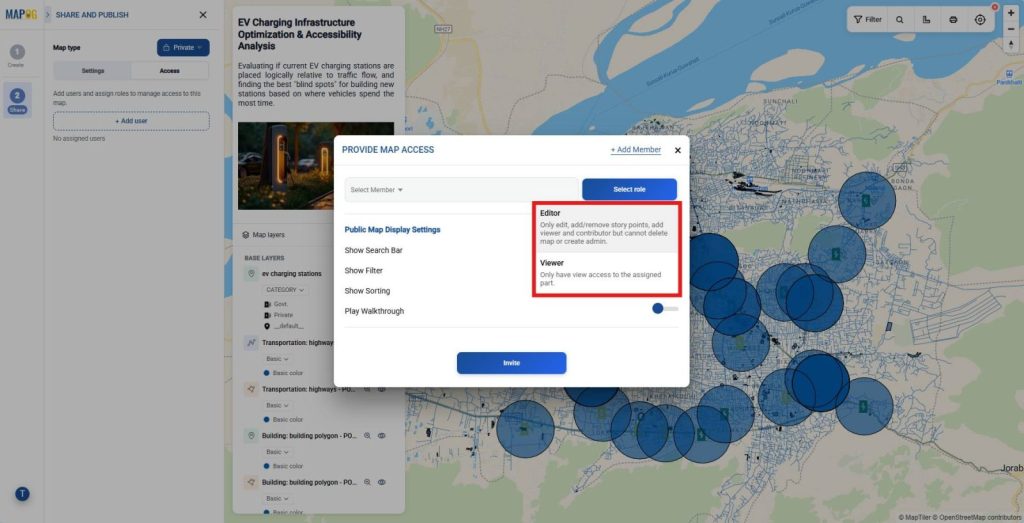
For private maps, add users and assign roles so teams can collaborate efficiently and manage the map smoothly for both analysis and presentation.
Industries and Domains Benefitting
Many sectors gain value when they Compare Different Data Layers on a Single Interactive Map. In urban planning, officials align infrastructure with population density. Meanwhile, transportation teams optimize routes using traffic and road layers. In energy, companies plan infrastructure networks efficiently. Even disaster management teams use layered maps to track risk zones and response routes.
Conclusion
In short, layered mapping transforms raw data into actionable insight. MAPOG makes it easy to visualize, compare, and act on complex datasets. When you Compare Different Data Layers on a Single Interactive Map, you move from guesswork to precision, which drives smarter and faster decisions.