#InteractiveMaps

GIS Heatmaps to Analyse Lacation-Based Data

Using GIS Heat Map to Analyze Location-Based Data

Teams across utilities, logistics, retail, infrastructure, and field operations collect large amounts of location-based data every day. Using GIS Heat Map is an effective way to visualize and analyze geographic patterns. For example, this data can include survey submissions, customer visits, complaint locations, service requests, and operational records. However, analyzing it through coordinates or large … Read more

Location-based map showing team activity tracking and project progress monitoring in real time

Track Team Activities and Project Progress Using Location-Based Maps

In the infrastructure audit industry, track team activities managing field teams and  monitoring   project progress becomes difficult when inspection updates are scattered across calls, spreadsheets, WhatsApp chats, and manual reports. As audit projects expand across multiple sites and locations, organizations often face delays, limited visibility into field activities, and poor coordination between teams. Therefore, … Read more

Spreadsheet Data into Interactive Maps

Transform Spreadsheet Data into Interactive Maps in Minutes

In the real estate industry, managing property listings, project locations, and franchise networks through spreadsheets alone can make it difficult to understand market coverage and location patterns. Businesses often deal with scattered property data, making it challenging to compare sites, track developments, and share location insights with teams and customers. With MAPOG, you can transform … Read more

How to Draw Lines, Polygons, and Shapes on a Map Without GIS Software

How to Draw Lines, Polygons, and Shapes on a Map Without GIS Software

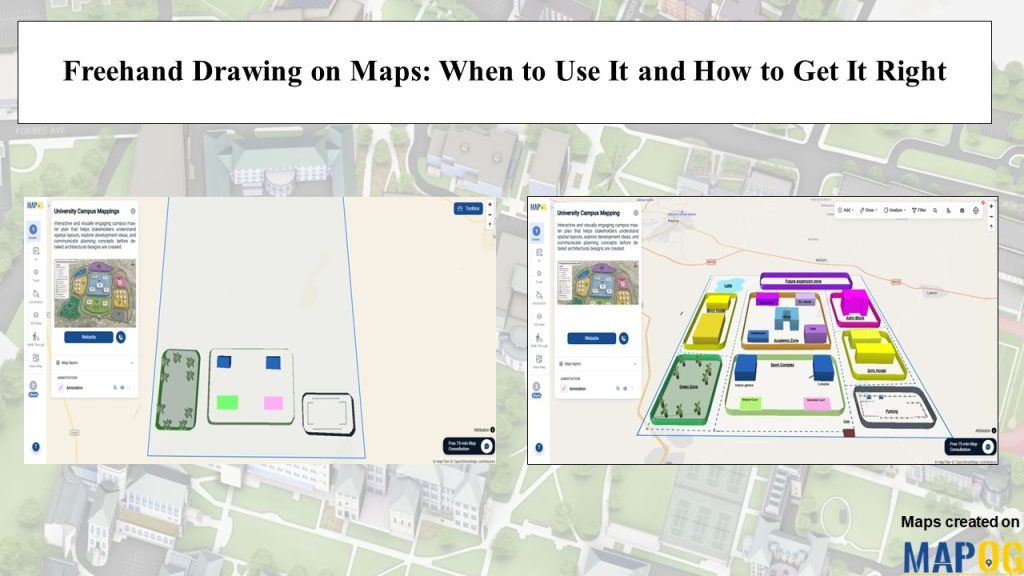
Construction projects often rely on static plans that are difficult to update and share. As a result, teams may struggle to communicate site layouts effectively. However, to Draw Lines, Polygons, and Shapes on a Map makes site planning more interactive and efficient. Instead of using disconnected documents, teams can mark work zones, utilities, and project … Read more

Share Interactive Maps with Visitors

How to Share Interactive Maps with Visitors for Better Location Engagement

Share Interactive Maps with Visitors securely is a common challenge in today’s collaborative and data-driven environment, where sharing location intelligence is just as important as creating it. Static screenshots or exported files often fall short—they lose context, interactivity, and control. That’s where secure Interactive map sharing becomes essential. By enabling teams and clients to explore … Read more

3D Models on Maps

Adding Labels, Popups, and Information Layers with 3D Models on Maps

In real estate, property data is often scattered across multiple platforms, making it hard to compare options and gain clear insights. This lack of visibility slows decision-making. Today, clear and precise data visualization is essential for smarter property decisions. With MAPOG, developers can layer filters onto a property map and enhance listings using Information Layers … Read more

How to Create 3D Building Footprints on a Map (No CAD or GIS Required)

How to Create 3D Building Footprints on a Map (No CAD or GIS Required)

Managing building data and visualizing urban structures often requires specialized GIS or CAD software. MAPOG simplifies this process by allowing users to create and visualize 3D building footprints directly on an interactive map without any advanced technical skills. This helps planners, real estate professionals, educators, and businesses better understand building layouts, heights, and urban landscapes. … Read more

Custom Information Template

How to Add Custom Information Template to Map Locations

Managing location-based data is still a challenge for industries like healthcare, logistics, emergency response, and retail. Organizations often scatter data across spreadsheets, outdated records, and disconnected systems. As a result, teams struggle to update location details quickly or visualize important resources on a live map. However, MAPOG with custom information template is helping organizations create … Read more

Track survey submissions

How to Track Survey Submissions and Manage Field Work Using Map-Based Dashboards

Managing field surveys across multiple locations can be challenging. However, MAPOG simplifies the process with a map-based dashboard that helps organizations launch campaigns, assign field tasks, collect responses, and monitor survey submissions in real time. Additionally, managers can track contributor activity, review survey submissions, and monitor survey submission progress directly from an interactive map. Furthermore, … Read more

spatial surveys using mobile applications

How to Manage End-to-End Spatial Surveys using Mobile Applications and Web Dashboards

Conducting field or spatial surveys using mobile applications, such as accessibility and restaurant quality audits, face many challenges due to reliance on paper records, disconnected field notes, and delayed updates, leading to errors in compliance mapping and facility management. The MAPOG Survey and MAPOG Contributor mobile application address these issues by enabling real-time data collection … Read more