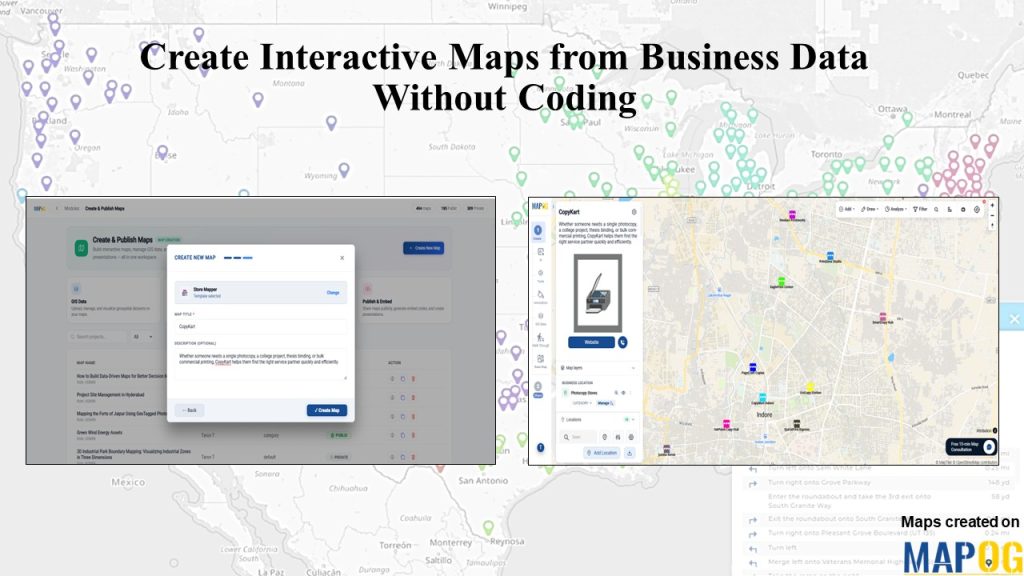
Need urgent photocopies, thesis binding, document scanning, or printing services, but not sure which service provider nearby offers exactly what you need? For businesses that manage multiple partner locations, helping customers discover the right service provider can be challenging. Information is often scattered across spreadsheets, websites, and customer support channels, making it difficult for users to quickly find relevant services. Using MAPOG, organizations can transform simple business location spreadsheets into interactive map service discovery platforms without writing a single line of code. In this tutorial, we’ll create a business data map without coding using the MAPOG platform.
Why Interactive Business Data Maps Matter
Business data is often stored in spreadsheets that include details such as business names, addresses, contact information, operating hours, services offered, customer ratings, and facility information. While spreadsheets are useful for storing data, they do not offer an engaging way for customers to explore locations. Interactive map, help businesses visualize multiple locations geographically, improve customer discovery, showcase services and facilities, provide real-time business information, centralize location management, and support location-based decision-making. Instead of searching through rows of data, users can simply interact with a map to find exactly what they need.
Step-by-Step Guide to Create Interactive Maps from Business Data
Step 1: Add Documents to a New Map Setup
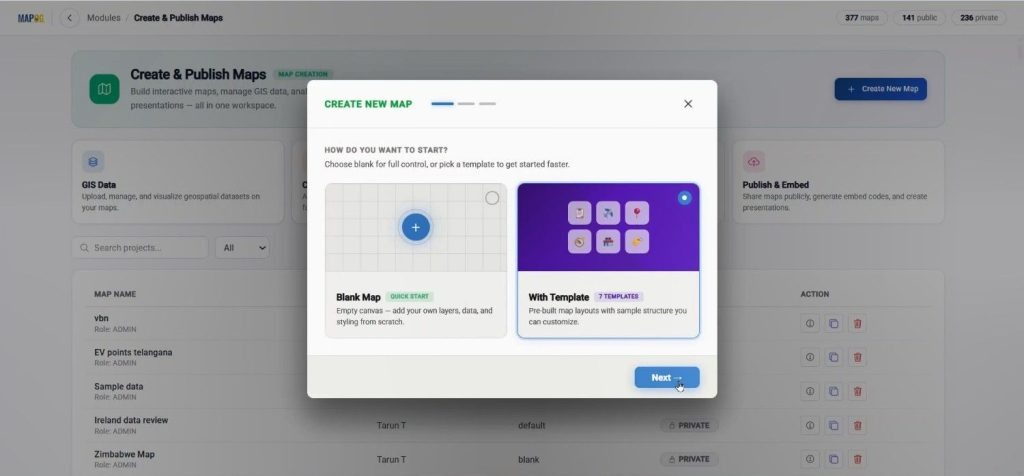
To begin, open MAPOG and go to the Create & Publish section. Then click Create New Map & choose with template option.
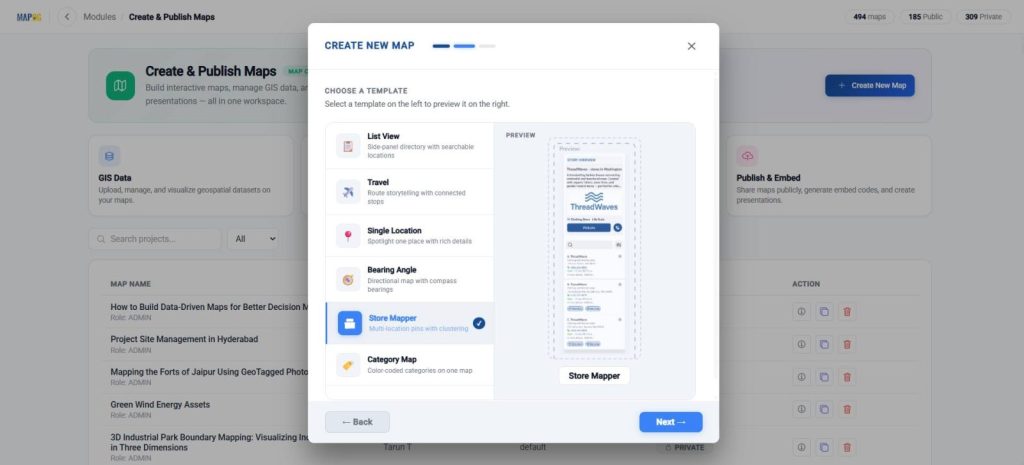
Then, select the Store Mapper Template.
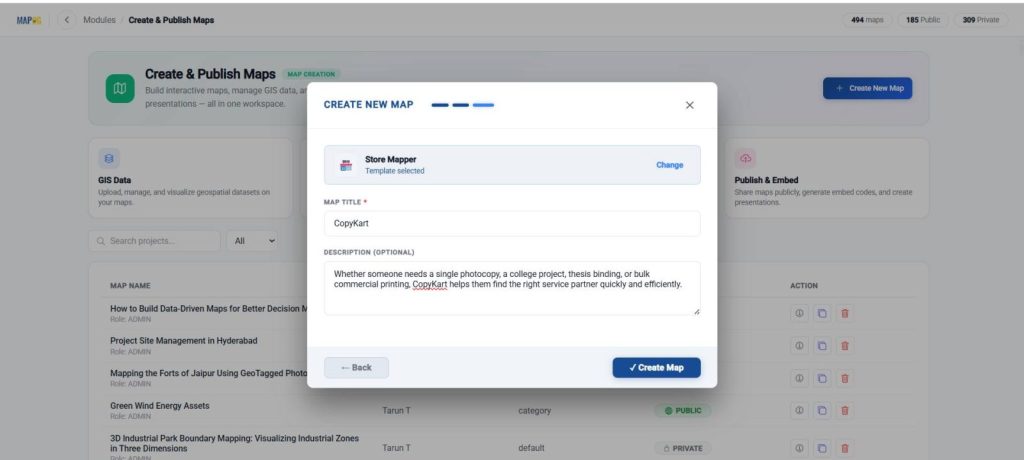
Afterwards, enter a project title and description, then click Create Map.
Step 2: Configure Map Settings
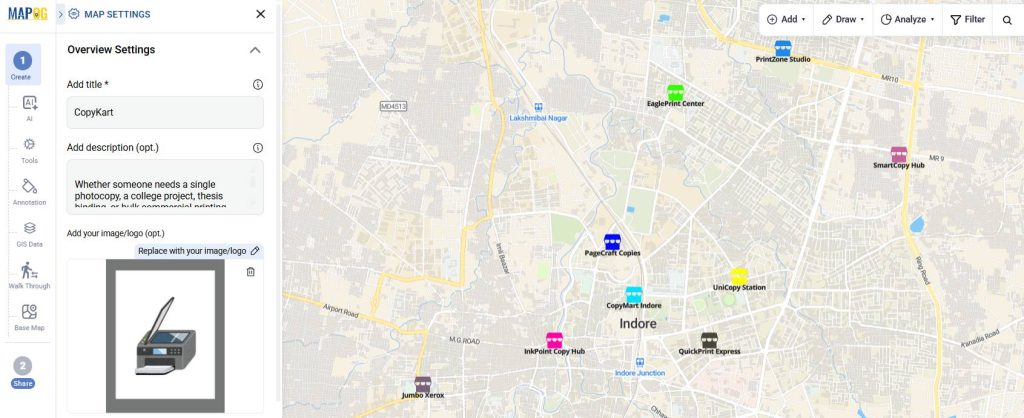
Customize your map by uploading an image through the Upload Image section in map settings.
Step 3: Create a Business Location Template
Then, navigate to Add location, Click on Upload CSV.
To upload location data effectively, create a Business Location Template. Then, go to the select business location template settings option.
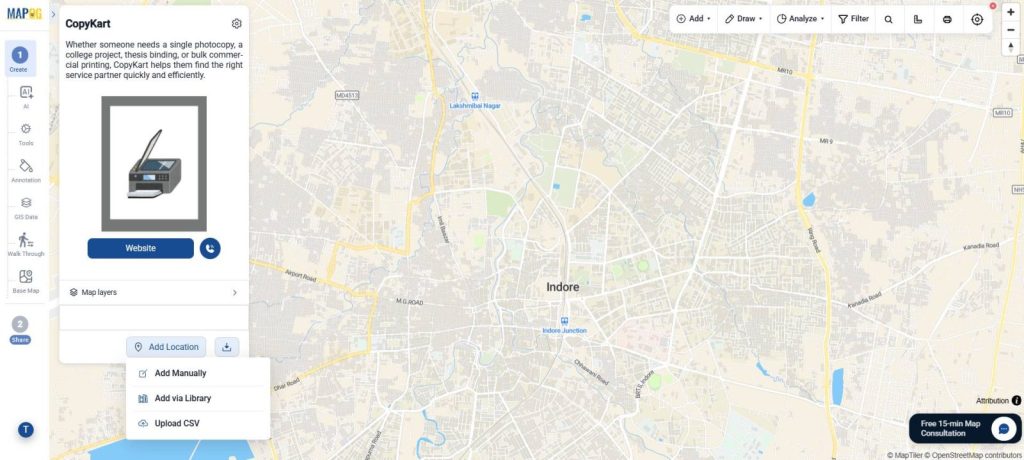
Click the new type to begin.
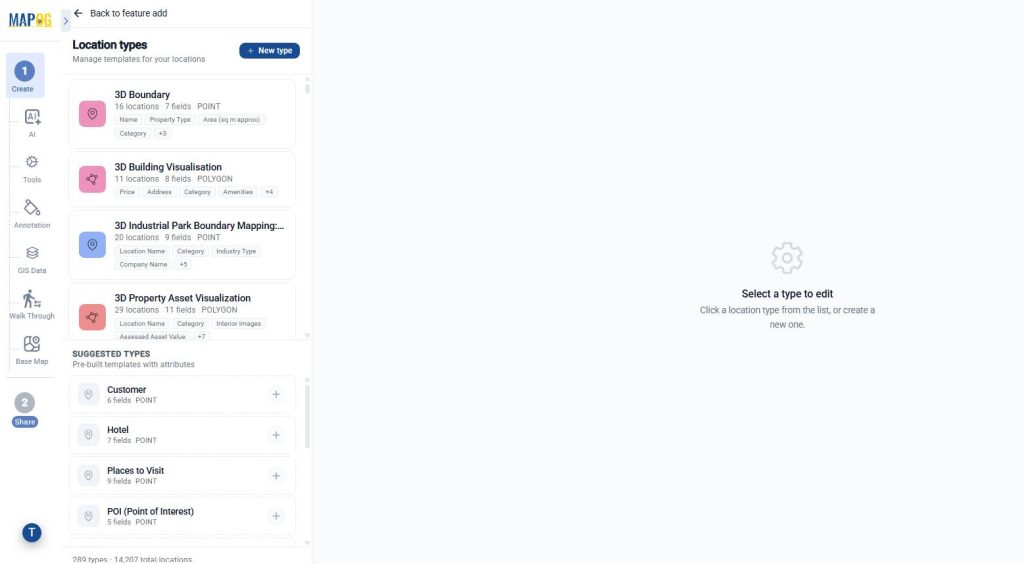
Inside the template setup, add the title, choose a color, and set geometry as Point. Points are ideal for marking hospitals, offices, facilities, stores, buildings, and other specific locations.
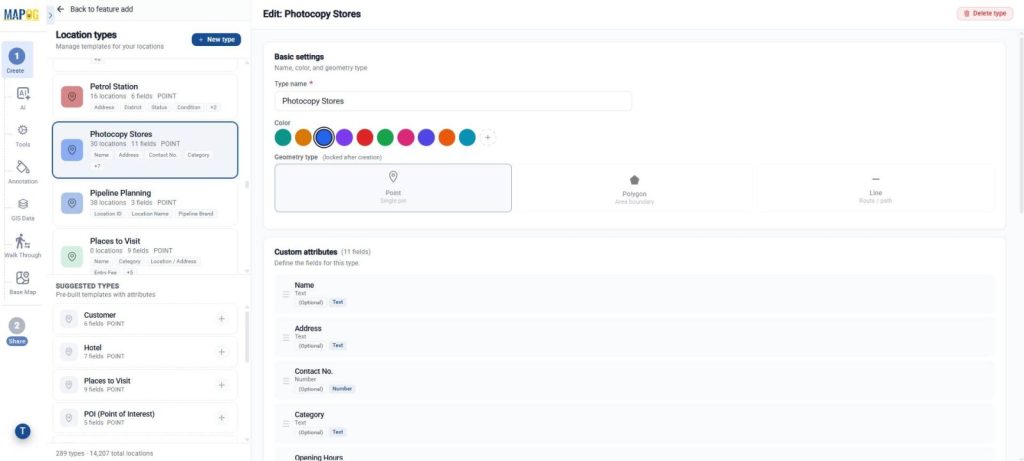
Next, add custom attributes such as Area in text. To upload documents in map, create a field called document & set the field type document as well. You can also create additional fields based on your project requirements. Once complete, click Create Type.
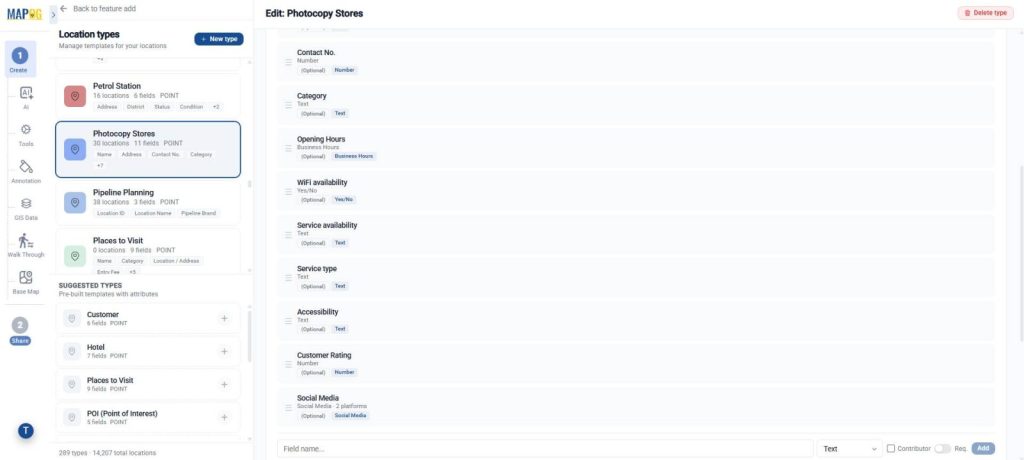
Step 4: Upload Your CSV Data
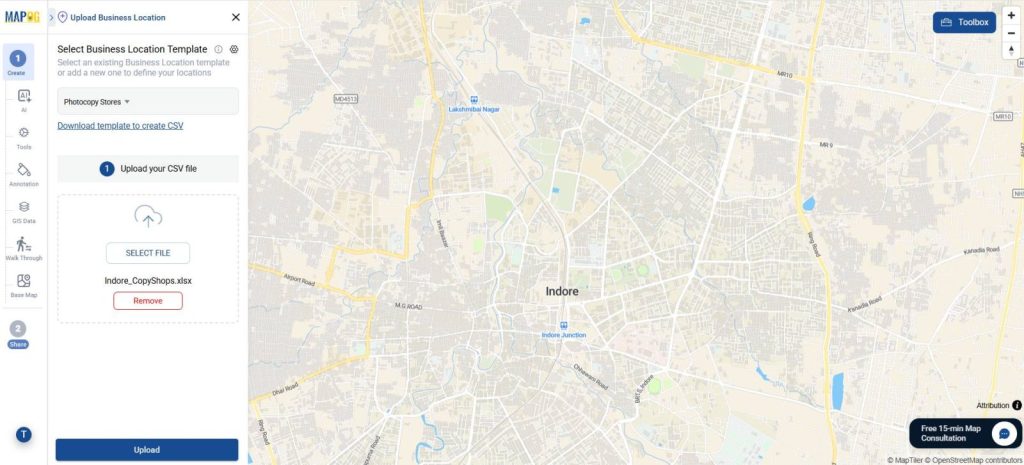
Then Go back and Select the Business Location Template you just created. Browse & upload csv file.
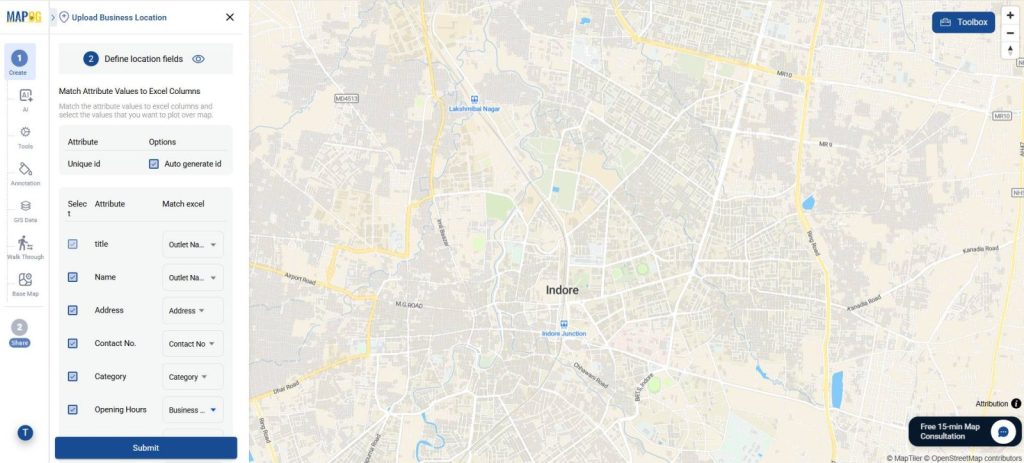
First in the Unique ID field, Assign Hospital ID . This helps prevent duplicate records from being created. Match each CSV column to its corresponding attribute. Then, match the other attributes with columns in your CSV file.
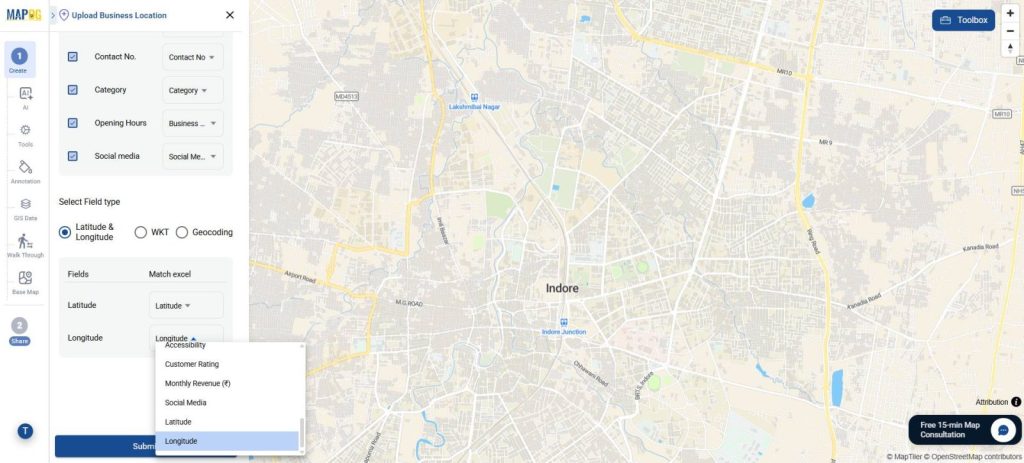
Lastly Select Latitude and Longitude, to assign location data to map. Then click on Submit.
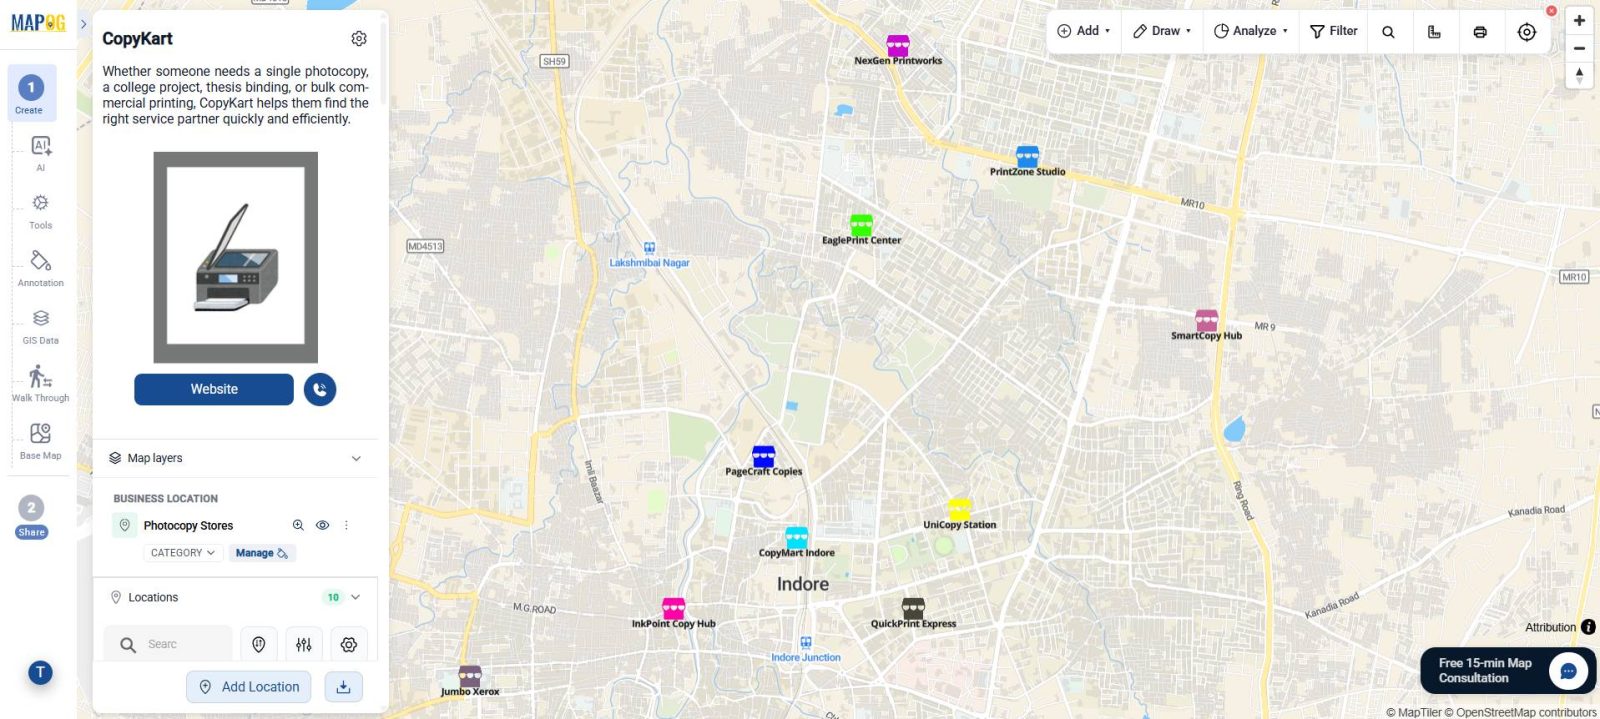
Your hospital locations will now appear on the map as interactive points.
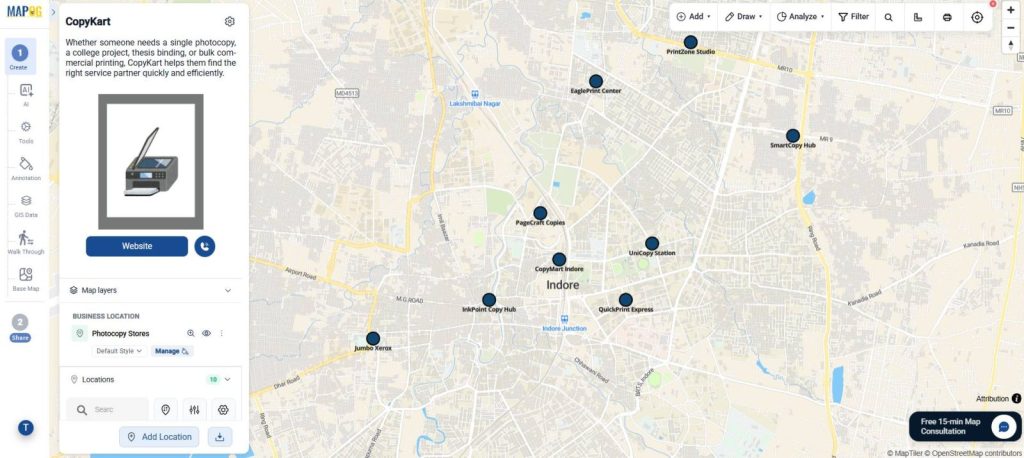
Step 5: View and Edit Location Details
Each uploaded location can now be selected directly from the map.
Click any location to view Business information. To edit a location click the Pencil Icon & select edit business location details.
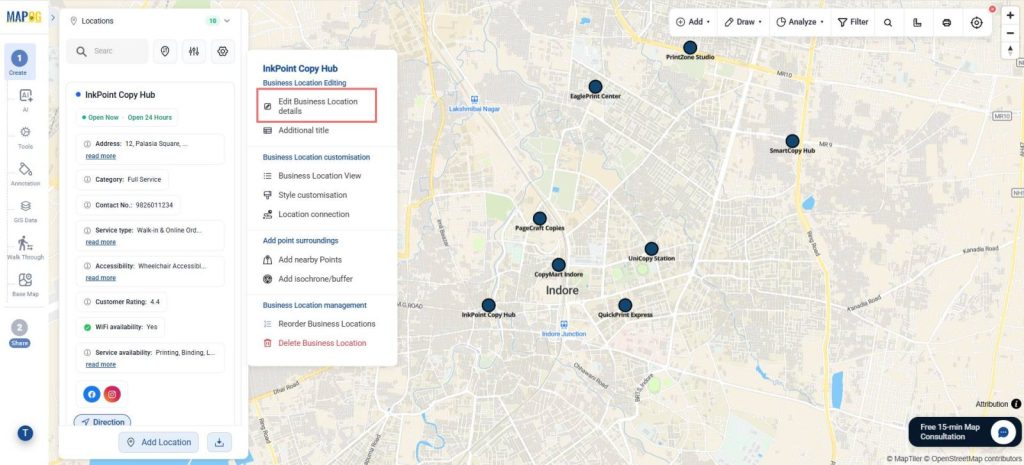
From here you can then add:
- Images
- Descriptions
- Updated business hours
- Additional business information
Click on Save.
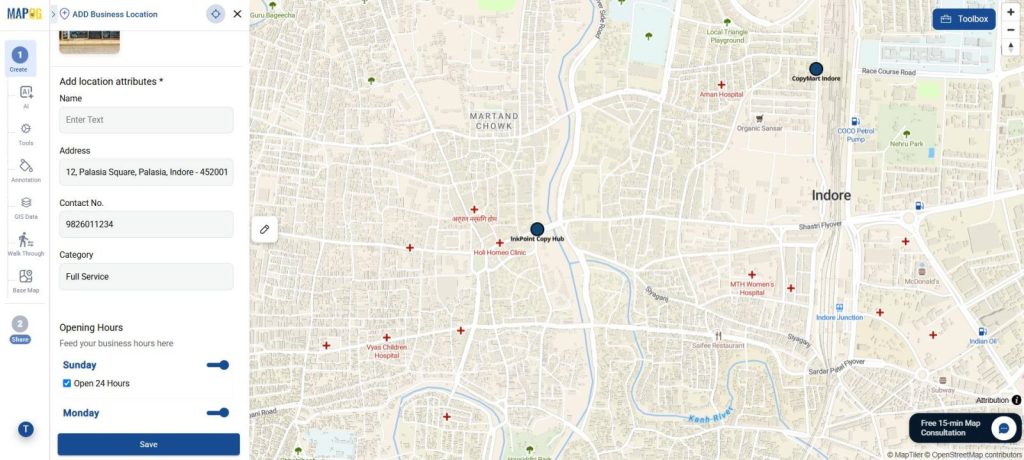
Step 6: Customize Map Visualization
To improve map readability and presentation, customize the appearance of your location points.
Navigate to Map Layer, click on Manage, and select Create New Style. From the Style Modifier, you can choose from a variety of visualization options.
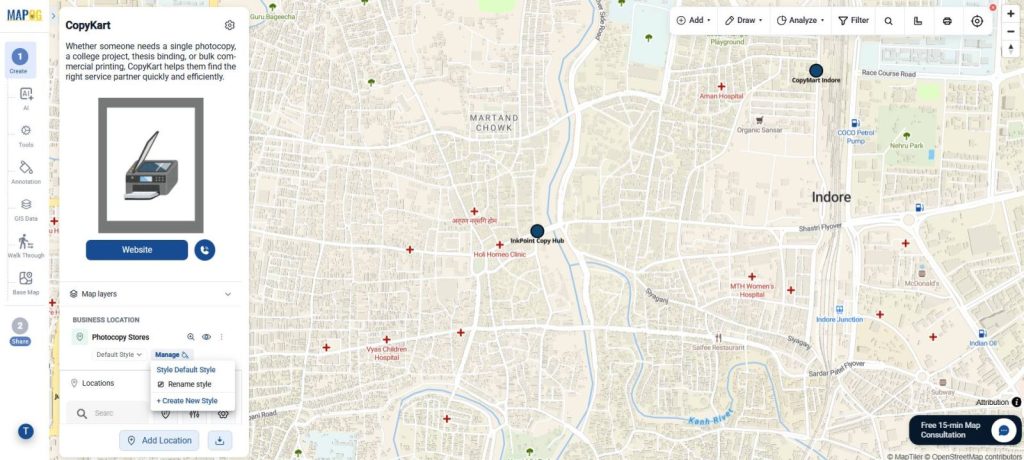
For Example go to category style, here you can select the attribute you want to visualize.
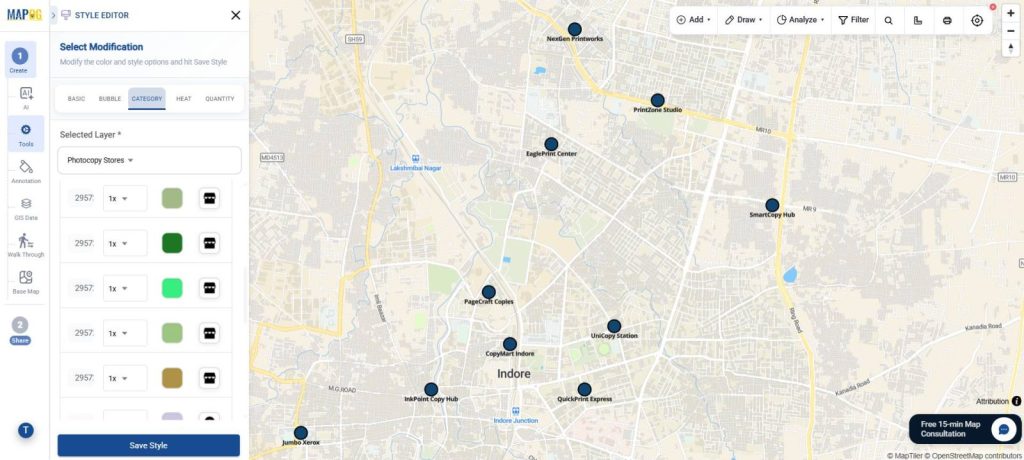
You can assign different colours and Icons, making maps easier to interpret and more engaging for users.
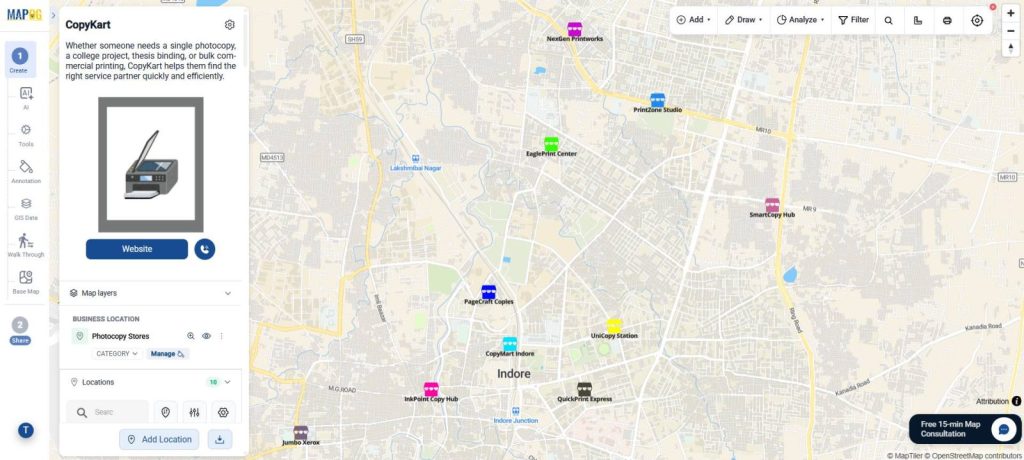
Step 7: Organize Locations with Sort and Filter
MAPOG includes powerful tools for location discovery. Sort, organize locations based on Location or Distance.
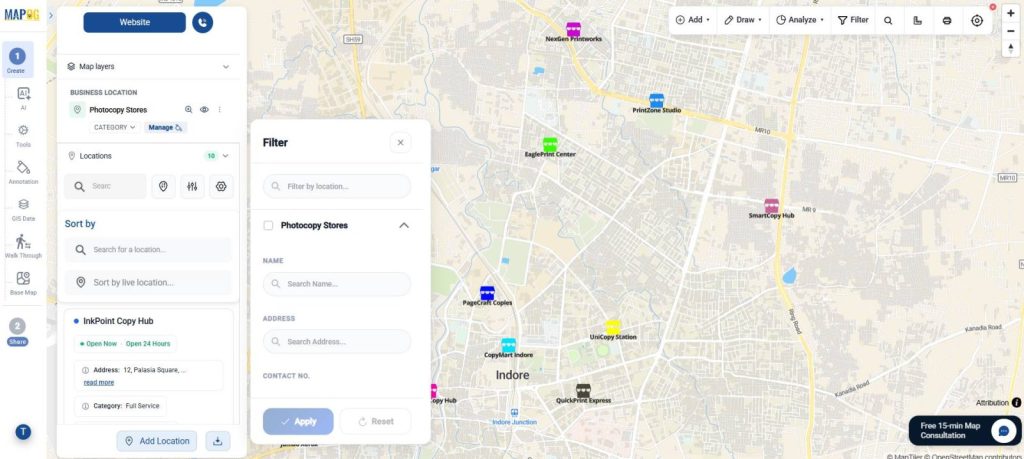
Using Filter, you can filter out services based on Name, Place category etc.
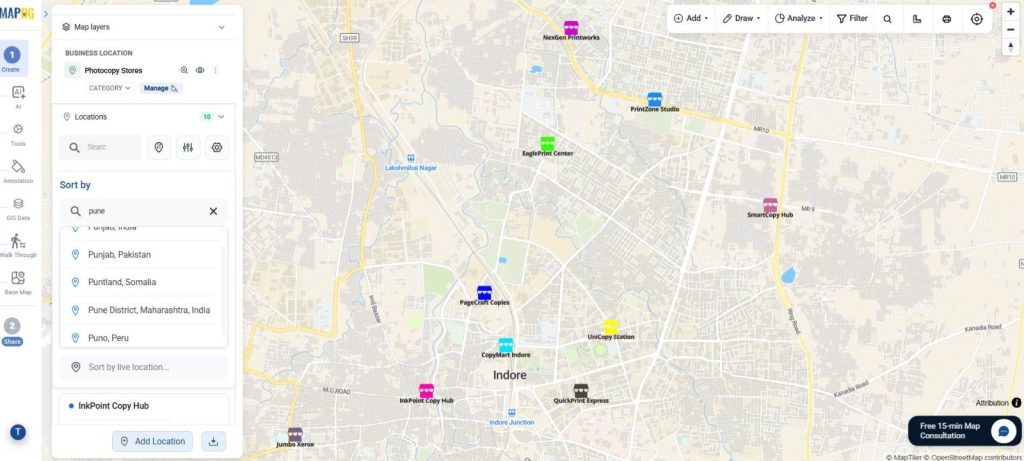
Displays the properties shown in the business pop-ups, from here you can choose what you want to show and what not in the panel.
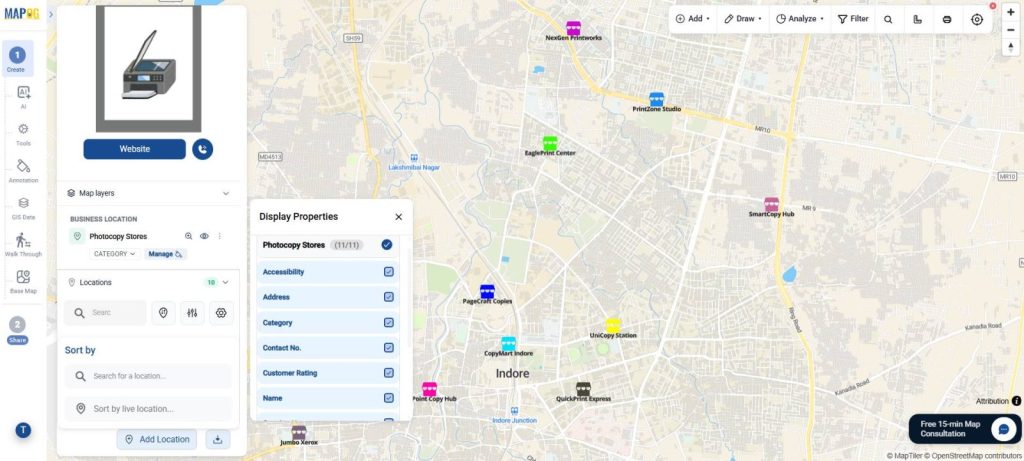
These features help users quickly find locations that meet their requirements.
Step 8: Preview and Share
Once your map is complete, navigate to Preview & Share. Keep the map private for internal collaboration or made public for wider access.
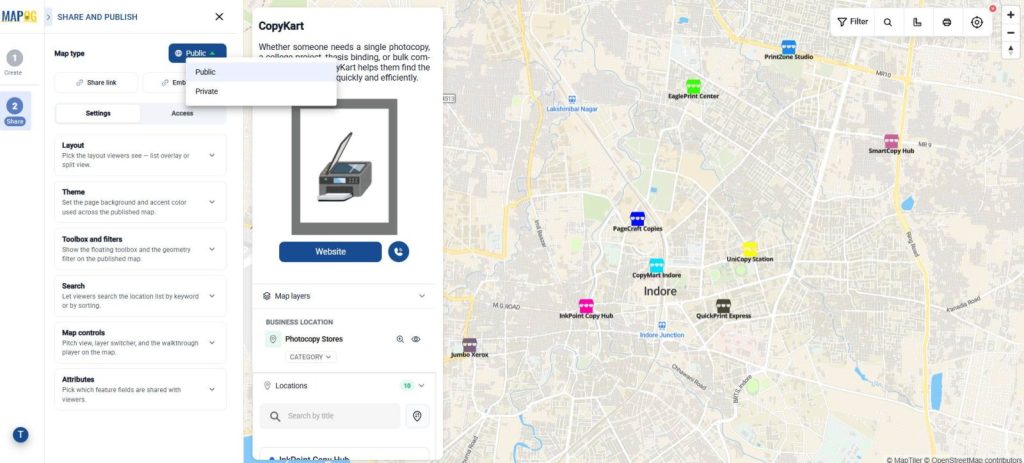
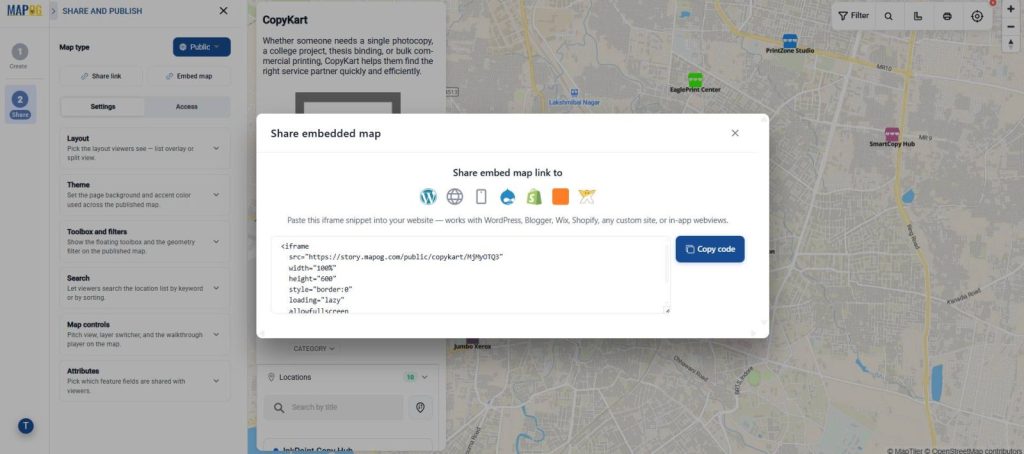
Share links and embed links are also available, allowing maps to be added directly to websites or presentations.
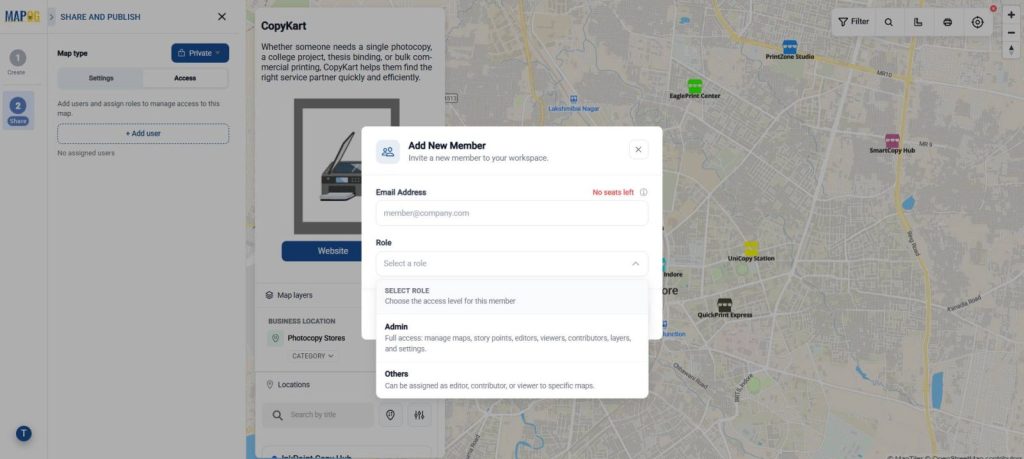
You can also share the map with team members, using add a new member option.
Benefits of Interactive Business Service Maps
Using an interactive maps for business data, provides several advantages. It improves the customer experience by helping users quickly discover nearby service providers. It also offers better data visualization, making business information easier to understand geographically. In addition, it supports centralized information management by allowing teams to manage all location data from a single platform. Interactive maps also increase visibility by helping customers find services they might otherwise overlook.
Conclusion
Traditionally, creating custom location maps required GIS expertise, programming knowledge, custom web development, and dedicated mapping software. For many businesses, this increased both costs and implementation time. No-code mapping platforms like MAPOG now allow organizations to upload existing spreadsheets, create interactive maps instantly, customize visualization styles, add business information, share maps publicly, and embed maps on websites, all without development resources. Whether you’re managing a network of print shops, franchise outlets, or retail stores, MAPOG provides an efficient way to visualize location data, and centralize business information.
Other Related Articles You Might Be Interested In: