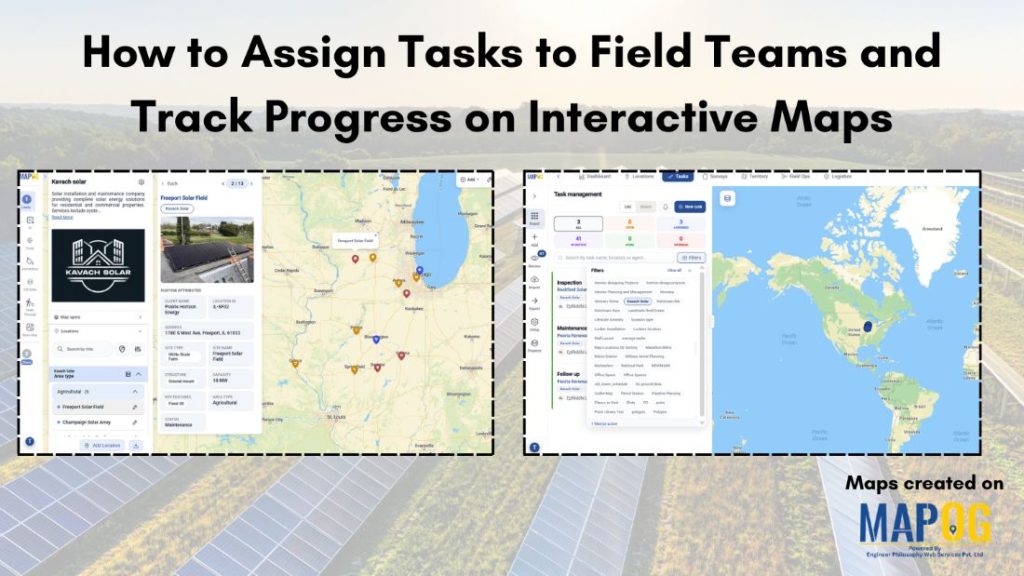
Field operations often struggle with disconnected workflows, delays and limited visibility, making coordination difficult. With MAPOG, you can solve this with interactive map that connects tasks to locations, allowing managers to assign tasks to field teams by proximity, track progress live, and monitor activities from a central dashboard. Combined with a mobile app for updates, tracking, and field reporting, it improves efficiency, accountability, and decision-making across teams.
Key Concept of the Map
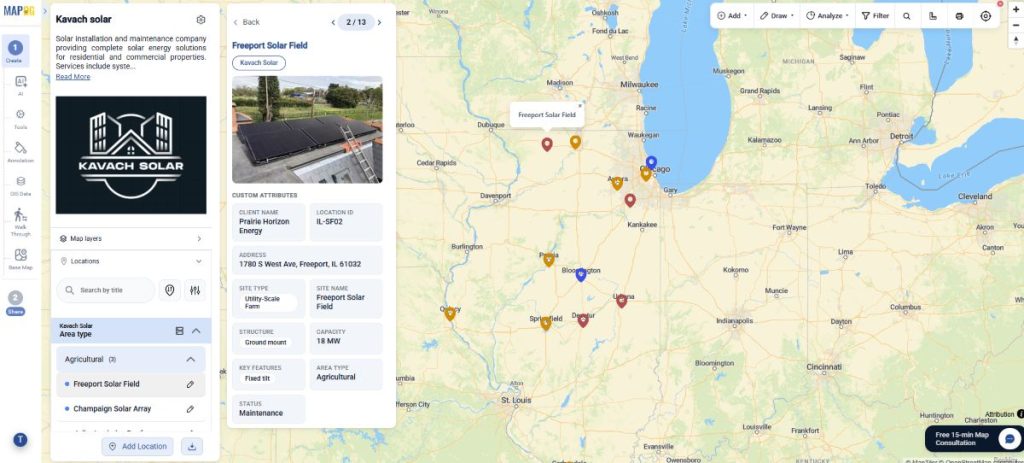
The interactive map connects tasks, locations and teams in one centralized view. Managers can assign tasks to field teams based on proximity, track progress and monitor field activities. So, a solar company can assign installation or maintenance jobs to the nearest available technician for faster response and greater efficiency.
Step-By-Step process for creating map
Step 1: Create location type
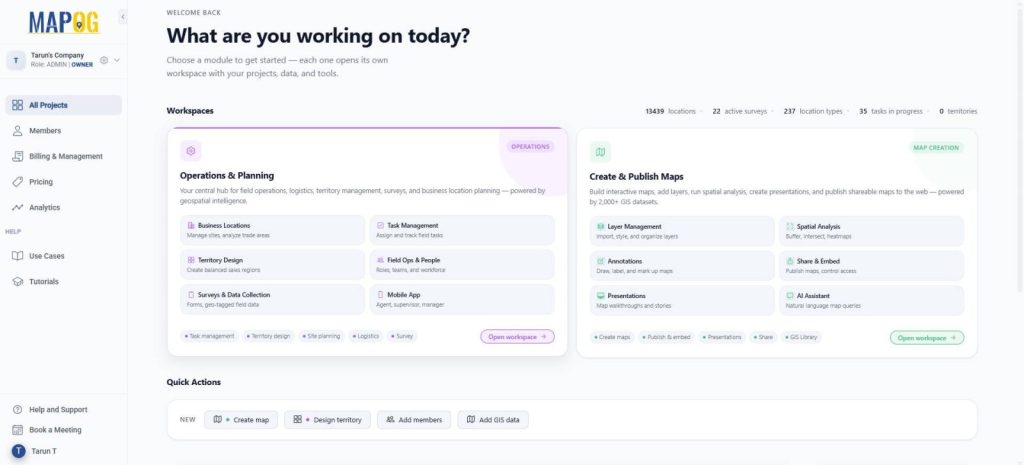
Go to MAPOG, In Operations & Planning section on the dashboard.
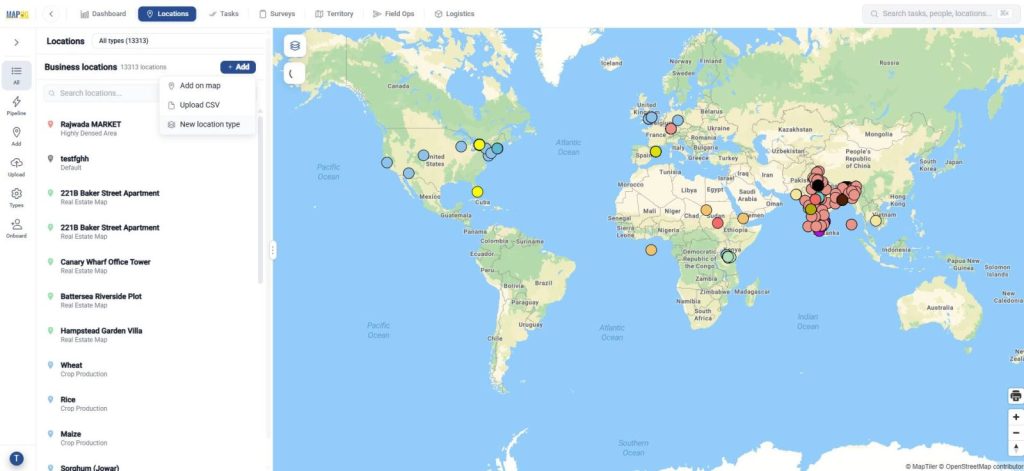
Go to locations for creating a custom location template to accommodate the attributes that each asset should display and click ‘New location type’.
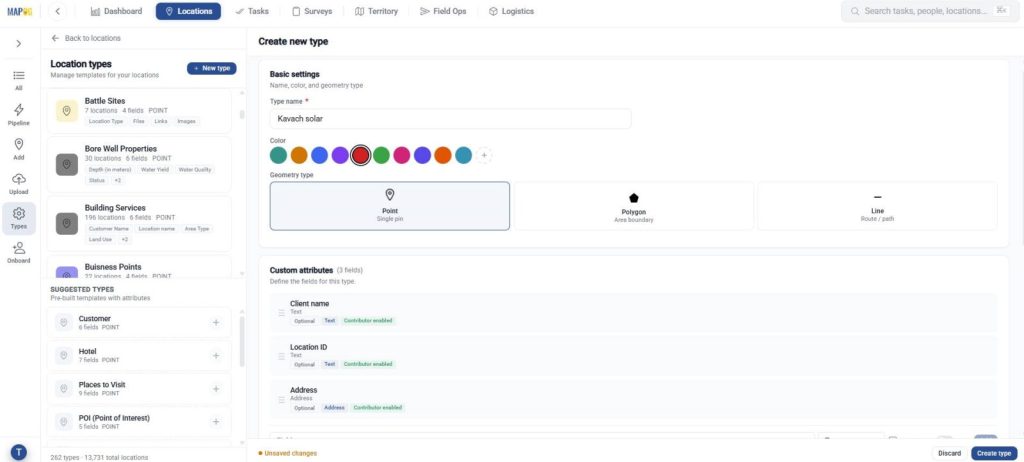
Further, add a title, color, and set geometry as a point. Then include attributes like name, site type using select or multi-select fields. Enable contributors so users can view it in the contributor app.
Step 2: Add locations
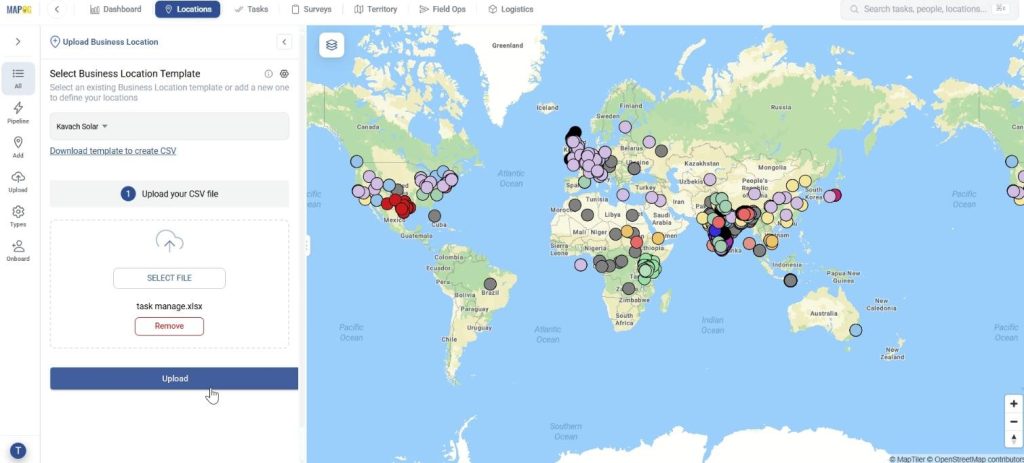
Now, click on upload, to upload all details from the spreadsheet to the map. Here, select your custom location template from dropdown, browse excel file and upload.
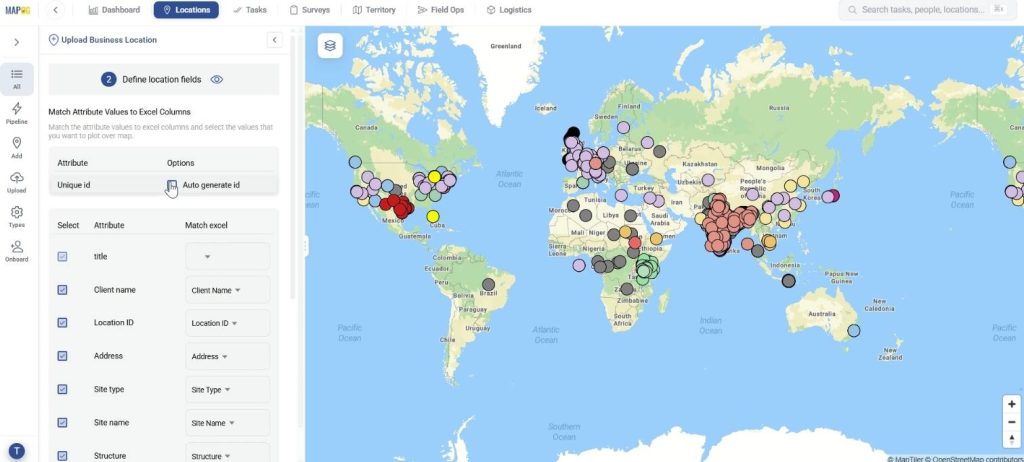
Next, define location fields, assign each point an auto-generated unique ID to track locations and prevent duplicates. Then map each attribute to corresponding Excel column for easy data upload.
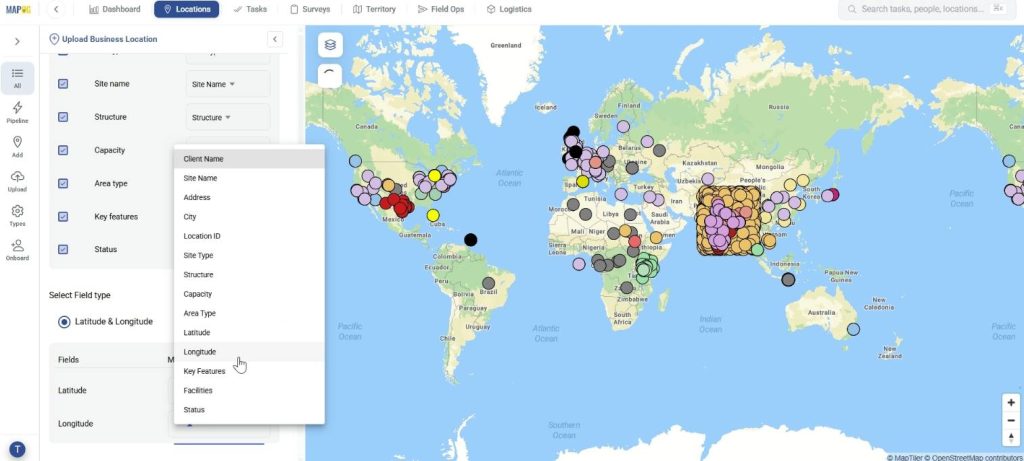
Finally, select field type and match your Latitude & Longitude column and submit. Your points will be auto-plotted on the map.
Step 3: Edit business location details
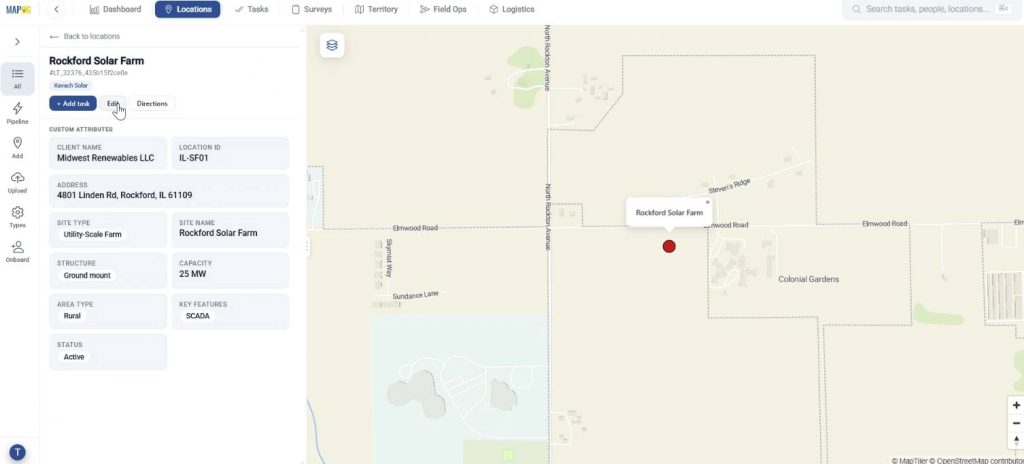
You can edit details for each point. Go to your uploaded business location by searching it.
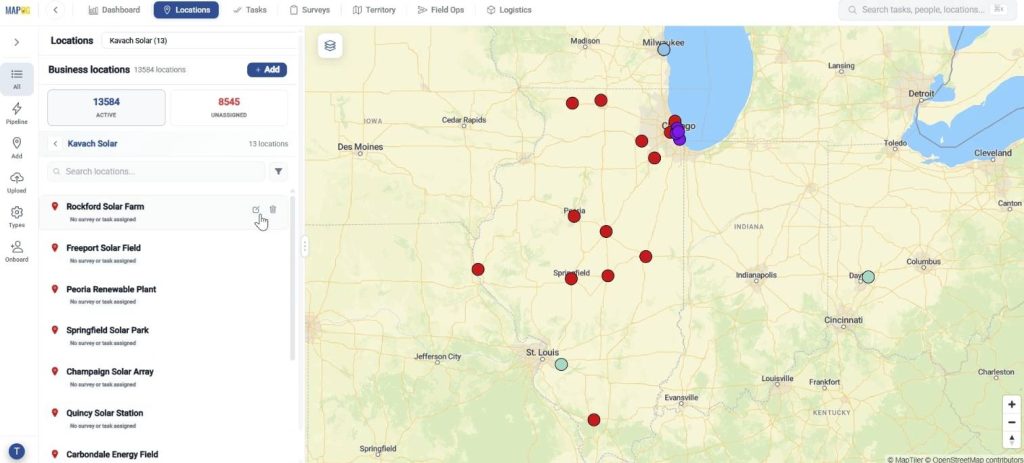
Further, click on edit.
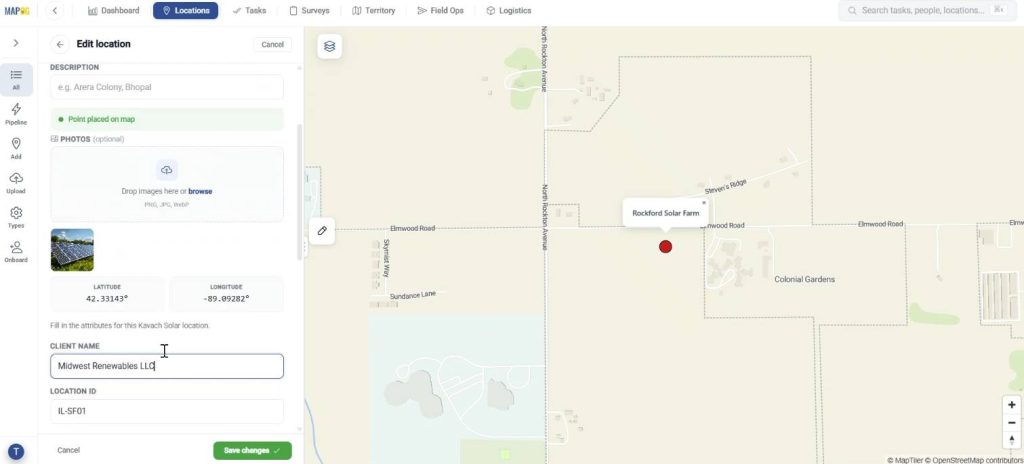
Finally, add area photos and other required details and save.
Step 4: Create completion form
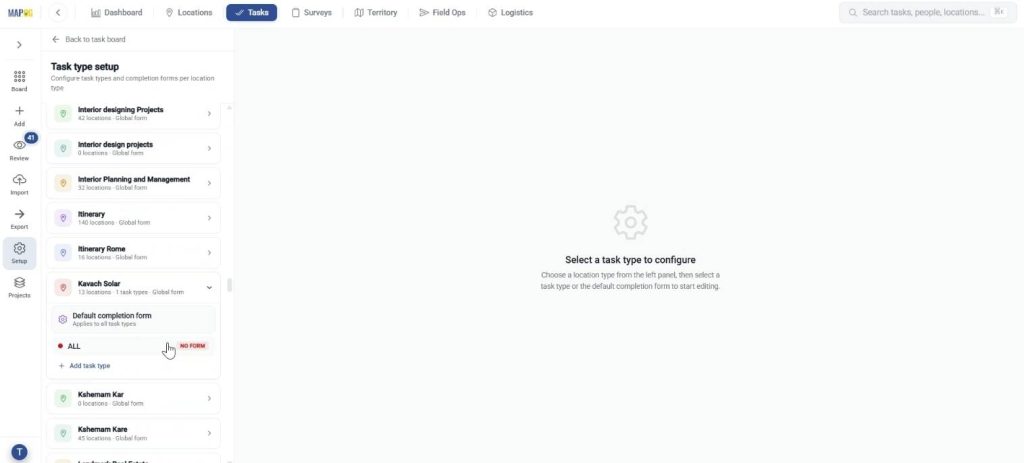
Thereafter, under tasks, click task type setup and locate your location template.
Now, in the default completion form, select per task type to create a completion form for supervising work.
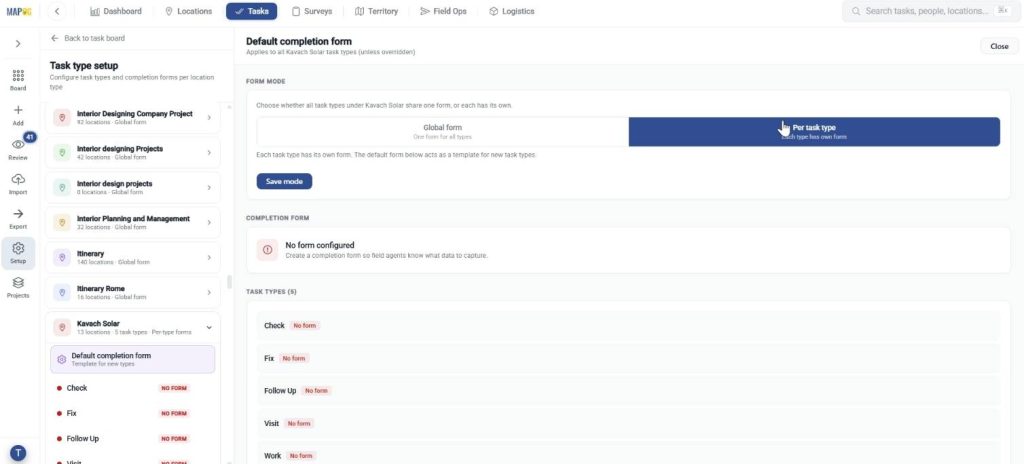
You can create task types and make completion forms for each task type, add questions with responses such as text, select, multiselect and image for verifying work done.
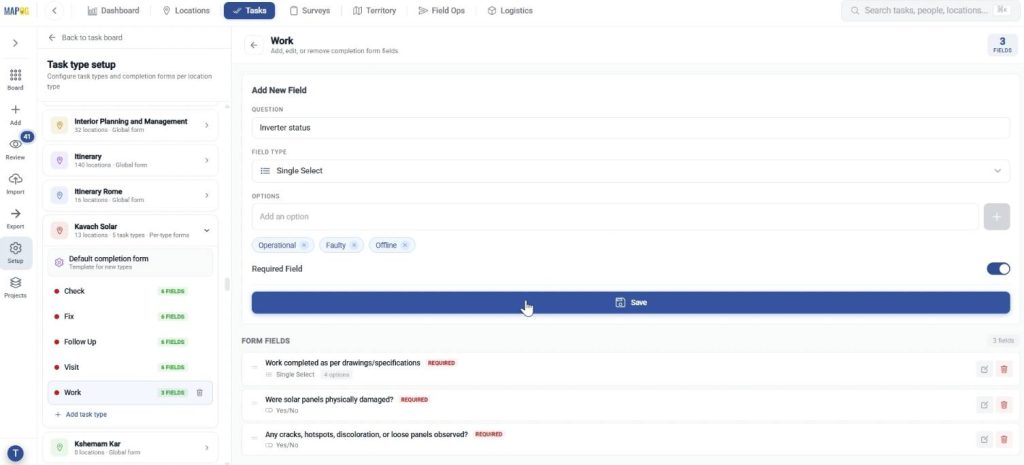
Step 5: Add task
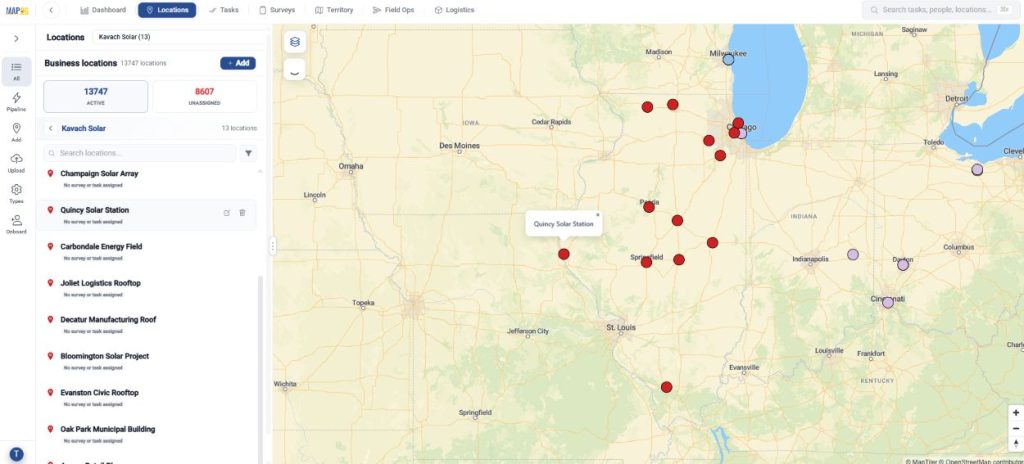
Now, in locations, find your location type and click on desired asset location to assign tasks in order to keep track of the assets.
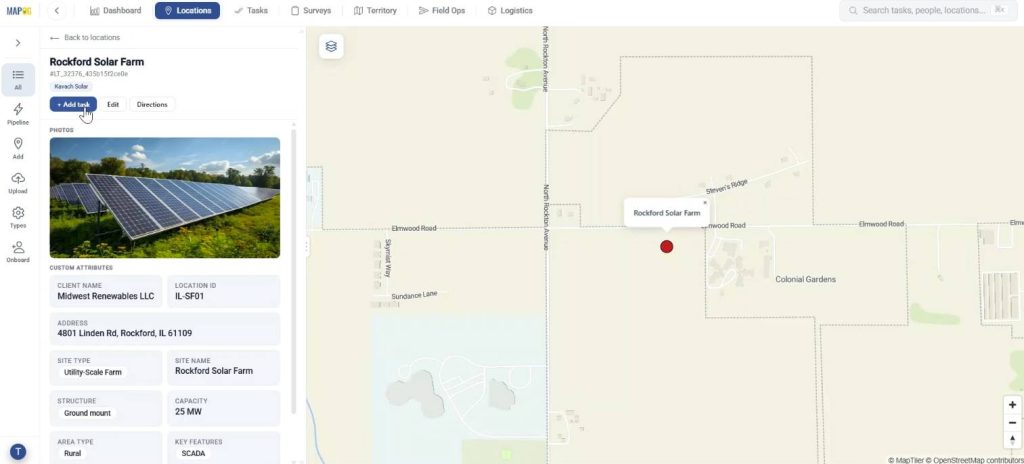
In the location, select Add task.
To create new task:
- Select task type
- Add task details like title and description
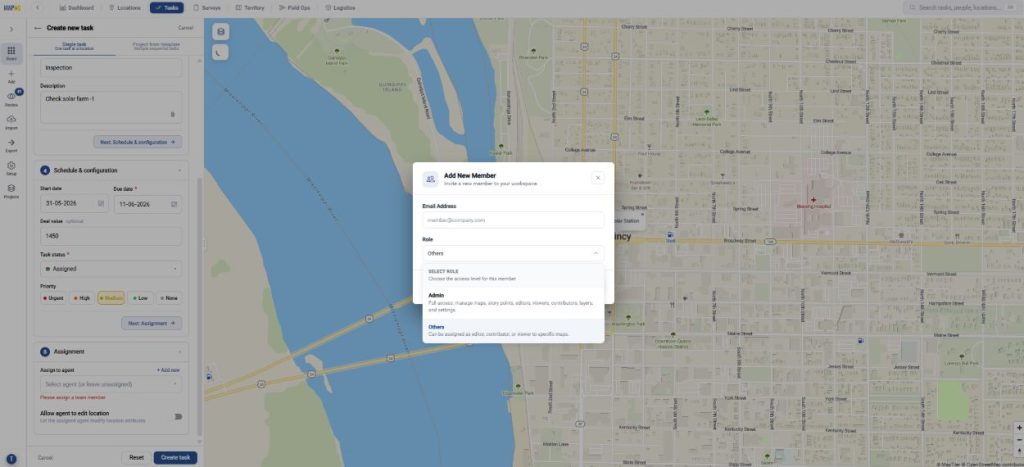
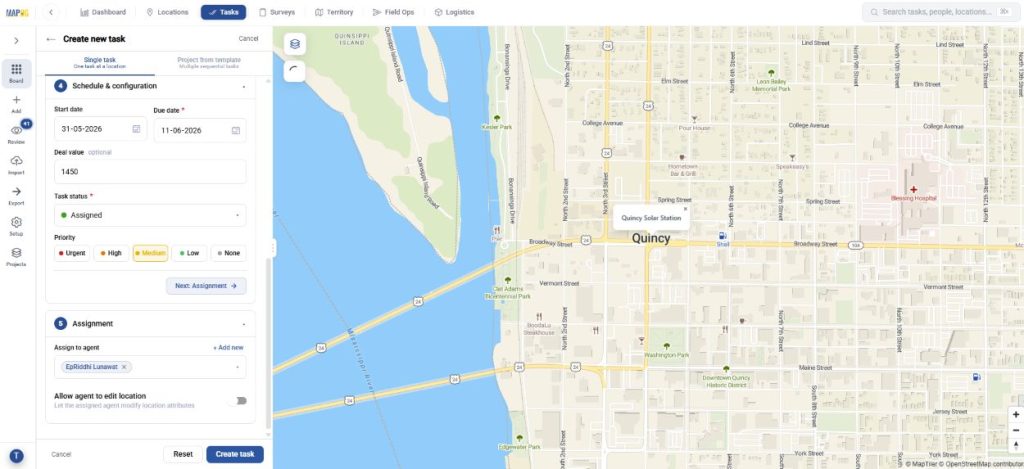
- Schedule and configure i.e. assign due date, value, task status and priority
- Assign tasks to members
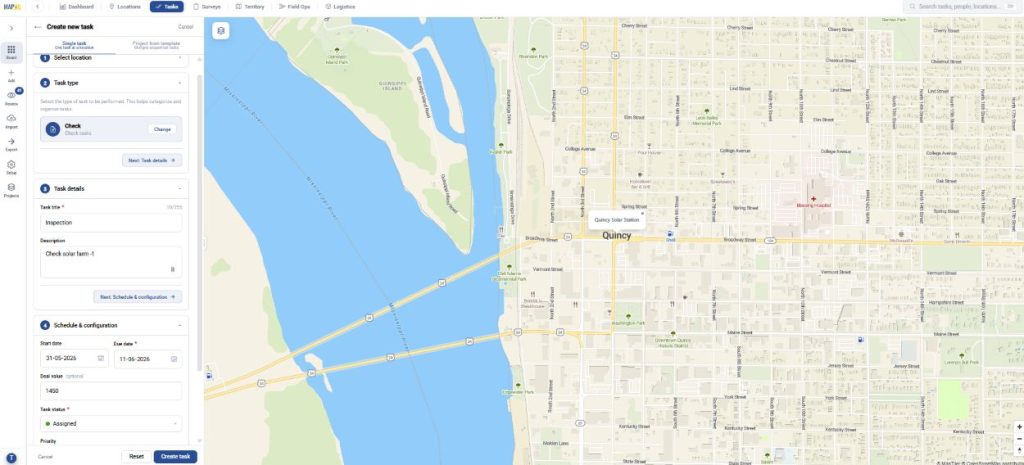
To assign a new member, click add new in assignment and add email id and member role and invite. Then select from the dropdown.
Finally, click create task.
Step 6: User interface
The assigned users can see tasks in the MAPOG Contributor app. They can view and filter them. Afterwards, they can update the status of work as started or on-hold, add comments.
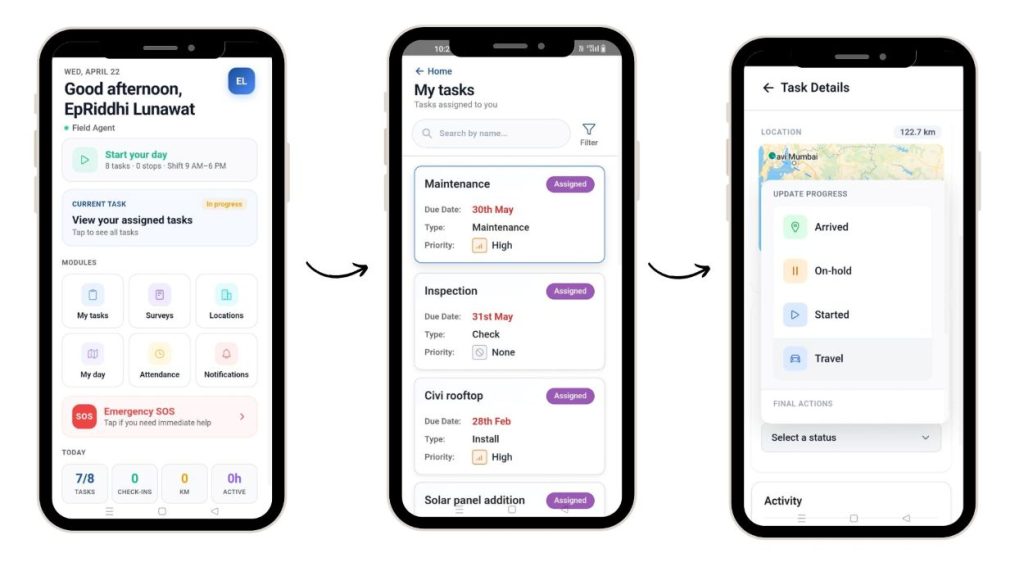
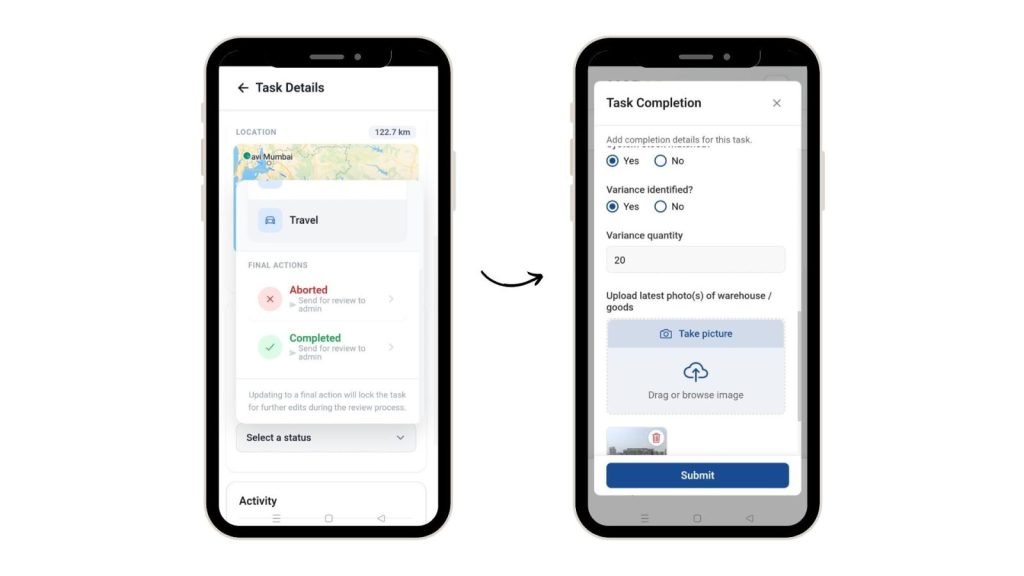
Finally, they can select completed status and fill the task completion form, along with images and submit for review.
Step 7: Task management
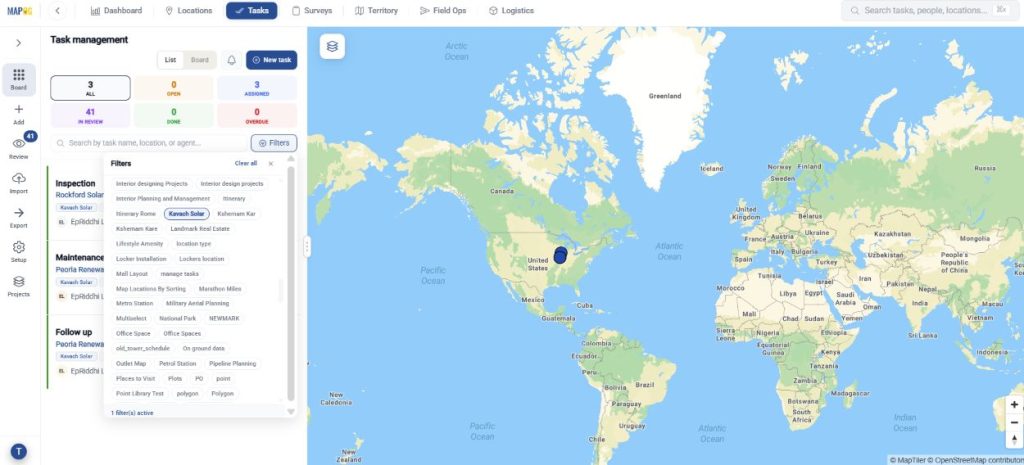
Further, in the task management section, you can filter tasks and view by location, type, etc.
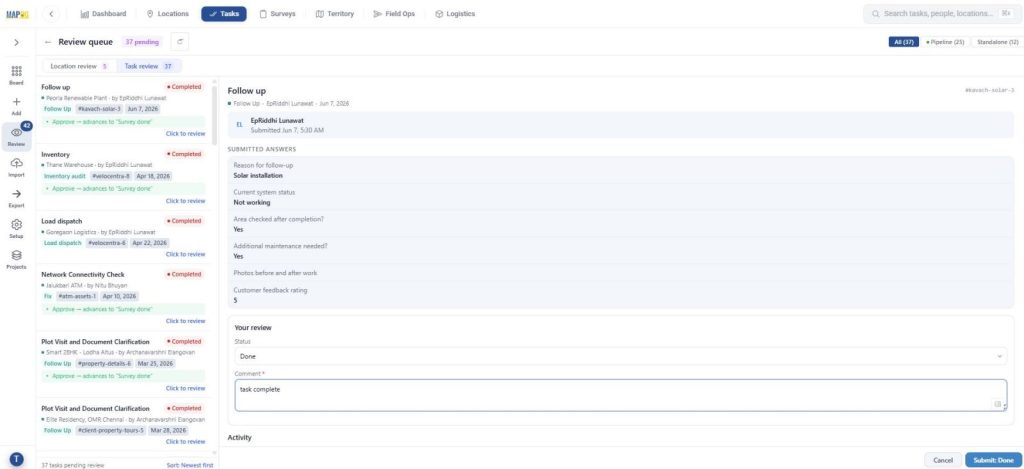
Further, review the submitted tasks in task review, select status and comment.
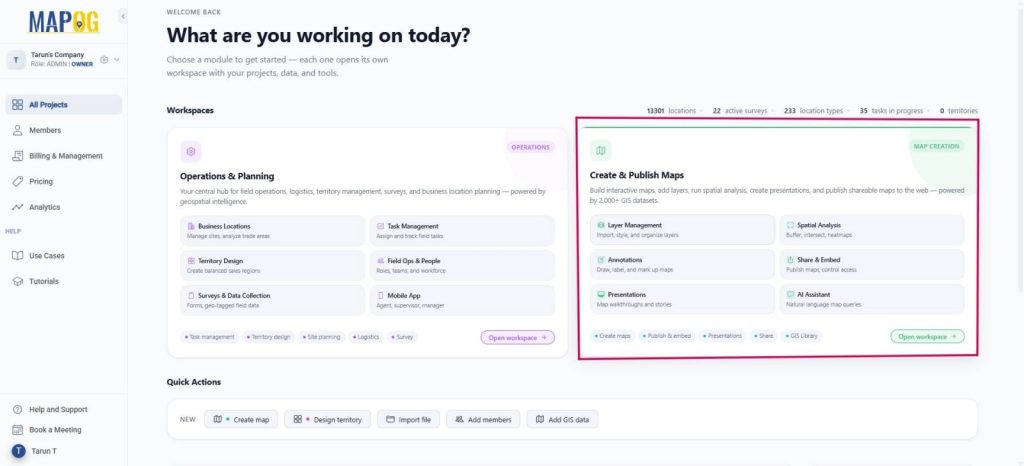
Step 8: Create a new map for your assets
Go to MAPOG dashboard, click ‘Create & Publish Maps’.
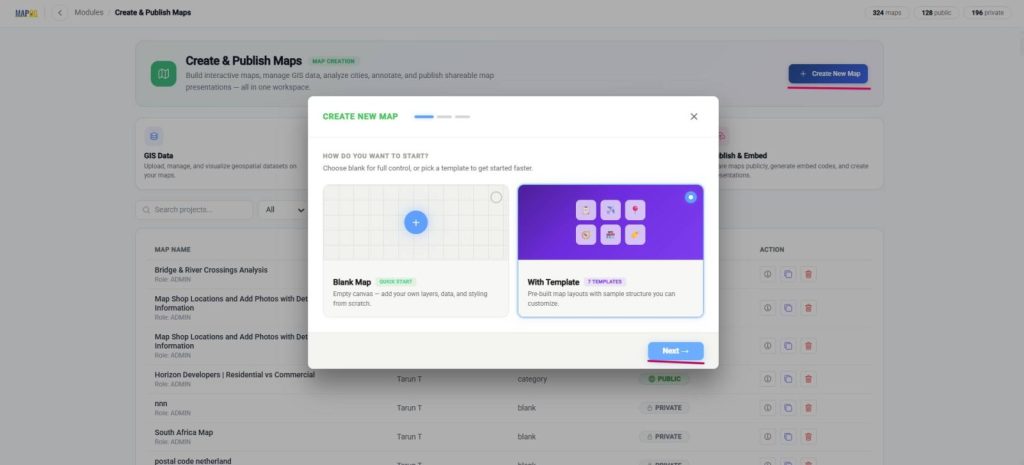
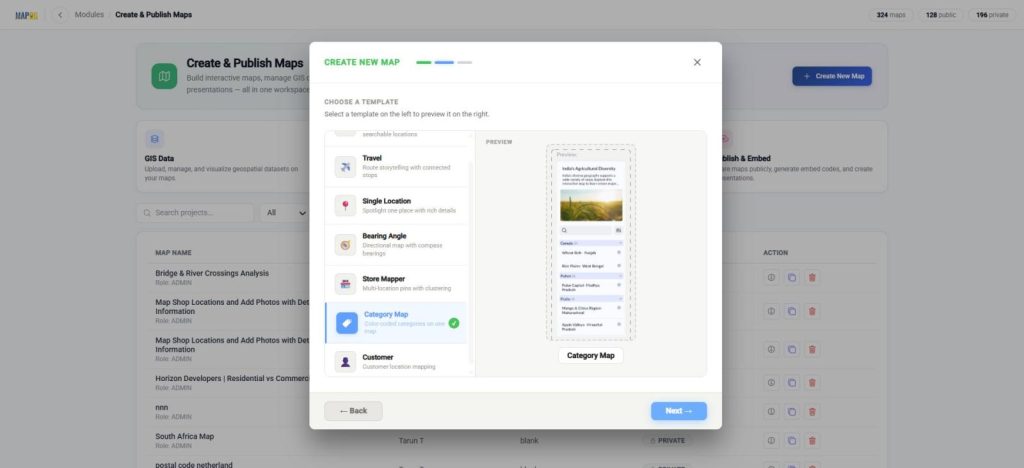
Next, click create new map, with template and press next.
Select Category template and next.
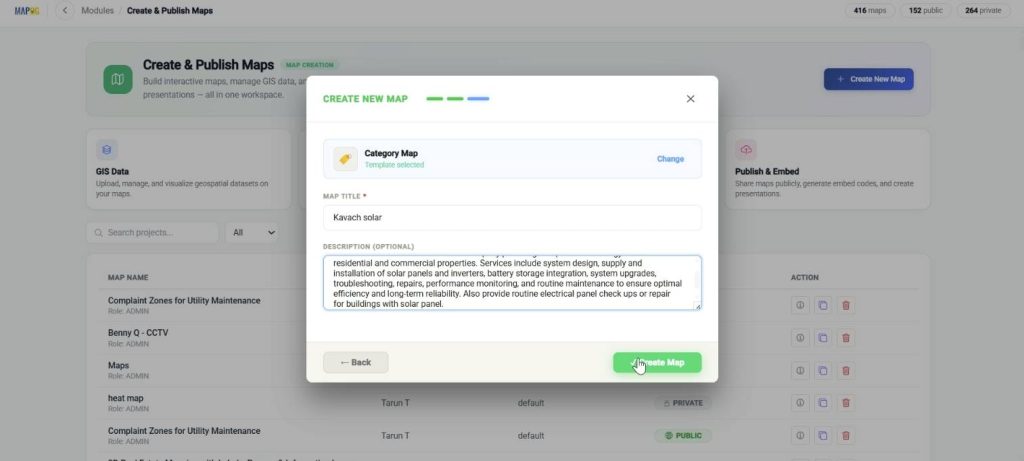
Finally, add title and description and create map.
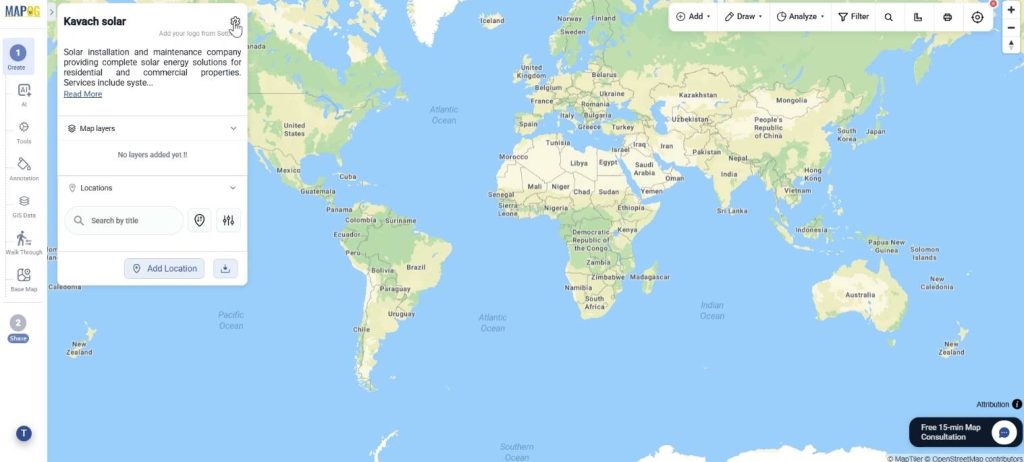
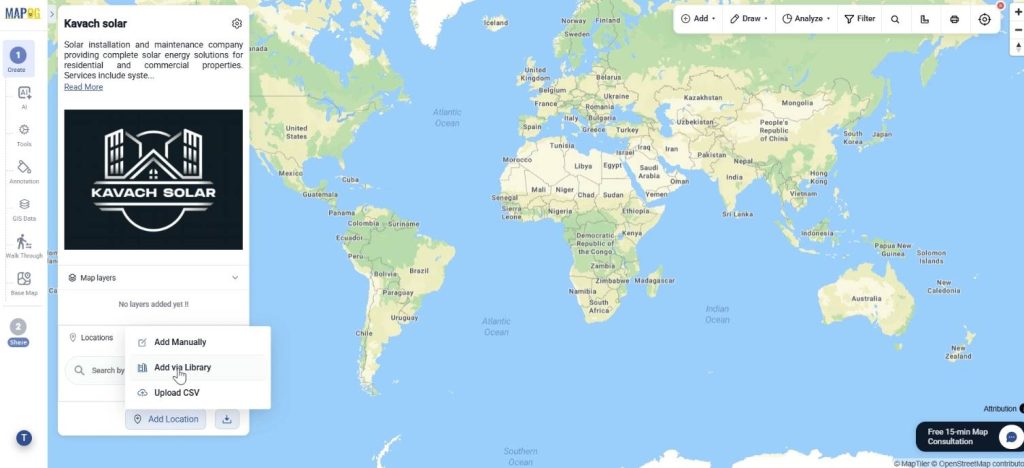
To add company logo, Go to map settings.
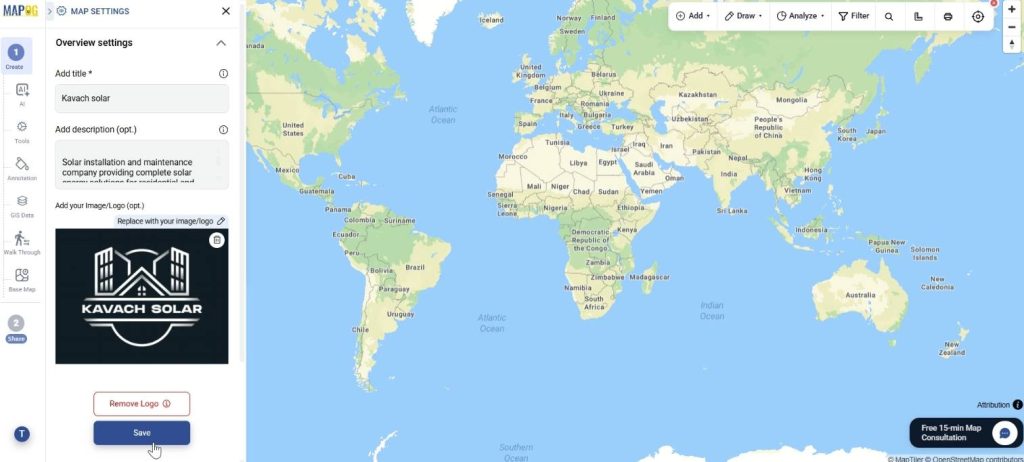
Using upload option, add company logo and save
Step 9: Add business locations to map
Finally, click add location and add via library to add your uploaded locations on the map.
Navigate your custom location template from dropdown and click on it.
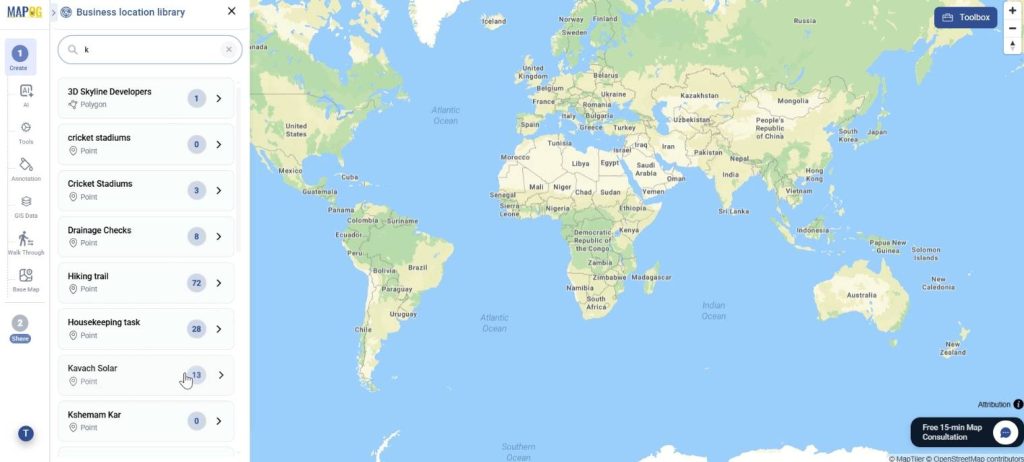
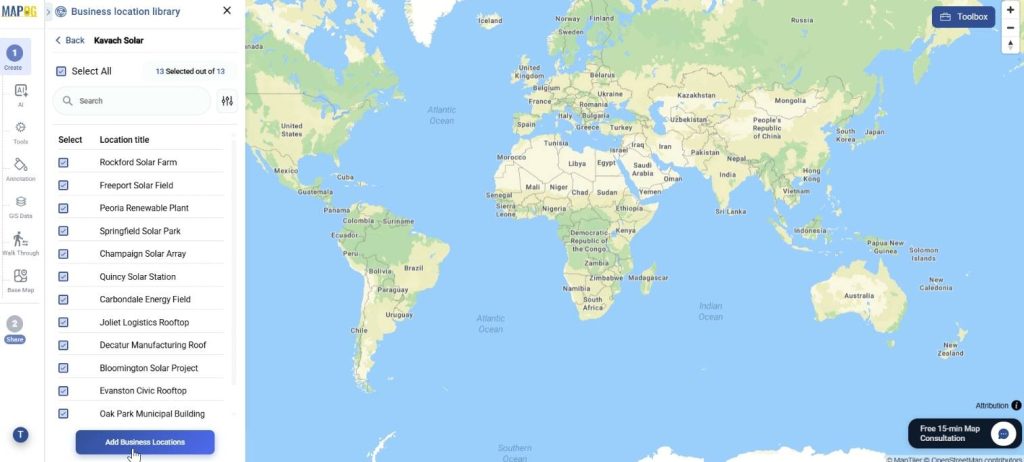
Further, select all locations and click add business locations.
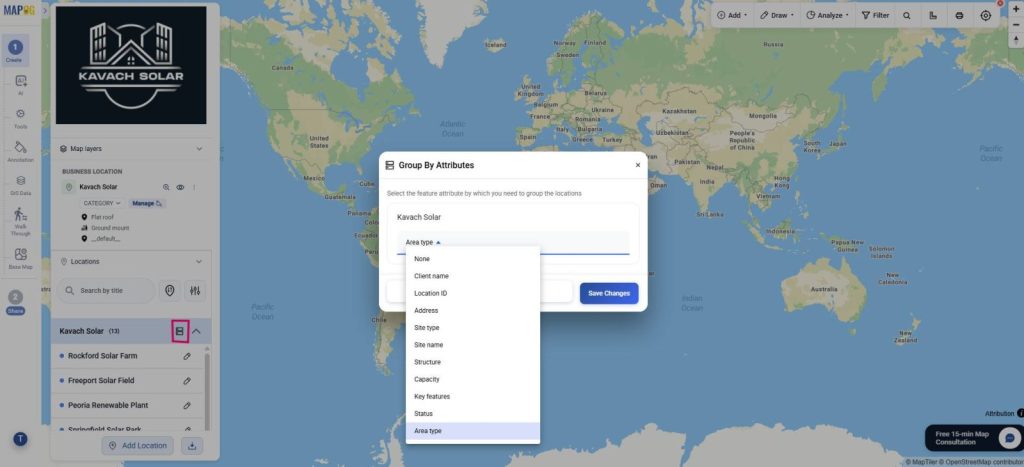
Step 10: Group By, Filter and sort map
Use “Group by Attributes” to organize locations. Select an attribute (e.g., area type ) to cluster data into groups like rural or agricultural.
Using the Filter option, view locations selectively based on requirements. Go to Filter and you will view the assets of your choice on the map.
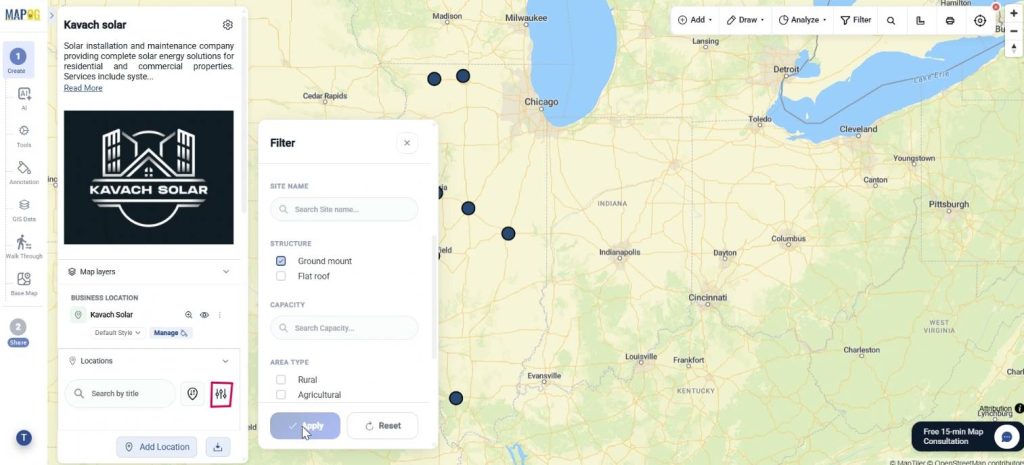
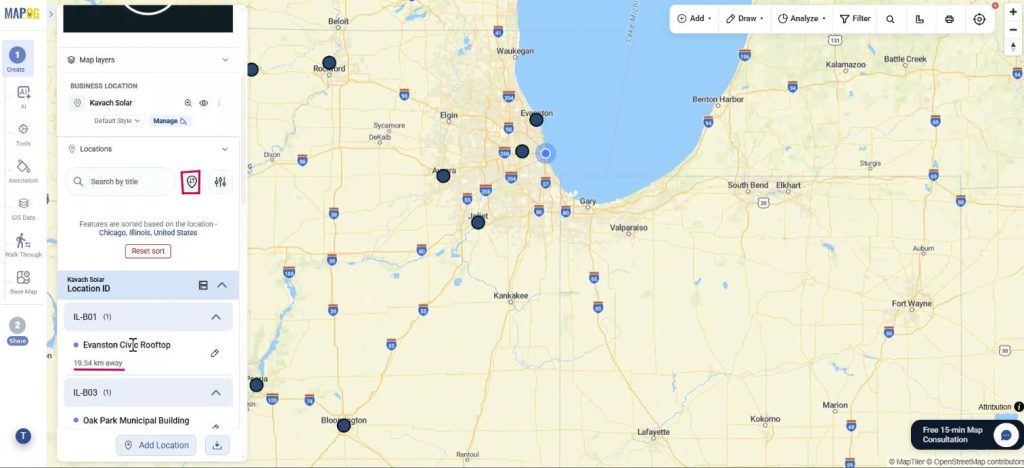
Finally, use ‘Sort by’ and view locations by live distance or certain location. Further, distance from location is also visible.
Step 11: Add style layer
Go to add layer style to style points.
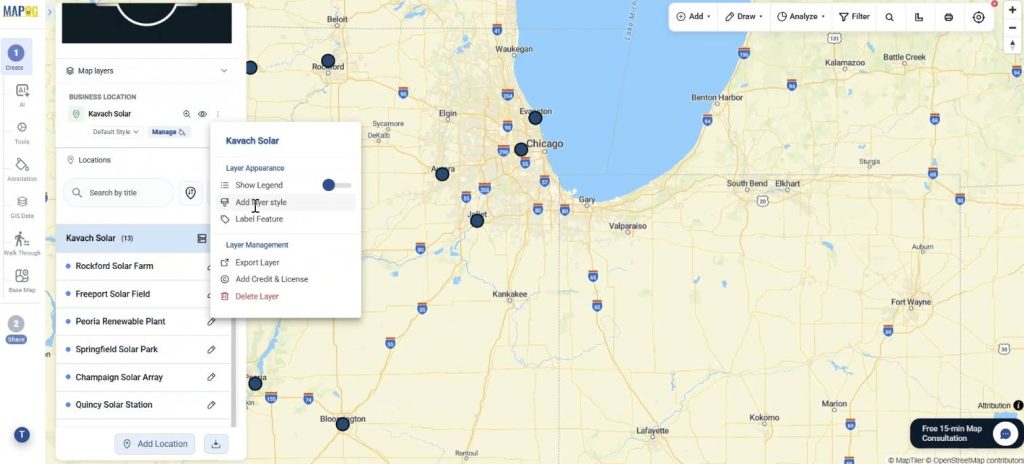
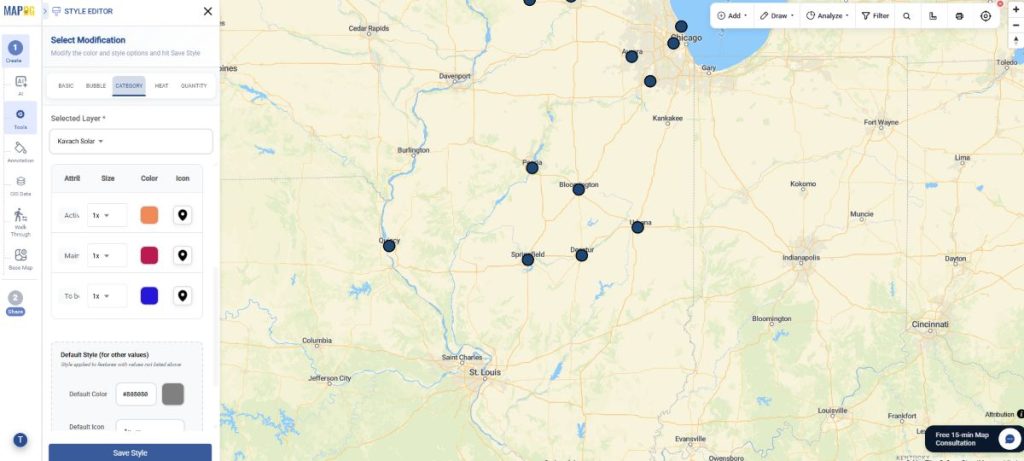
In category style, you can choose suitable attributes, assign different colours or icon and save.
Step 12: Preview & Share map
Finally, in preview & share, you can choose map type as private or public.
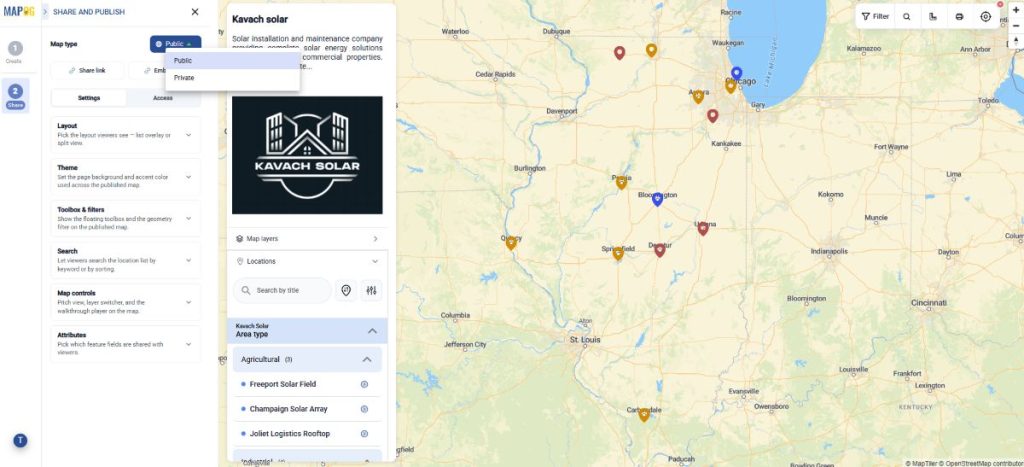
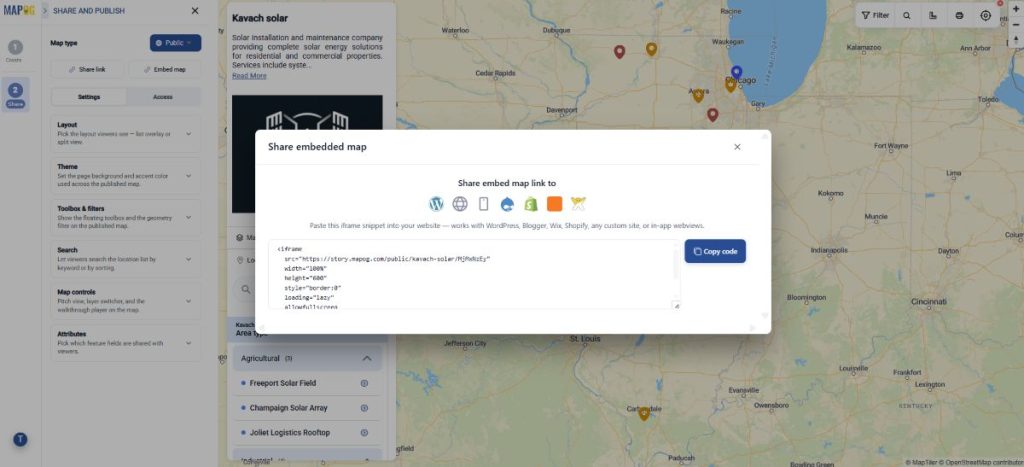
Further, to share the map, you can share map link, embed map link to share it across platforms. Optionally, add users to the map for collaboration purposes.
Industrial Benefits
Interactive map-based field management improves productivity by assign tasks to field teams. Real-time tracking reduces delays, optimizes resources, and enables faster responses, while mobile updates improve accountability and operational visibility.
Conclusion
Efficient field operations require clear coordination and real-time visibility. By connecting tasks, locations, and teams on one platform, organizations can streamline workflows, track progress, and improve service delivery.
MAPOG Contributor App: