#LocationIntelligence

How to Draw Lines, Polygons, and Shapes on a Map Without GIS Software
How to Draw Lines, Polygons, and Shapes on a Map Without GIS Software

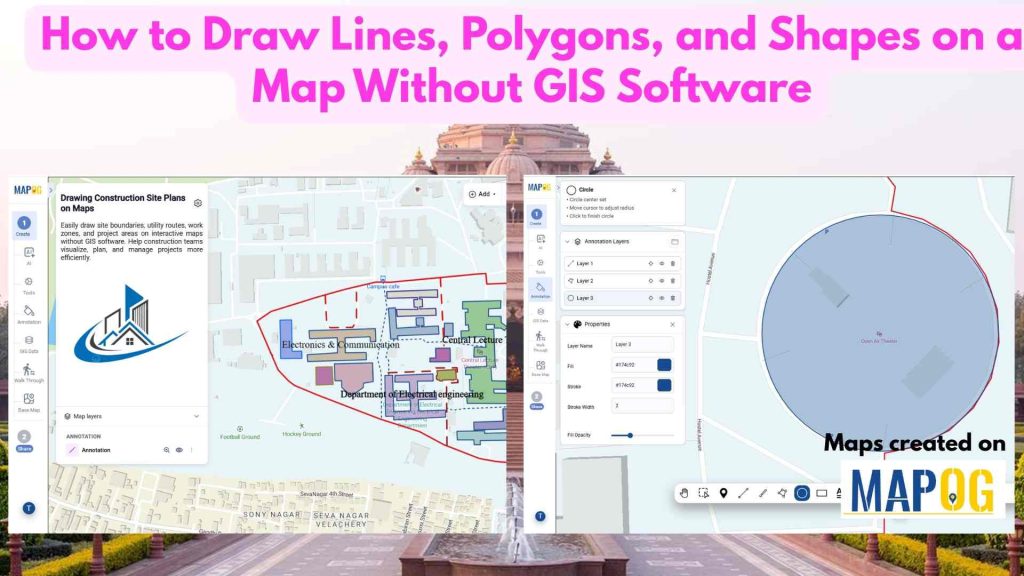
Construction projects often rely on static plans that are difficult to update and share. As a result, teams may struggle to communicate site layouts effectively. However, to Draw Lines, Polygons, and Shapes on a Map makes site planning more interactive and efficient. Instead of using disconnected documents, teams can mark work zones, utilities, and project … Read more

How to Create 3D Building Footprints on a Map (No CAD or GIS Required)

How to Create 3D Building Footprints on a Map (No CAD or GIS Required)

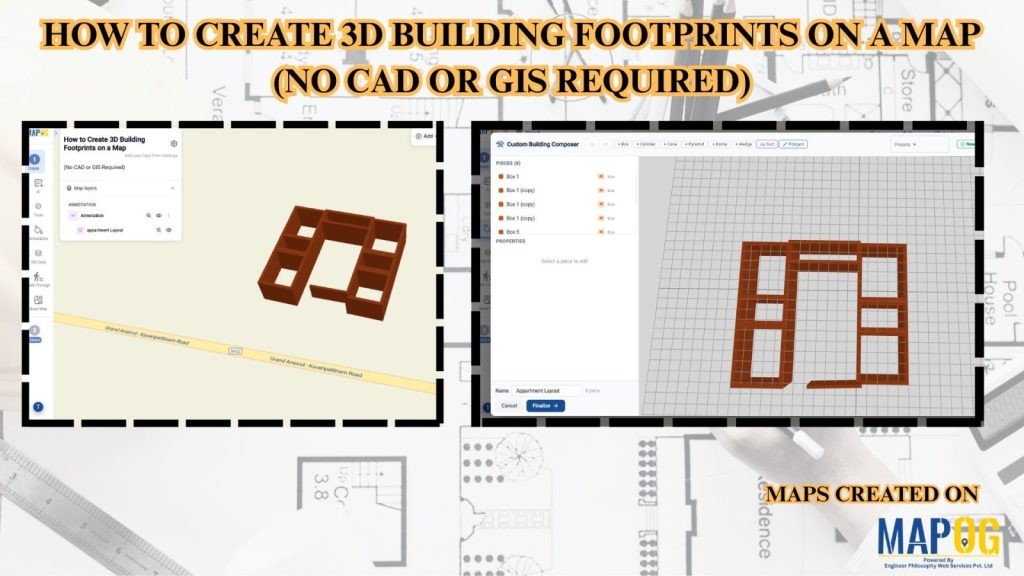
Managing building data and visualizing urban structures often requires specialized GIS or CAD software. MAPOG simplifies this process by allowing users to create and visualize 3D building footprints directly on an interactive map without any advanced technical skills. This helps planners, real estate professionals, educators, and businesses better understand building layouts, heights, and urban landscapes. … Read more

MAPOG Annotation Tool: A Complete Feature Guide for Every Use Case

MAPOG Annotation Tool: A Complete Feature Guide for Every Use Case

Interactive maps become more effective when users can annotate locations, mark routes, and visualize important geographic information. Similarly, the MAPOG Annotation Tool offers powerful drawing and markup features that support planning, collaboration, and location-based decision-making across industries.  Why Use MAPOG Annotation Tool in GIS Maps? However, Annotations turn maps into interactive workspaces by enabling teams … Read more

How to Create Mandatory Task Completion Forms for Field Teams

How to Create Mandatory Task Completion Forms for Field Teams

Retail teams often struggle with scattered records, missed updates, and limited visibility into store operations. MAPOG centralizes retail field activities through interactive maps and mandatory task completion forms, ensuring audits, inventory checks, merchandising tasks, and store visits are completed, documented, and submitted accurately.  Key Concept: Task Completion Forms Mandatory task completion forms help organizations collect … Read more

How to Visualize Population Data Using Interactive GIS Maps

How to Visualize Population Data Using Interactive GIS Maps

In population studies and urban planning projects, demographic data often stays limited to spreadsheets or reports, making it difficult to understand regional patterns and trends. Consequently, users struggle to identify population density, growth areas, or demographic distribution visually. MAPOG Visualize Population Data using interactive GIS maps. Key Concept: Why Use Interactive GIS Maps for Population … Read more

Using 3D Models on Maps for Real Estate and Infrastructure Projects

Using 3D Models on Maps for Real Estate and Infrastructure Projects

In real estate and infrastructure projects, 3D models often stay limited to design software or displays, making them difficult for clients to understand in real-world context. Consequently, they fail to show nearby roads, amenities, transport, or developments. MAPOG maps 3D models with location data. Key Concept – Why Use 3D Models on Maps Because maps … Read more

Plot Your Points on a Map and Add Details with Images

Plot Your Points on a Map and Add Details with Images

In today’s data-driven workflows, simply listing locations in spreadsheets is no longer enough. Teams need a visual and interactive way to understand, manage, and communicate location-based information effectively. Whether it’s for field surveys, asset tracking, or site inspections, relying on disconnected tools often leads to missing context and delayed decisions. With MAPOG, you can Plot … Read more

Plan and Monitor On-Ground Activities

Plan and Monitor On-Ground Activities Using an Interactive Map

In today’s fast-paced operational environment, plan and monitor on-ground activities across multiple locations can quickly become complex and inefficient when handled through disconnected tools. Teams often struggle with limited visibility, delayed updates, and scattered communication, which slows execution and decision-making. With MAPOG, organizations can centralize their planning and monitoring processes on a single interactive map. … Read more

How to Collect Field Survey Data with Photos, Videos, and GPS Location on a Map

How to Collect Field Survey Data with Photos, Videos, and GPS Location on a Map

Traditional field surveys often cause delays, data mismatches, and poor location accuracy. MAPOG simplifies the process by combining field data collection and mapping into one real-time workflow. Key Concept: Collect Field Survey Data with Media & GPS Instead of collecting notes separately and mapping later, MAPOG enables direct data capture on the interactive map. You … Read more

Store Map vs Default Map: Why Store Mapping is Better for Retail and Franchise Businesses

Store Map vs Default Map: Why Store Mapping is Better for Retail and Franchise Businesses

Managing multiple store locations using standard maps often limits visibility, branding, and customer engagement. Default maps provide only basic location details, while MAPOG enables businesses to build fully customized store maps with branded icons, rich information, and interactive features. Store Map vs Default map improves store discovery, enhances customer experience, and supports better decision-making for … Read more