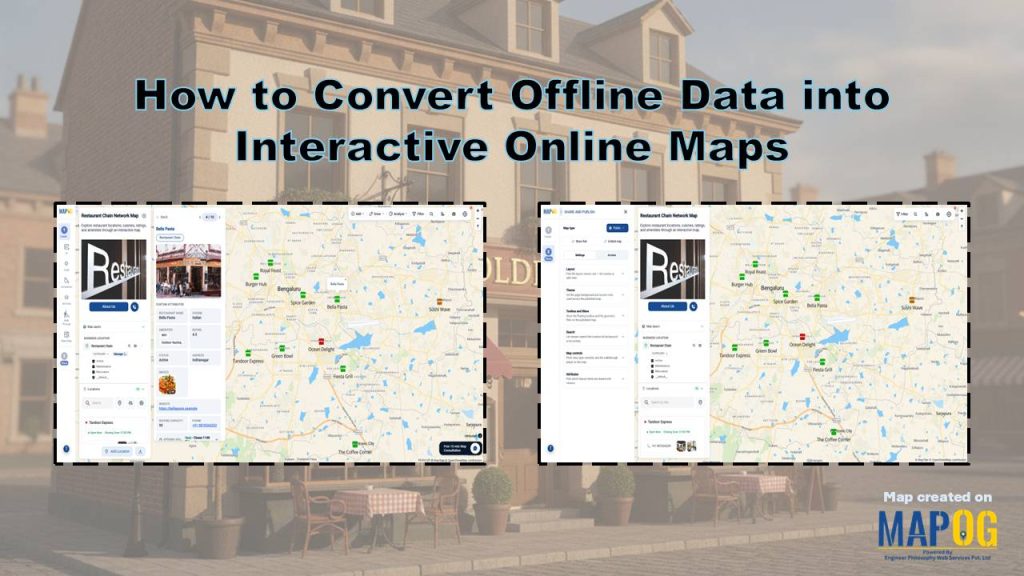
Restaurant chains often manage outlet information in spreadsheets. However, static spreadsheets make it difficult to identify location trends, analyze geographic patterns, and uncover growth opportunities. To overcome these challenges, businesses need to Convert Offline Data into Interactive Online Maps and visualize their network geographically. MAPOG simplifies this process by allowing users to upload CSV or Excel files and create interactive maps within minutes. As a result, restaurant chains gain valuable spatial insights and transform offline datasets into actionable business intelligence.
Key Concept of Converting Offline Data into Interactive Online Maps
Converting offline data into interactive online maps involves transforming spreadsheets into dynamic geographic visualizations that users can explore visually and interactively. Instead of relying on static rows and columns, organizations display their data on an interactive map to gain a clearer understanding of spatial relationships. This helps users to identify geographic clusters, service gaps, and growth opportunities that often remain hidden in traditional spreadsheets.
Steps- by- Step Workflow to Convert Offline Data into Interactive Online Maps
Prepare all your location data in a spreadsheet before you start. Include latitude and longitude fields to plot locations accurately on the map.

1. Create Your map
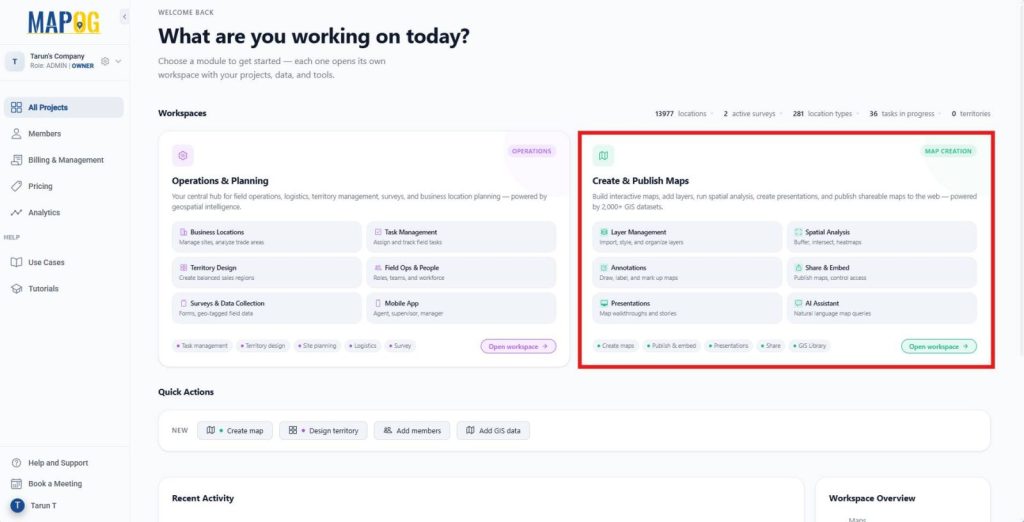
First, go to MAPOG. Then, open the Create & Publish Maps module from the dashboard. This workspace helps you create, customize, and publish interactive maps.
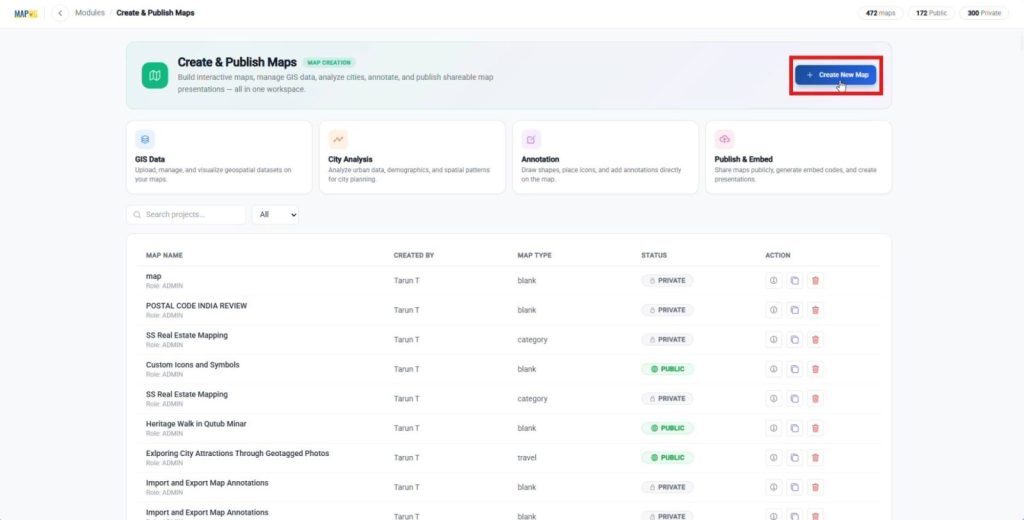
Next, click Create New Map to initiate the map creation.
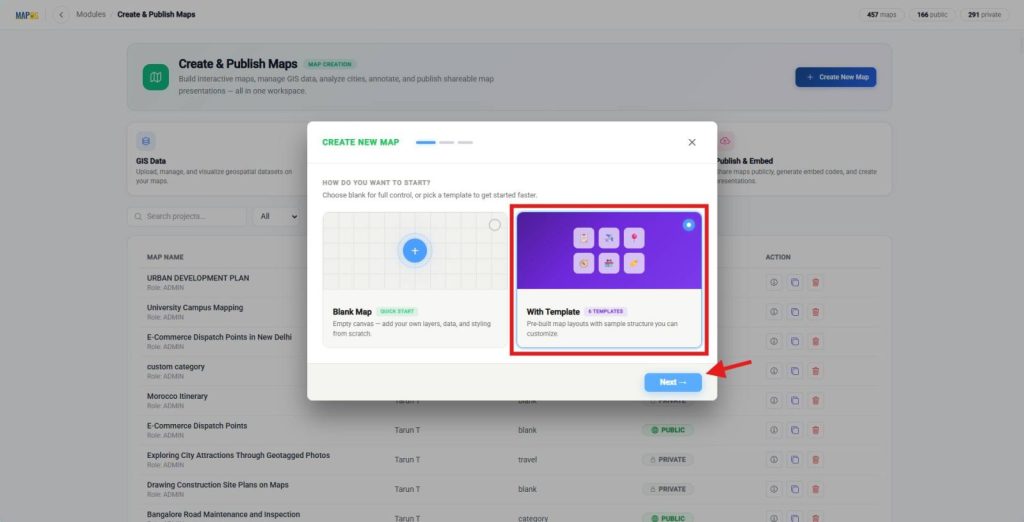
After that, select With Template and click Next.
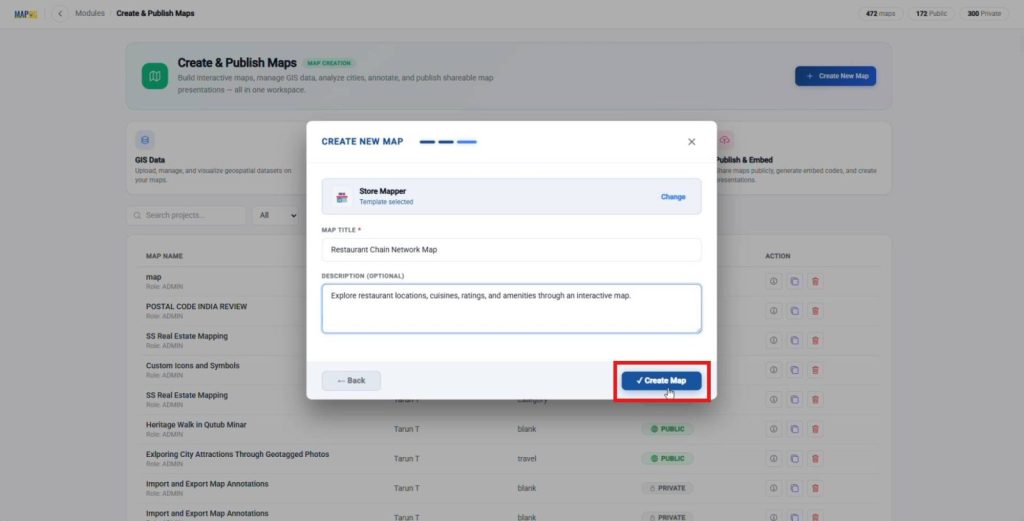
Then, select a template such as Store Mapper. Next, add a map title and description, once done, click Create Map to open the Map interface.
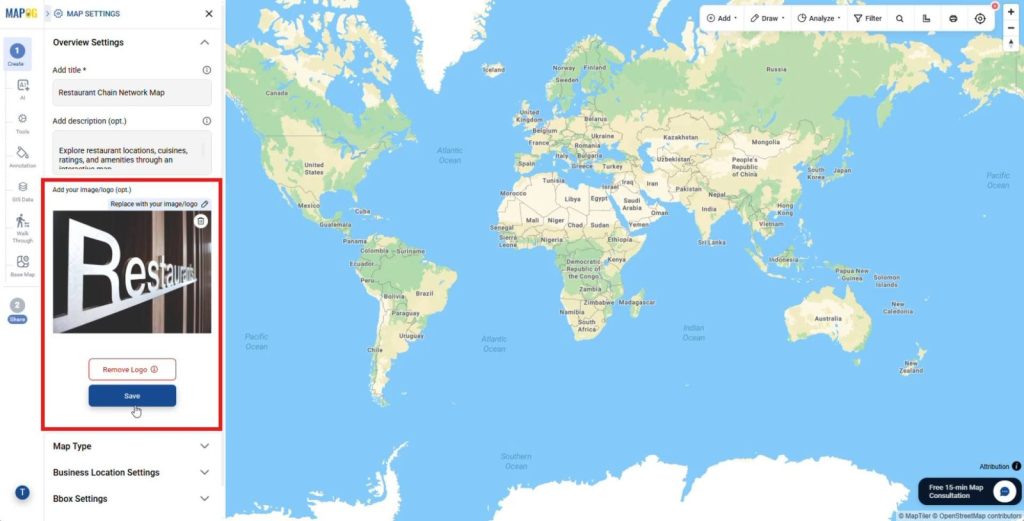
After that, upload a cover image or logo from Map Settings. This step creates a professional map layout and establishes your brand identity.
2. Create a Business Location Template
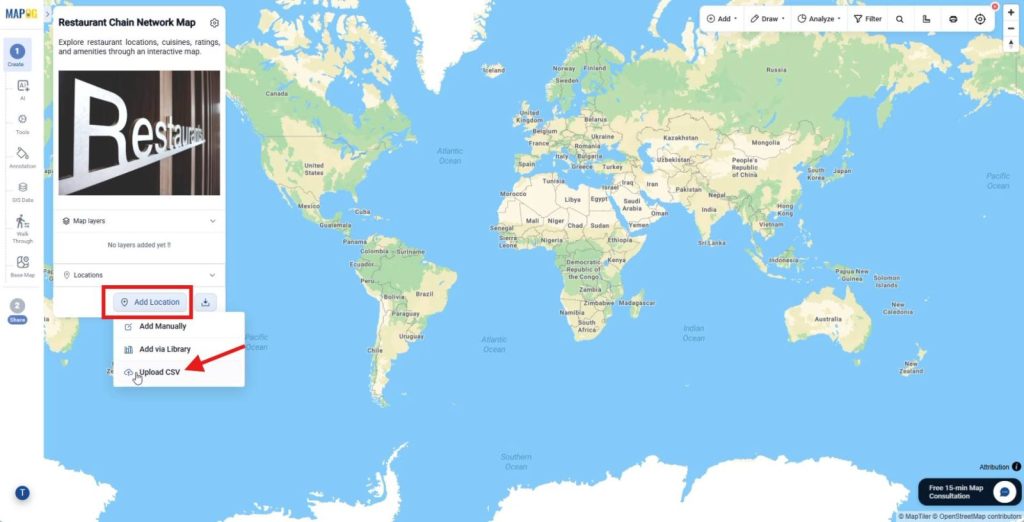
Next, click Add Location and choose Upload CSV.
Then, open Business Location Template Settings.
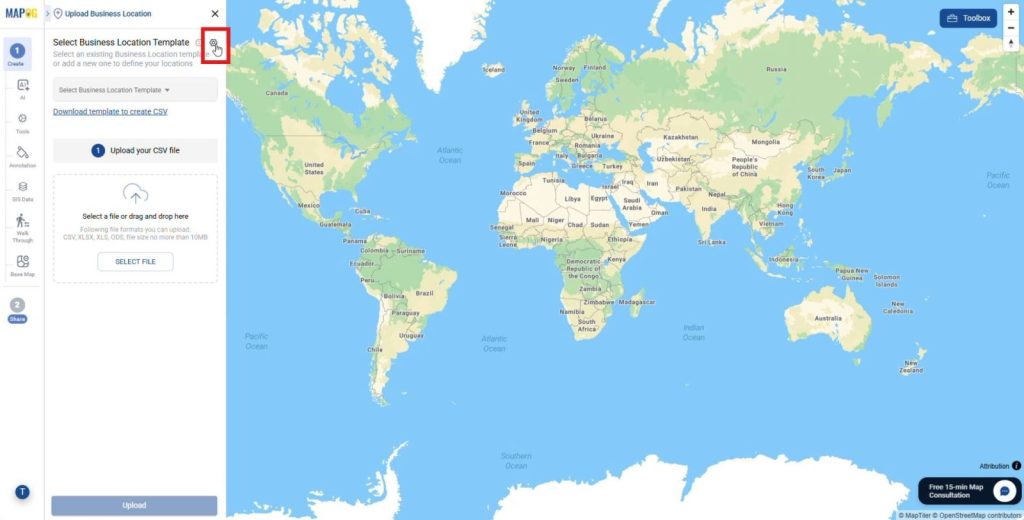
and click New Type to create a reusable business location type for consistent data organization and future uploads. Add a name, select a color, and choose Point as the geometry type.
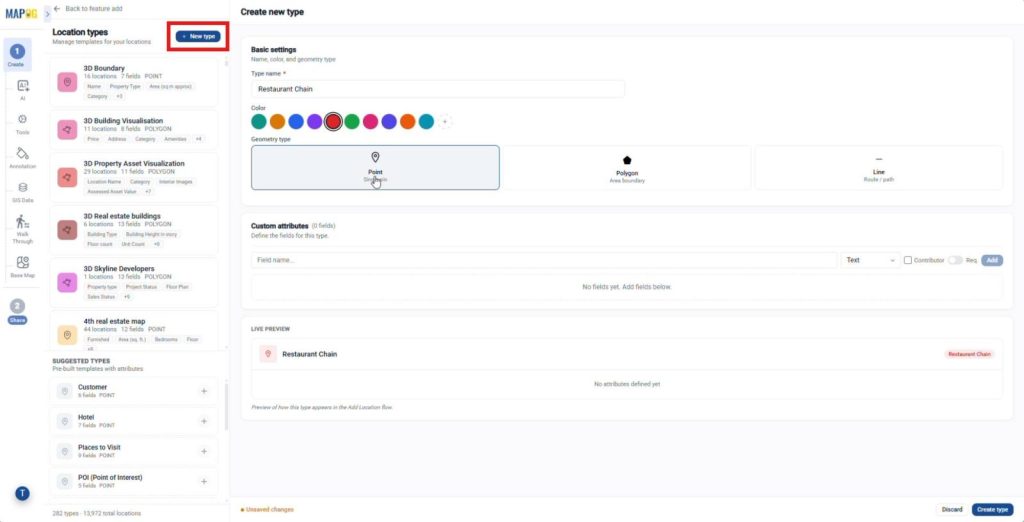
Afterward, create custom attributes and select suitable field types. For example, add Restaurant Name with the Text field type and Cuisine with the Dropdown field type. Enable for contributors if required. Finally, click Create Type to add the new location type.
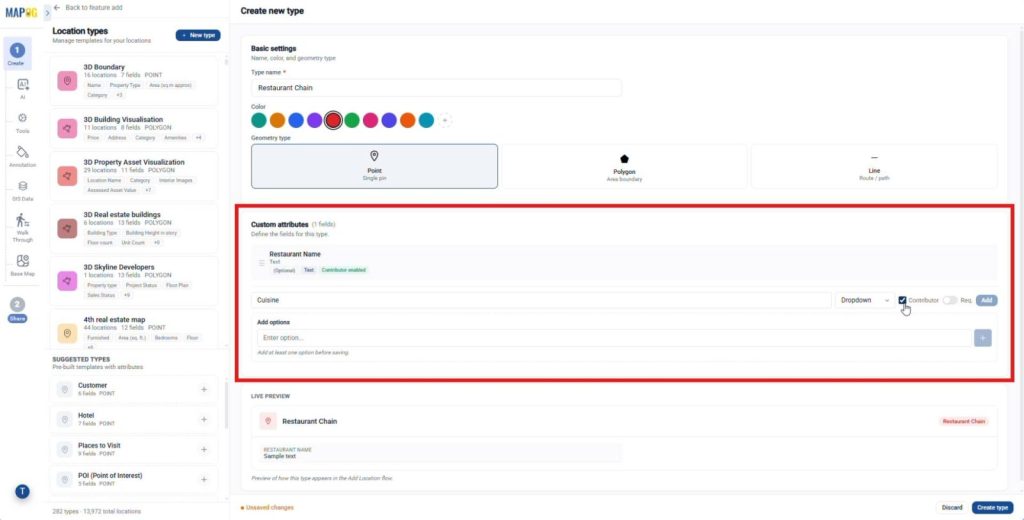
3. Upload CSV and Plot Locations
After that, select the business location template and upload your spreadsheet.
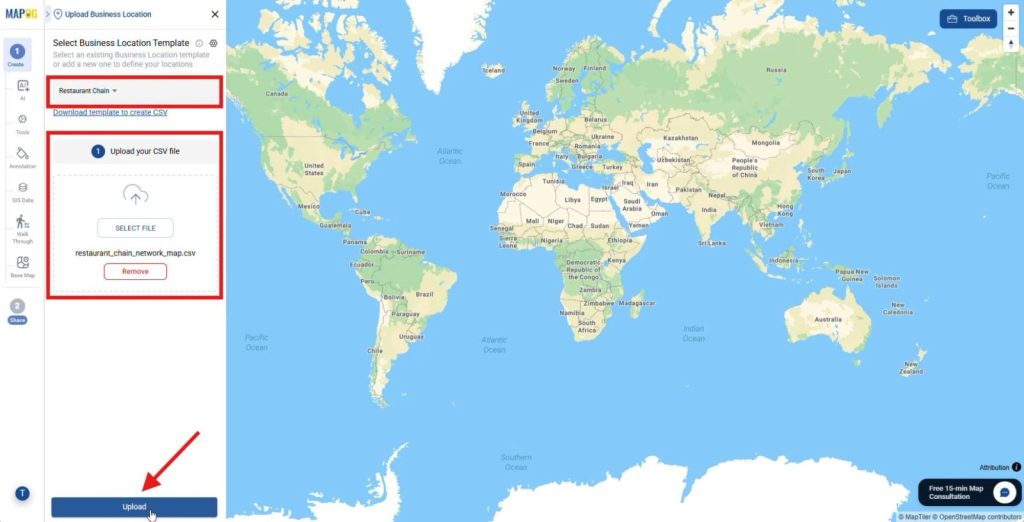
Then, select a Unique ID column or choose to auto generate a Unique ID if your spreadsheet does not include one; this helps identify each location uniquely and prevents duplicate records.
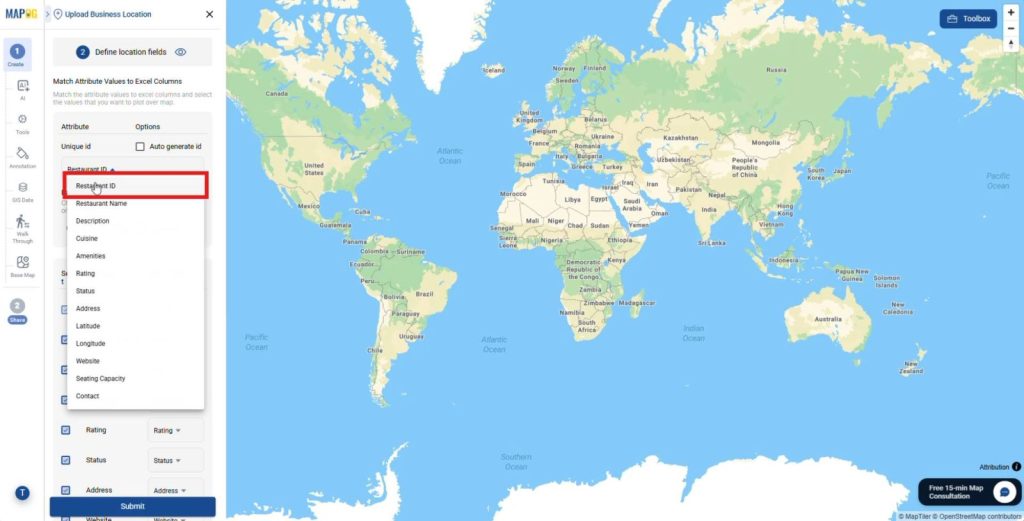
Next, match each map attribute with the corresponding Excel column. For example, connect Restaurant Name to the restaurant name column and Cuisine to the cuisine column.
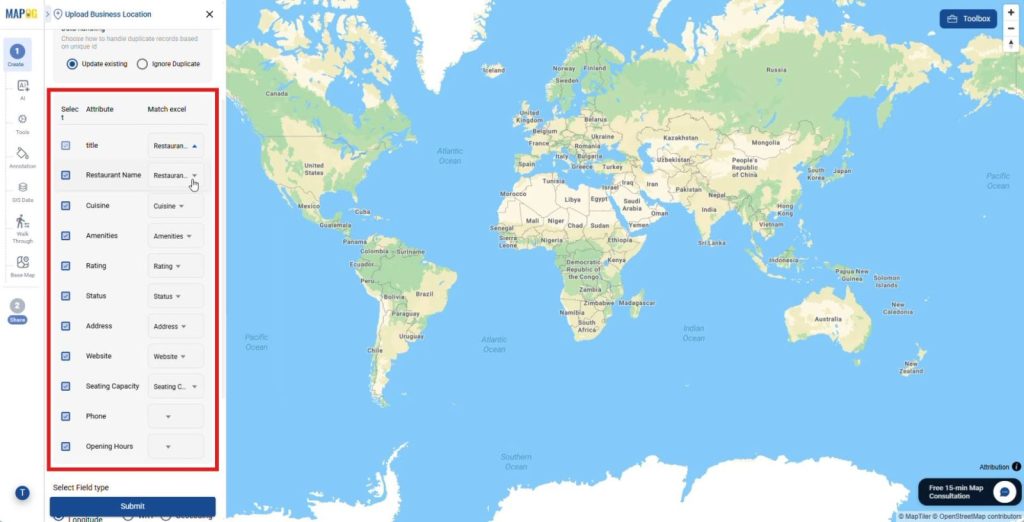
Then, assign the latitude and longitude fields to plot locations accurately on the map. Finally, click Submit. The platform instantly plots all locations on the map and removes manual pin placement.
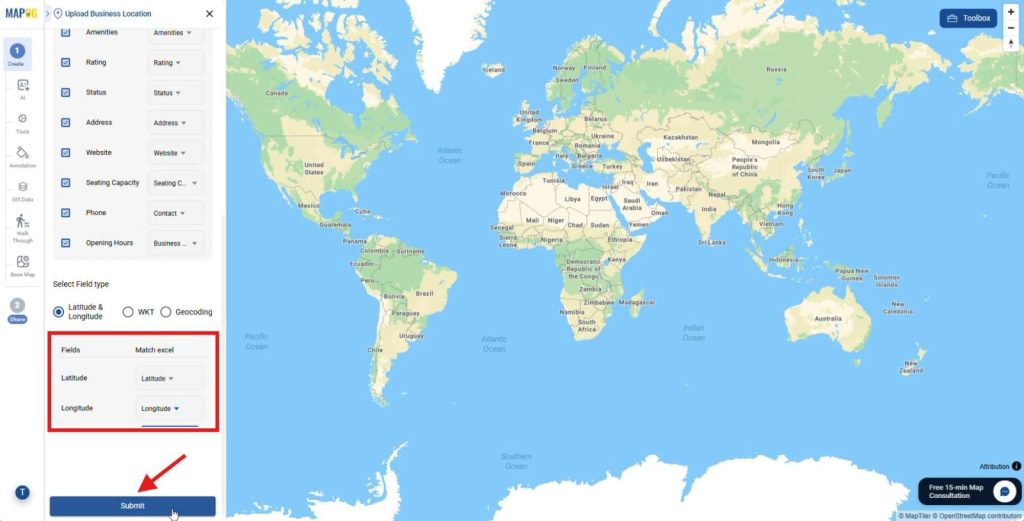
4. Edit Business Location Details
Next, click the Pencil icon beside any location and open Edit Business Location Details.
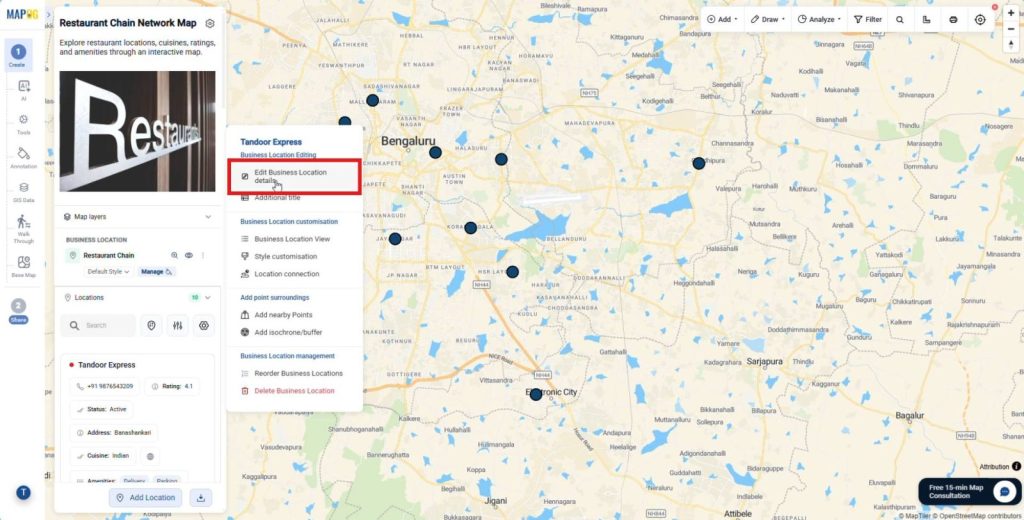
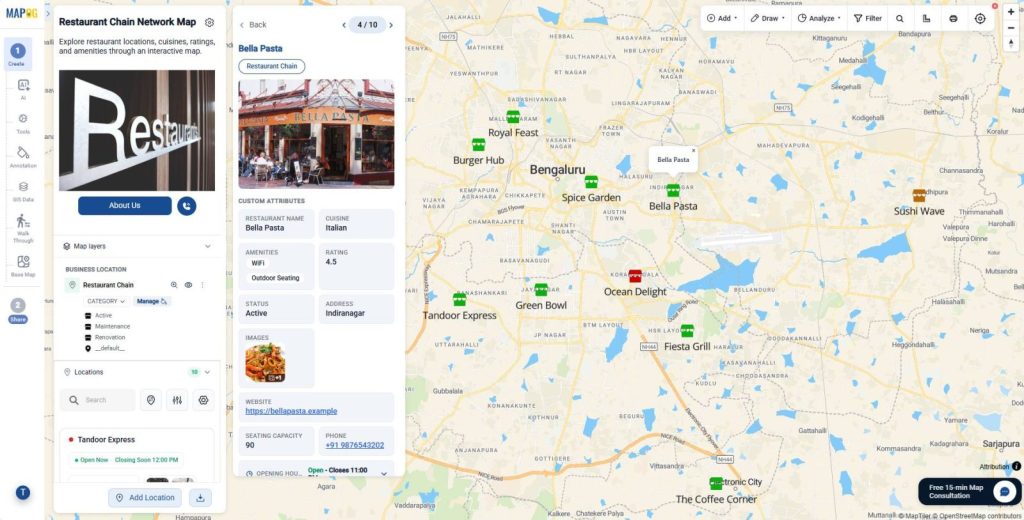
Then, add descriptions, opening hours, and photos, and save the changes. These details help users understand locations quickly.
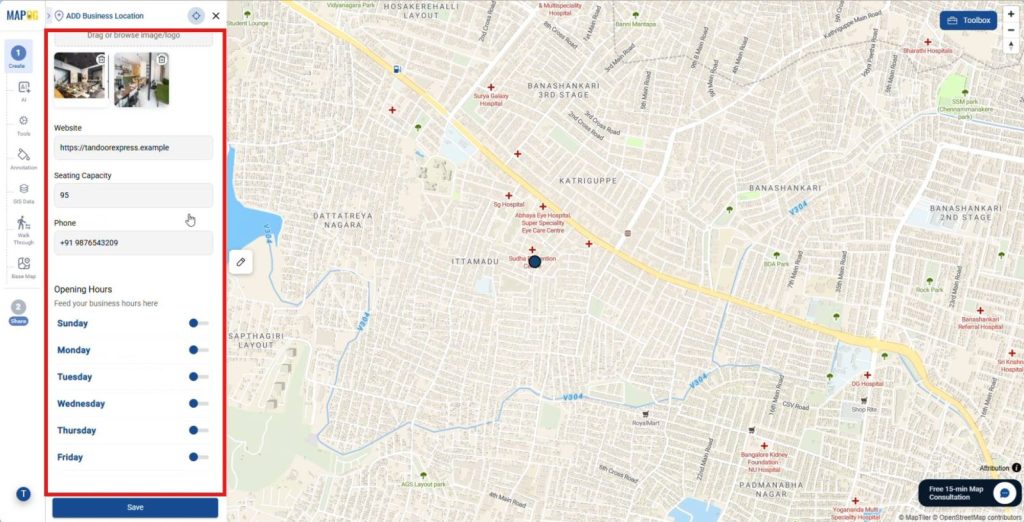
5. Apply Layer Styles
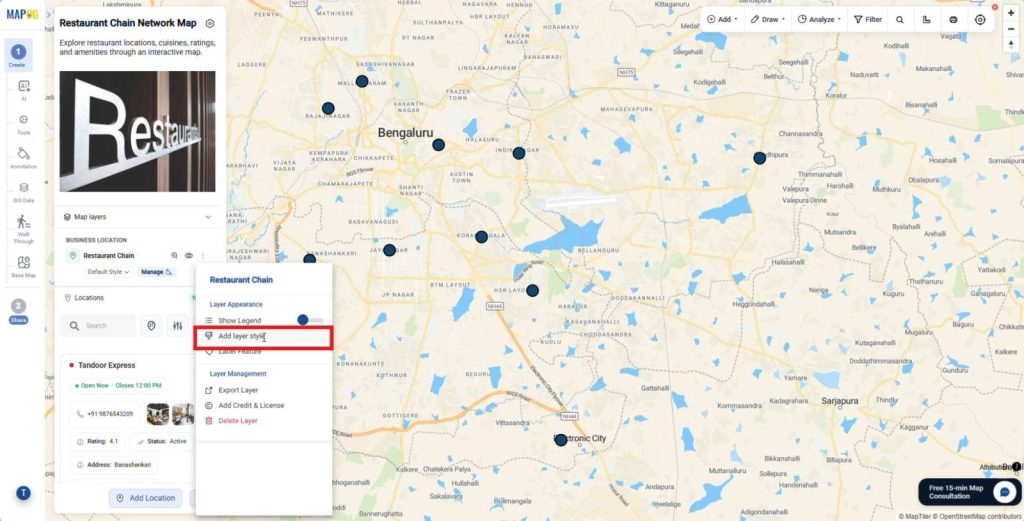
Afterward, click the Three Dots beside the map layer and select Add Layer Style.
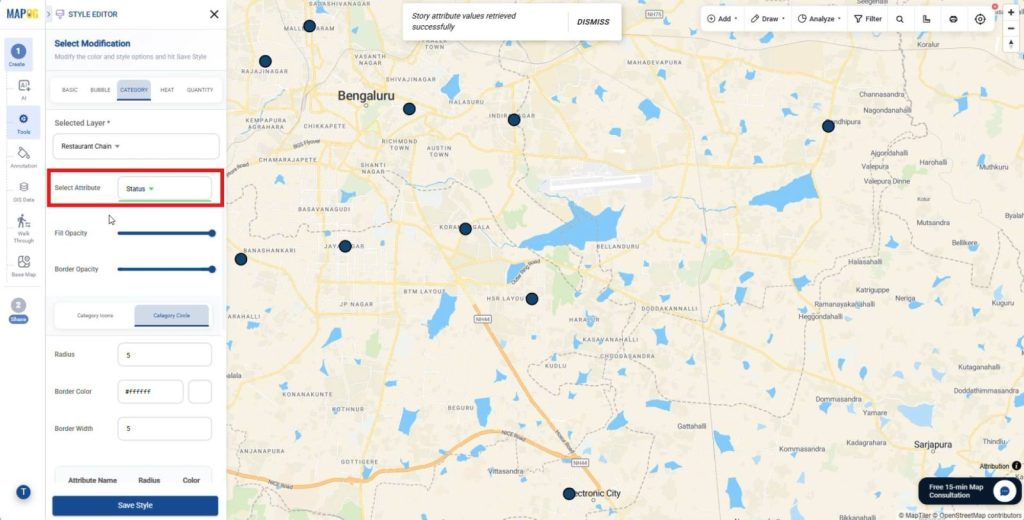
Choose Category, select an attribute such as Cuisine or Status,
and from the category icons assign icons and distinct colors to each category.
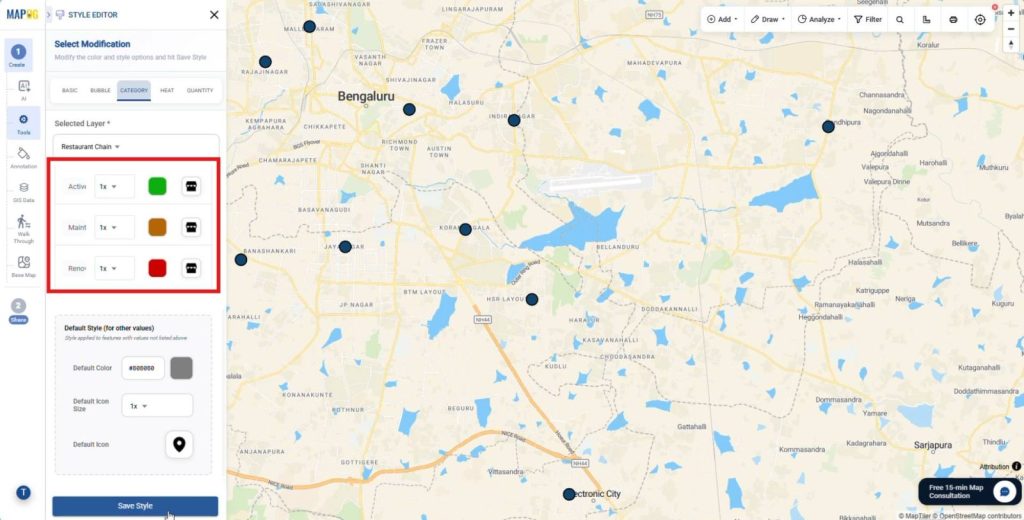
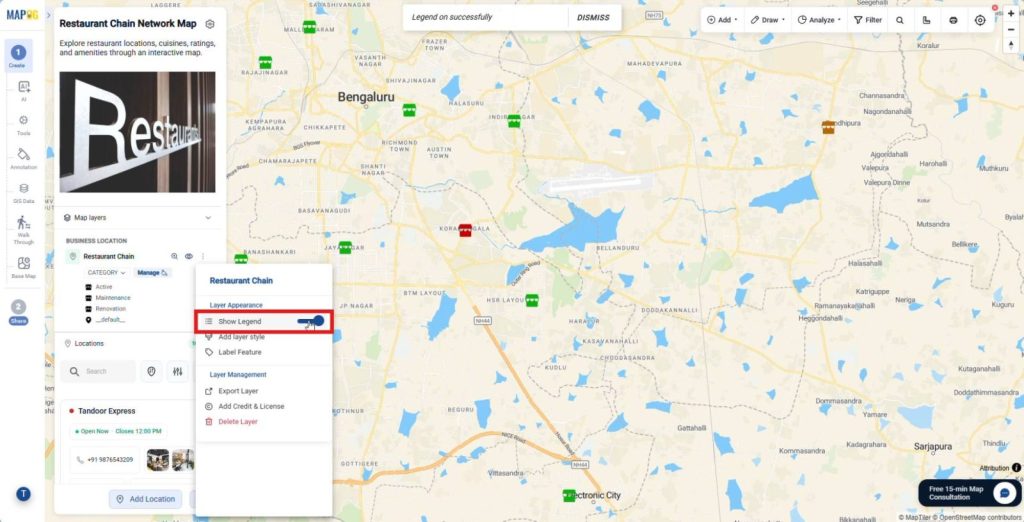
Then, save the style and enable Show Legends. This styling improves map readability and helps users identify categories easily.
6. Configure Labels and Display Fields
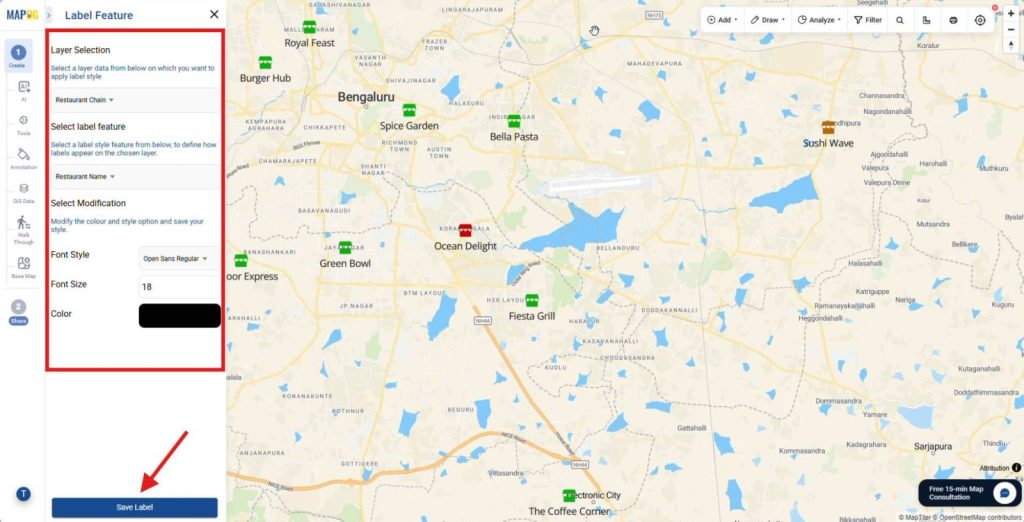
Next, open Label Feature and select an attribute such as Restaurant Name. Then, customize the font style, size, and color.
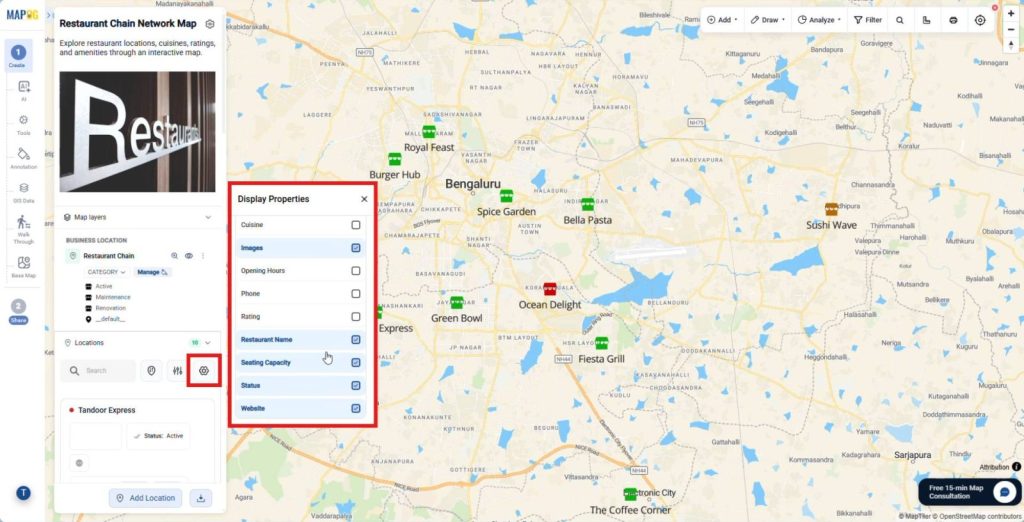
After that, open Display Properties and choose the fields to display beside each location. These settings improve map clarity and highlight important information.
7. Filter and Sort Locations
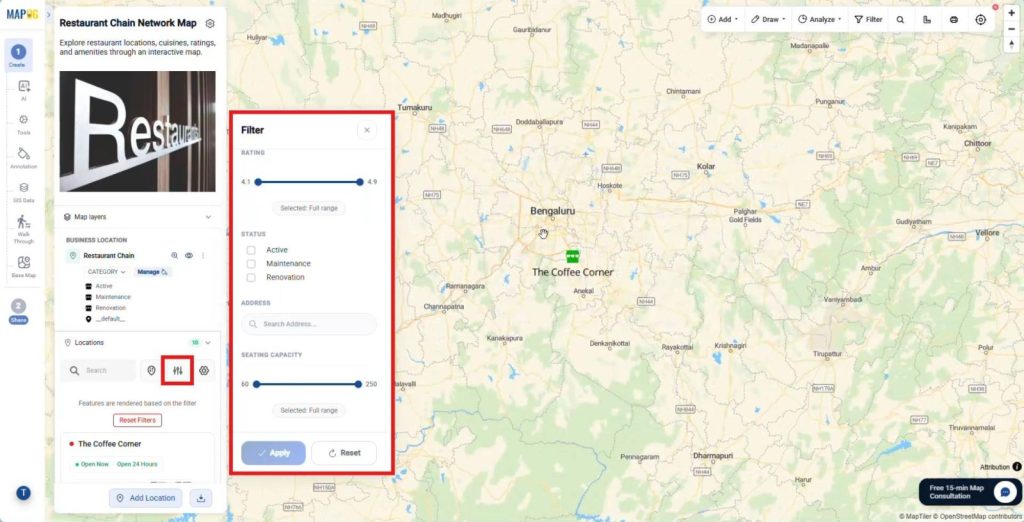
Now, click the Filter button and filter locations by cuisine, amenities, rating, or seating capacity.
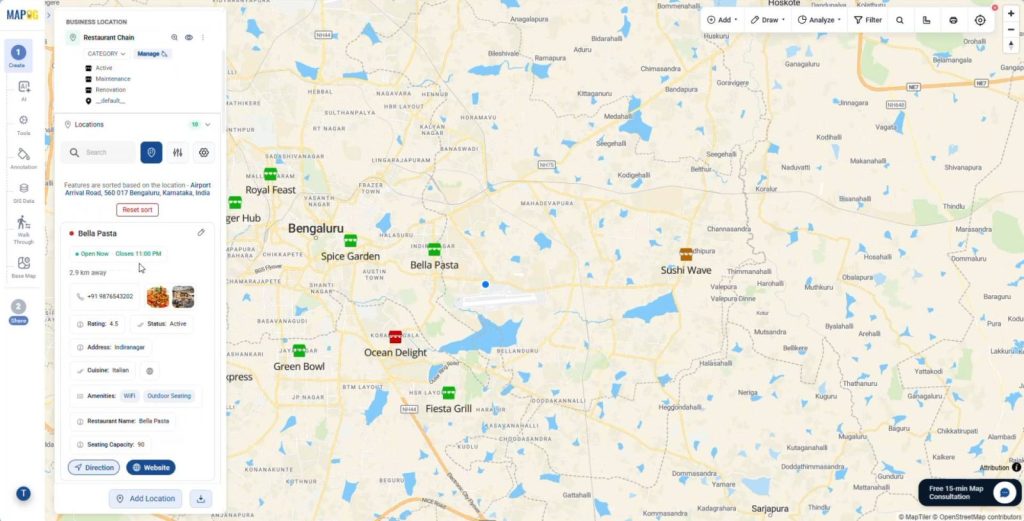
Then, sort locations by Live Location or search by place name. These tools help users discover relevant locations faster.
8. Add Action Buttons and Publish
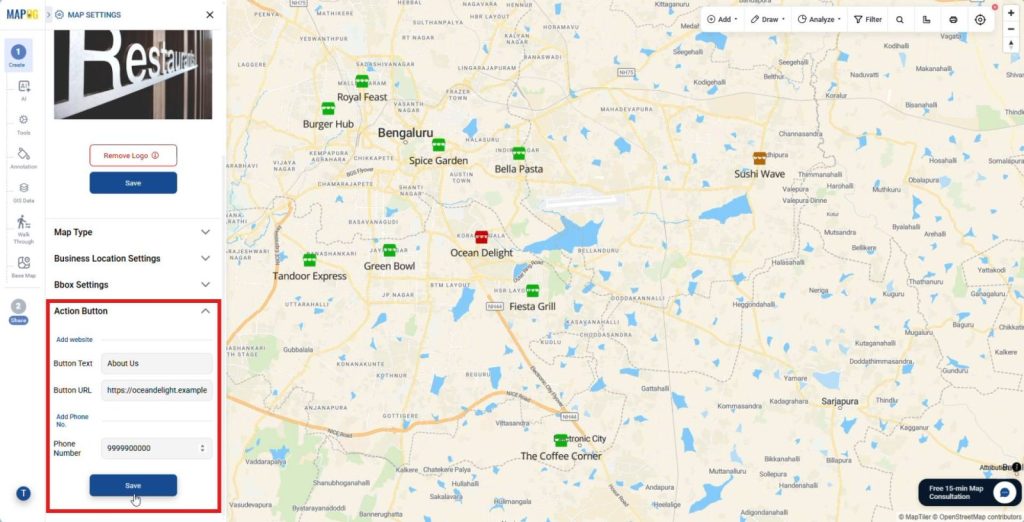
Open Map Settings and add website links and phone numbers from the Action Button section.
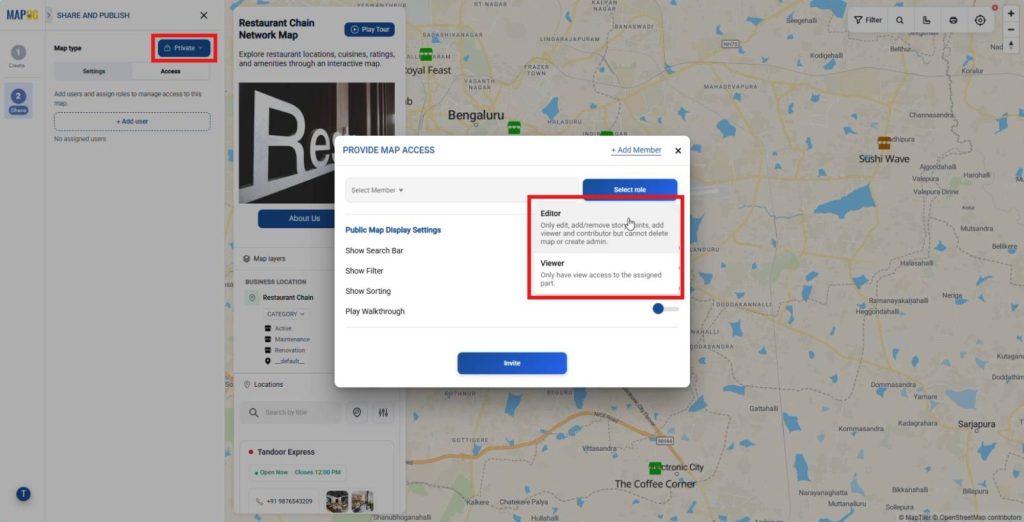
Finally, go to the Share and Publish section, share it privately by adding users and assigning roles like viewer or editor,
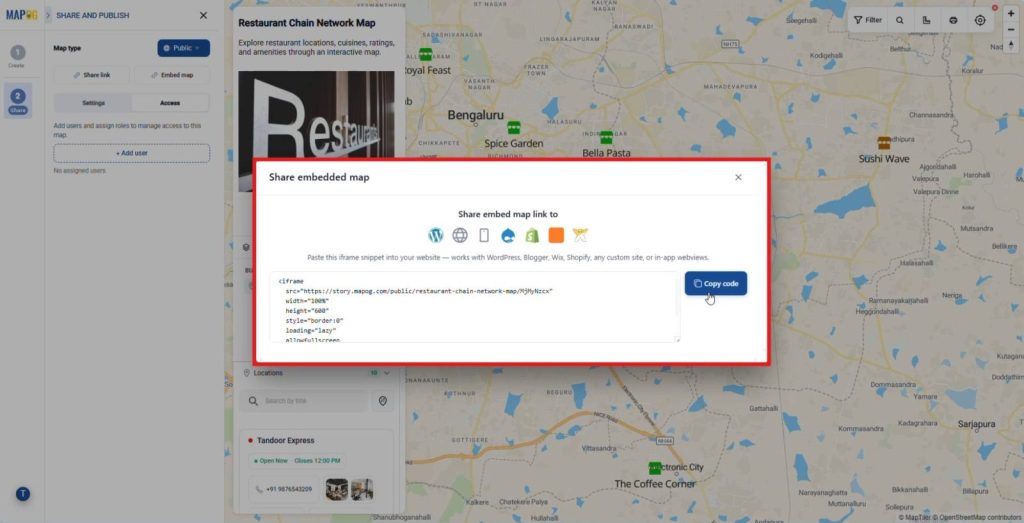
or make it public and share it through a link or embed option, which turns your map into a fully usable output.
Industries and Domains Benefiting
Several industries use interactive mapping to improve efficiency. Logistics teams map routes and hubs to reduce delays. Retail and real estate businesses visualize stores and customer activity to identify growth opportunities. Meanwhile, municipal teams map infrastructure and utilities to plan maintenance and allocate resources effectively.
Conclusion
Transitioning from spreadsheets to web maps no longer requires complex tools. You can easily Convert Offline Data into Interactive Online Maps and share insights across teams. Moreover, MAPOG lets users upload CSV or Excel files to create interactive maps quickly. Ultimately, you transform offline records into powerful spatial assets for smarter decisions.