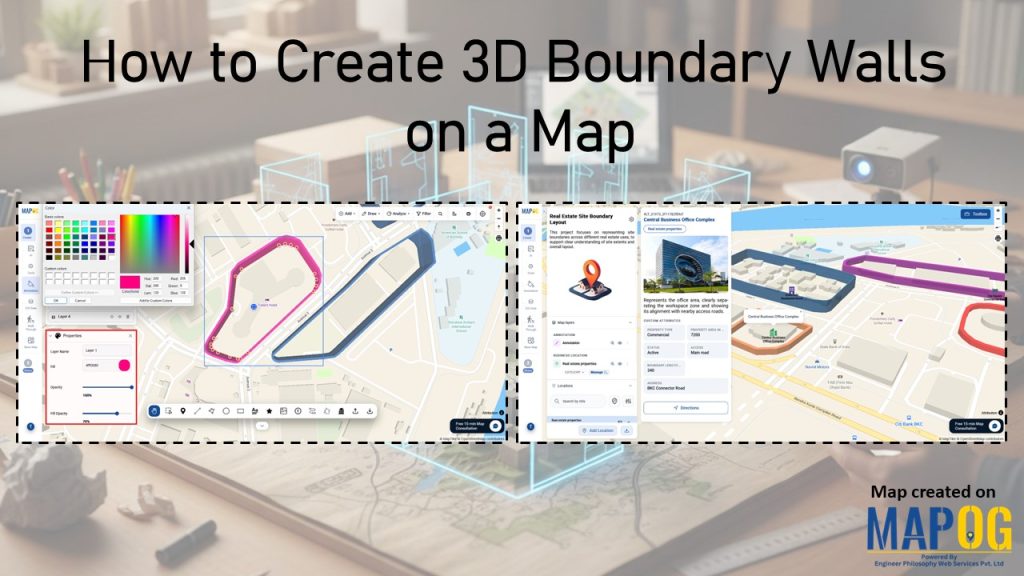
Boundaries define property ownership, yet flat outlines often blur together on maps. As projects expand, questions arise: where does one site end and another begin, and how can layouts remain clear when residential, commercial, and industrial plots overlap? In real estate, these issues weaken planning and presentations. MAPOG addresses this challenge with its easy‑to‑use, non‑technical GIS process, making it possible to create 3D Boundary Walls that turn property outlines into clear, elevated boundaries for practical, presentation-ready maps.
Key concept: Why It Matters to Create 3D Boundary Walls
Maps influence decisions, negotiations, and trust in real estate projects. When boundaries remain flat, they fail to convey depth, scale, and separation. By adding height, the experience changes as walls become physical markers that audiences instantly recognize, making ownership and layout distinctions obvious. As a result, this clarity strengthens communication, accelerates approvals, and ensures property presentations feel professional and persuasive. In practice, 3D walls transform maps into tools that not only show space but also communicate it convincingly.
Steps to create 3D boundary walls on a map
1. Create Your Map
To begin, head to MAPOG and open the Create and Publish Map section.
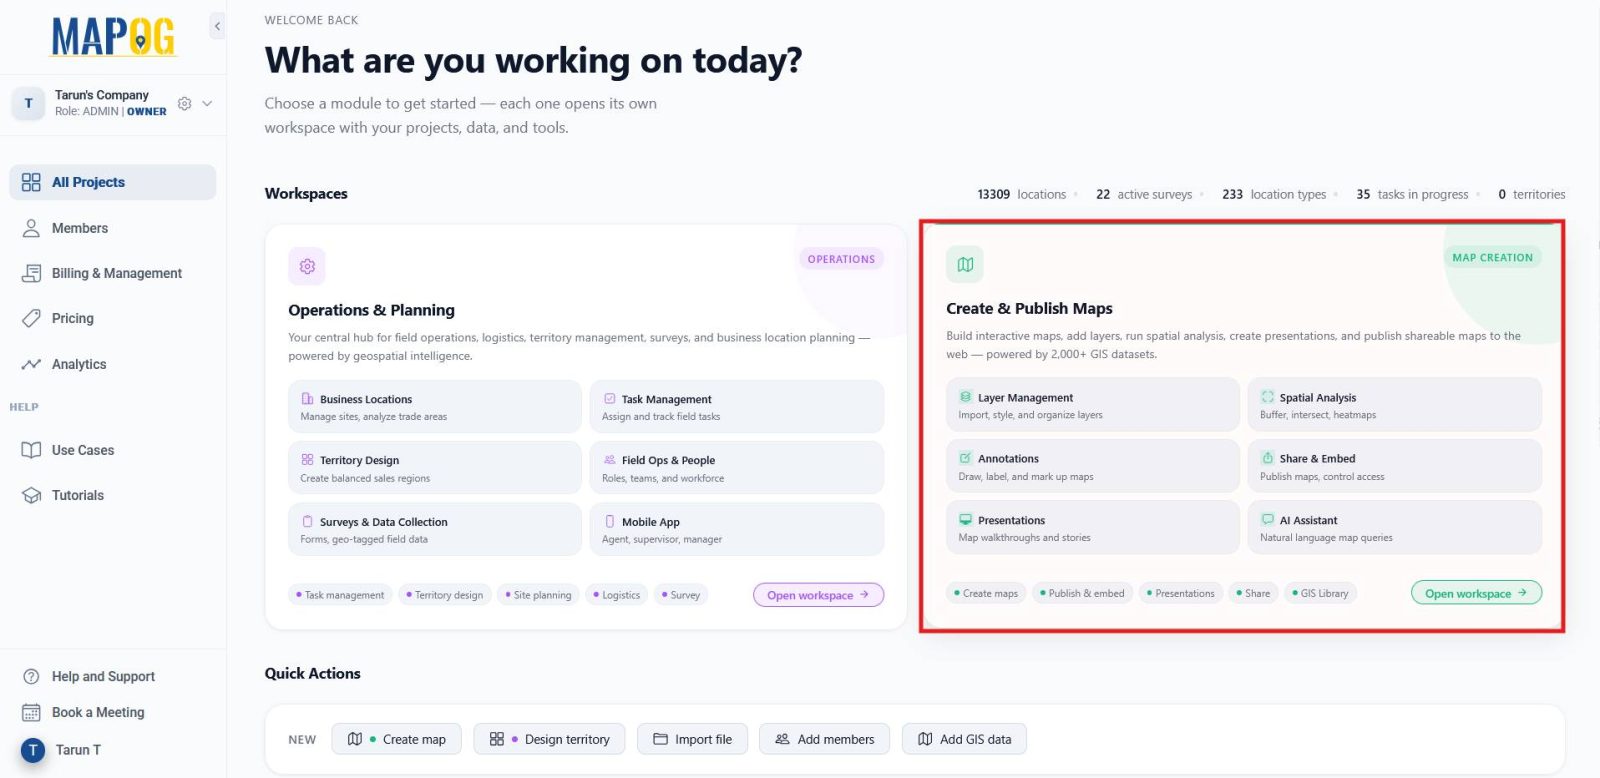
Click Create New Map, then move into the Template section
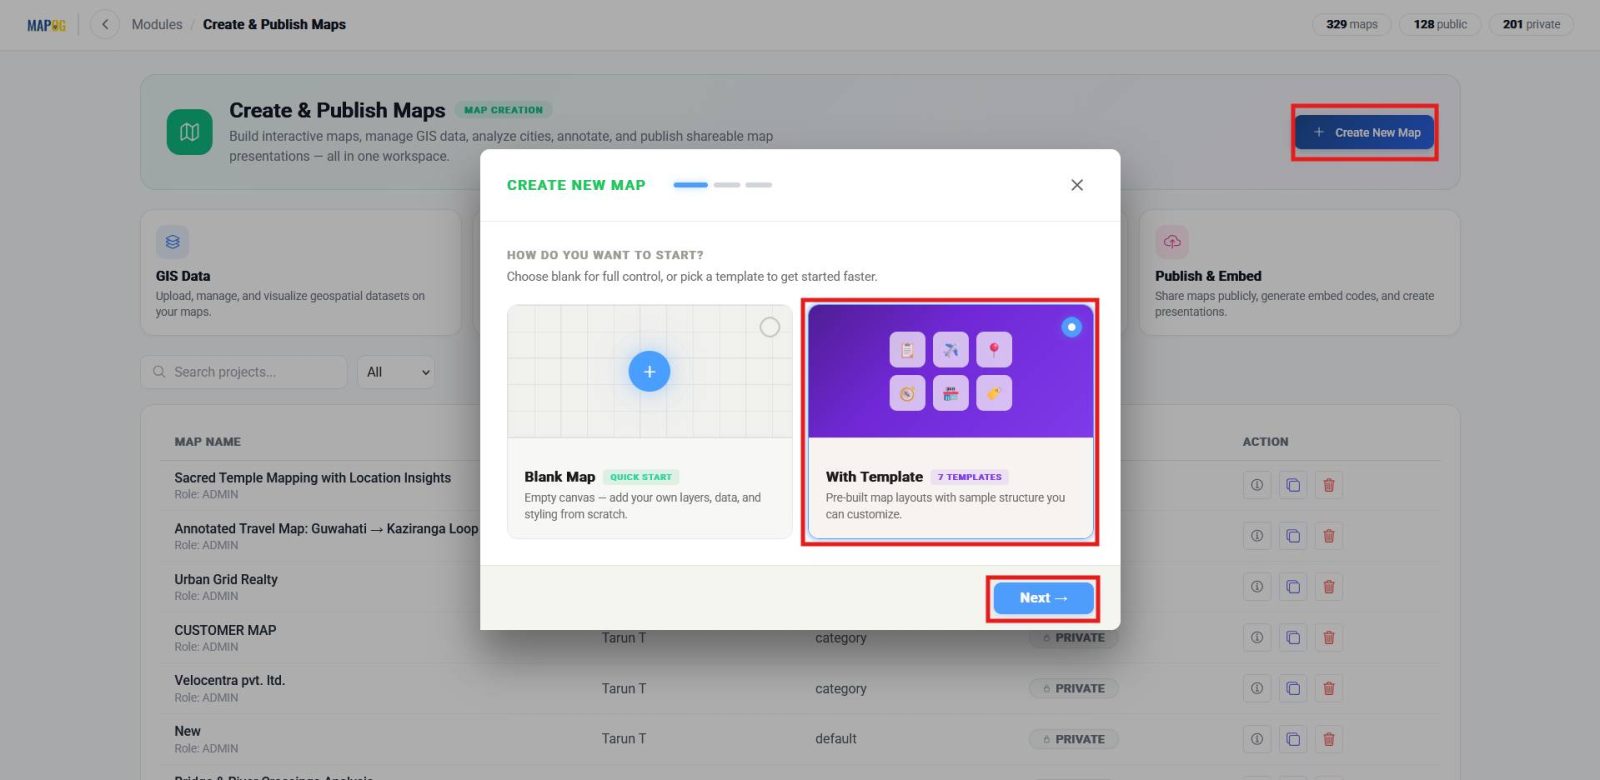
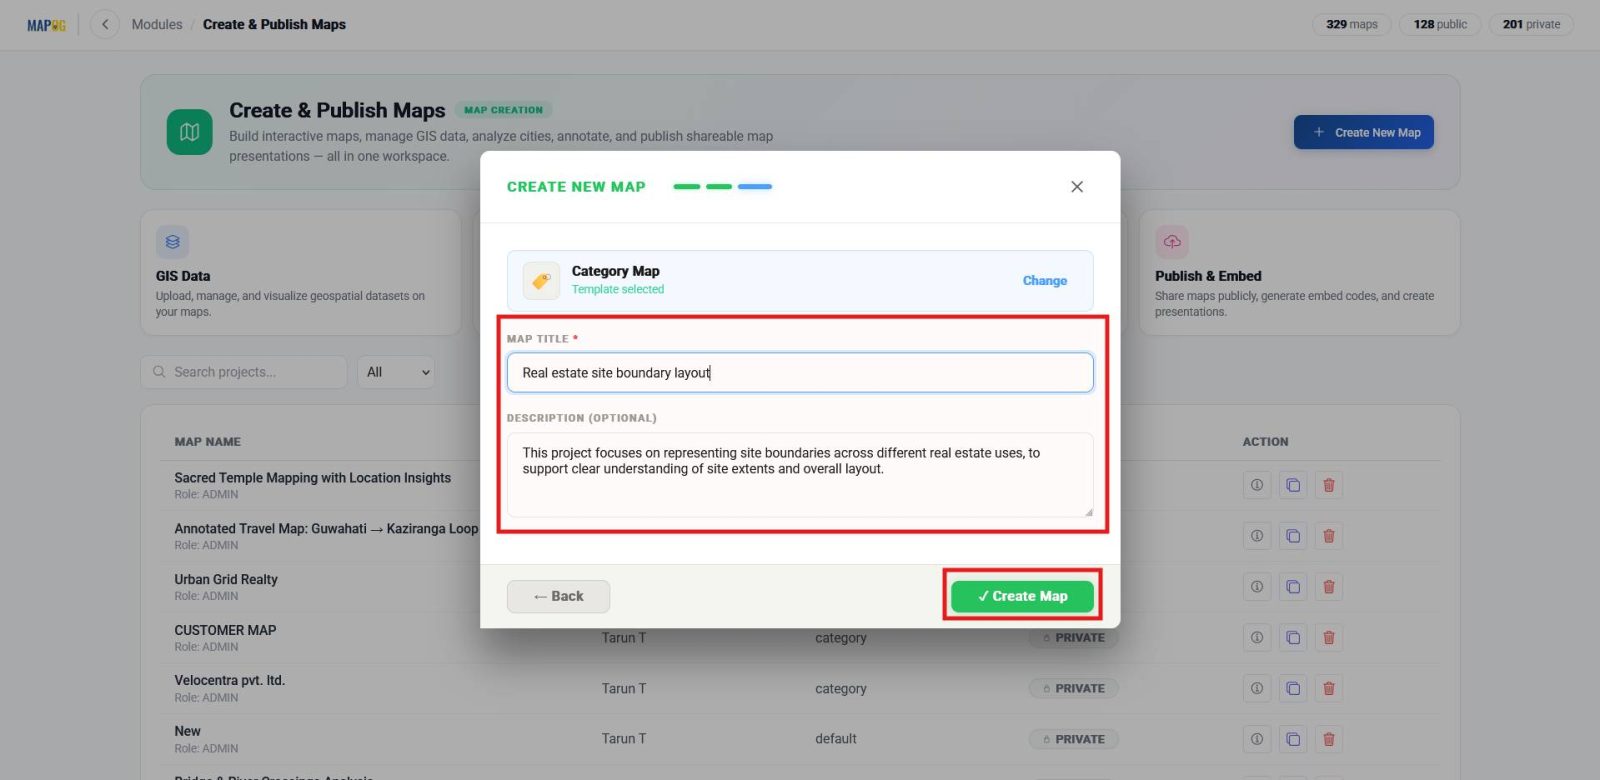
and choose Category Template. Add a title and description, and finally click Create Map. By doing this, you establish a structured base where all boundaries and property details can be organized for clarity and reuse.
2. Trace the 3D Boundary
Next, go to the Annotation section. In the toolbox, use the Search Tool to find your property by name or latitude/longitude.
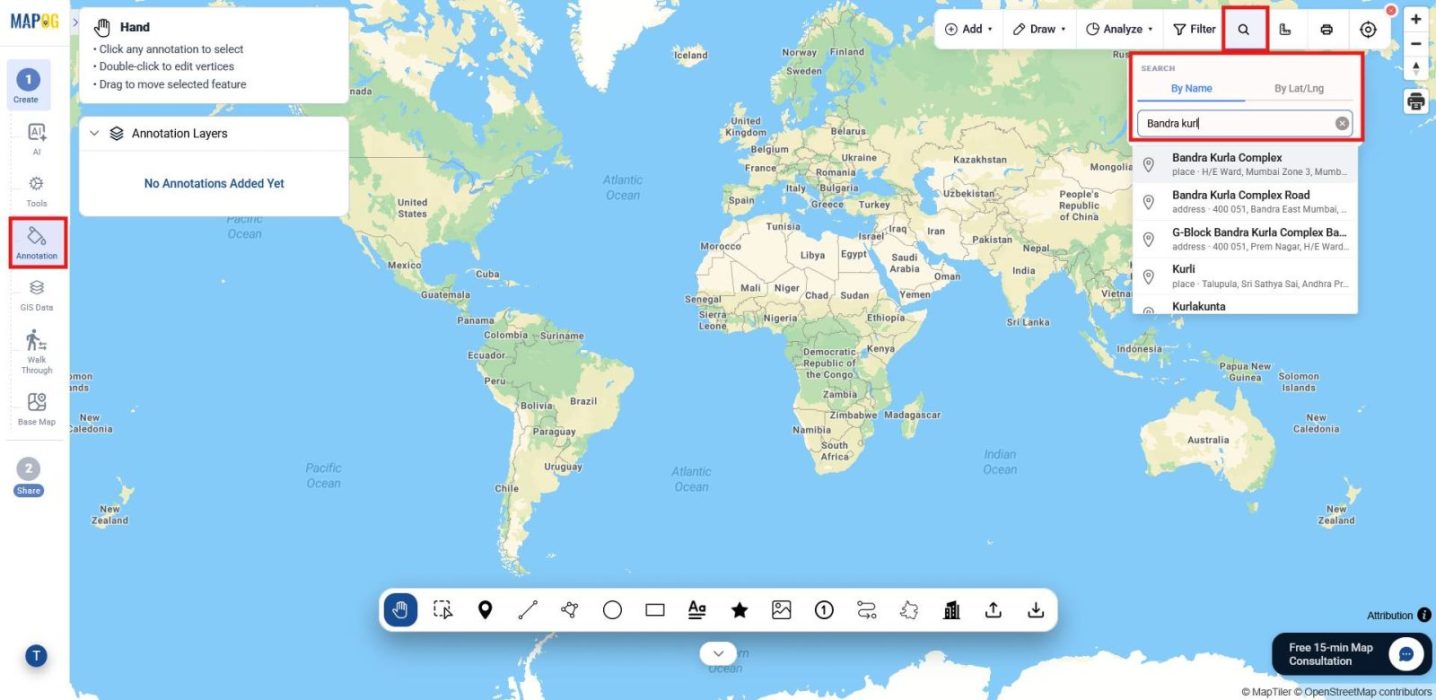
Once the location appears, select the 3D Boundary Tool and trace the outline with the freehand feature. Double‑click the last point to generate the wall,
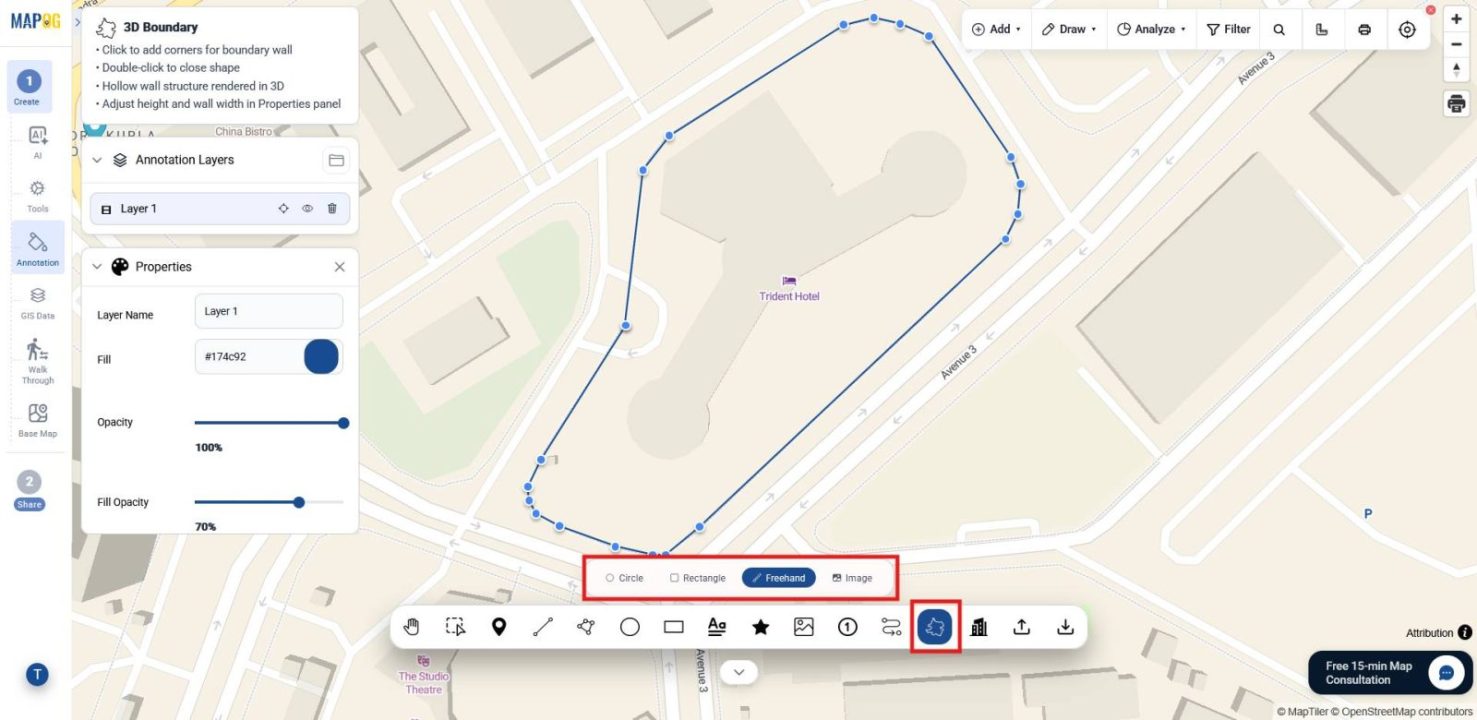
then refine it by adjusting color, opacity, transparency, height, width, and base. This step transforms flat outlines into visible 3D markers, making ownership and layout distinctions clear and visually persuasive.
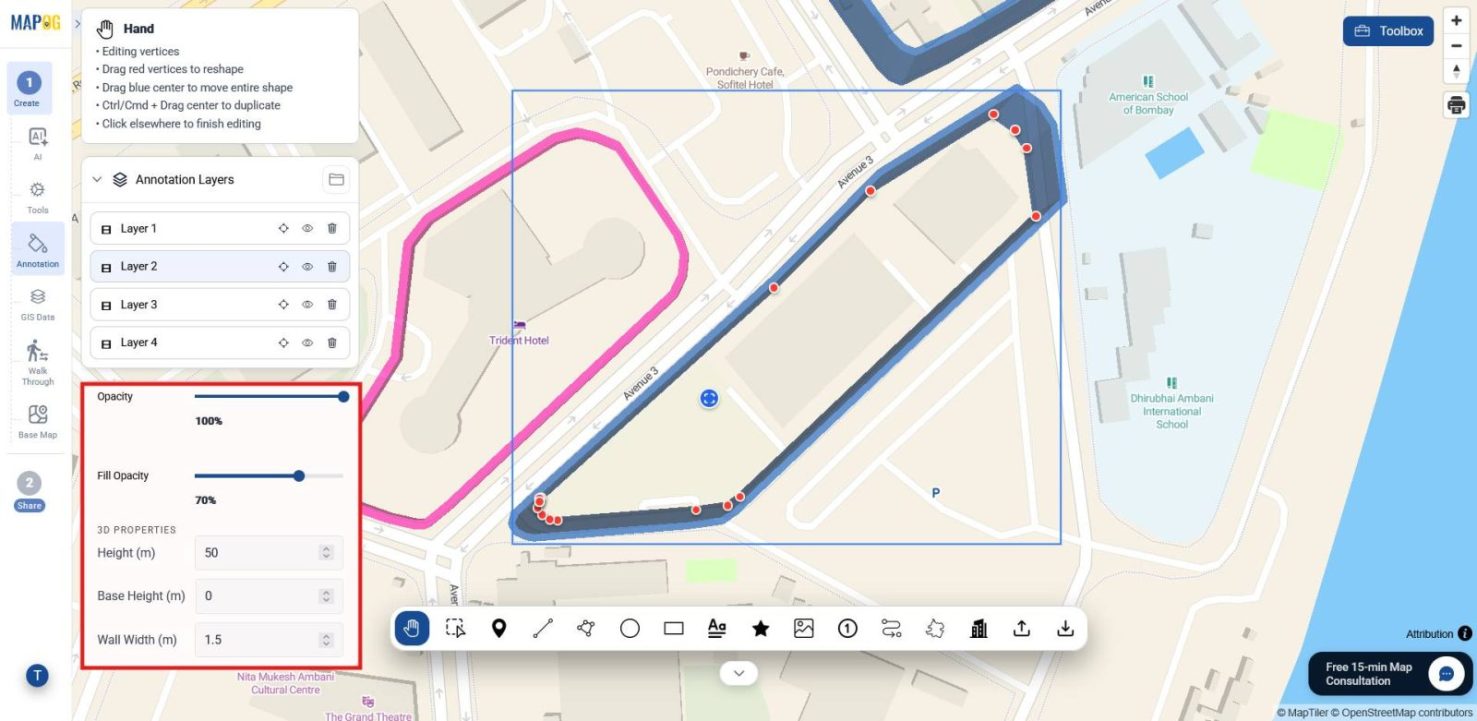
3. Define Property Location and Attributes
Afterward, move to the Dashboard and open the Business Location section under Operation & Planning.
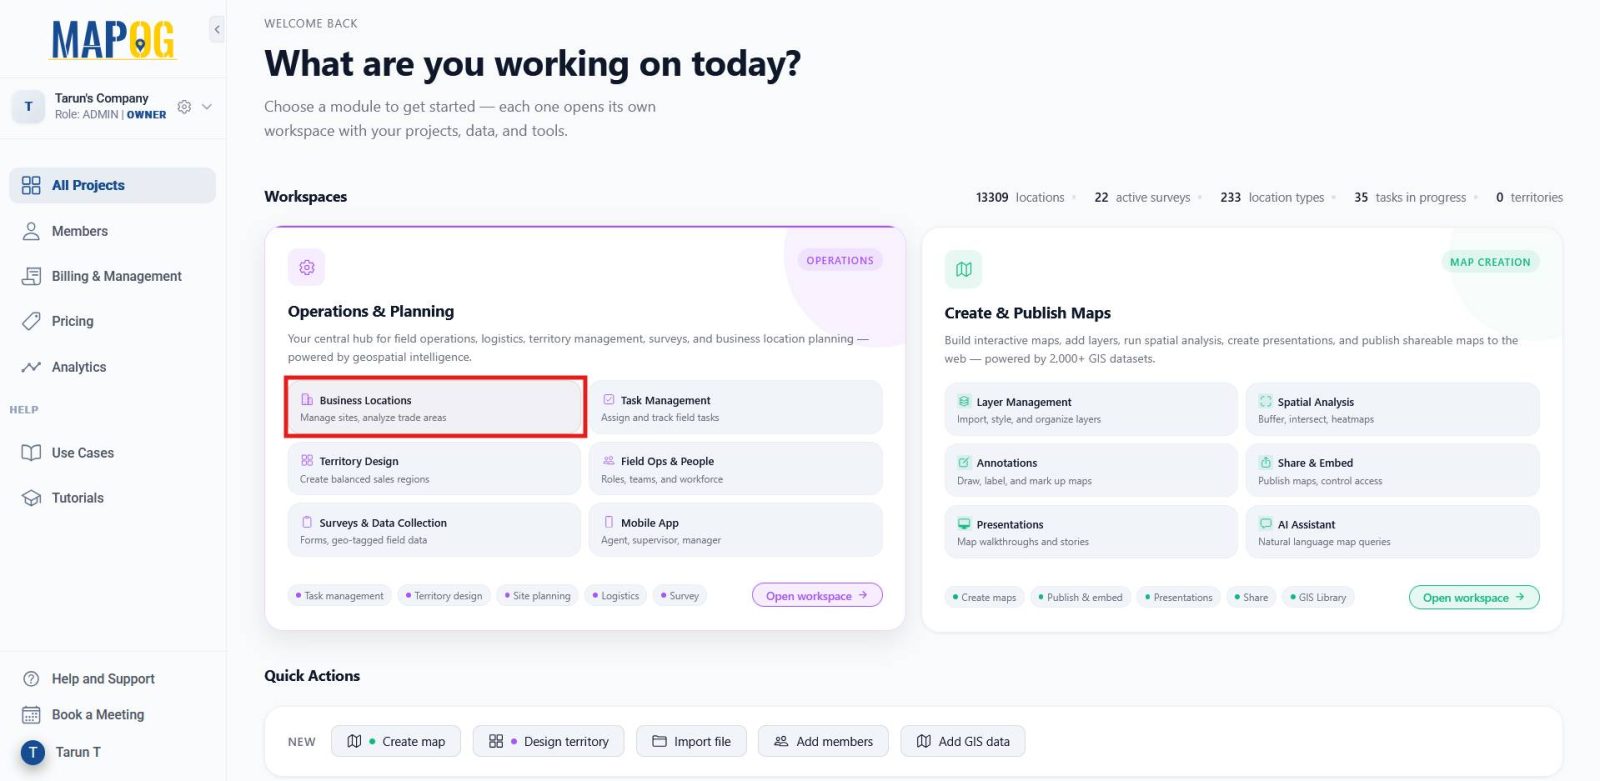
Under Locations, click Add and then create a new location type.
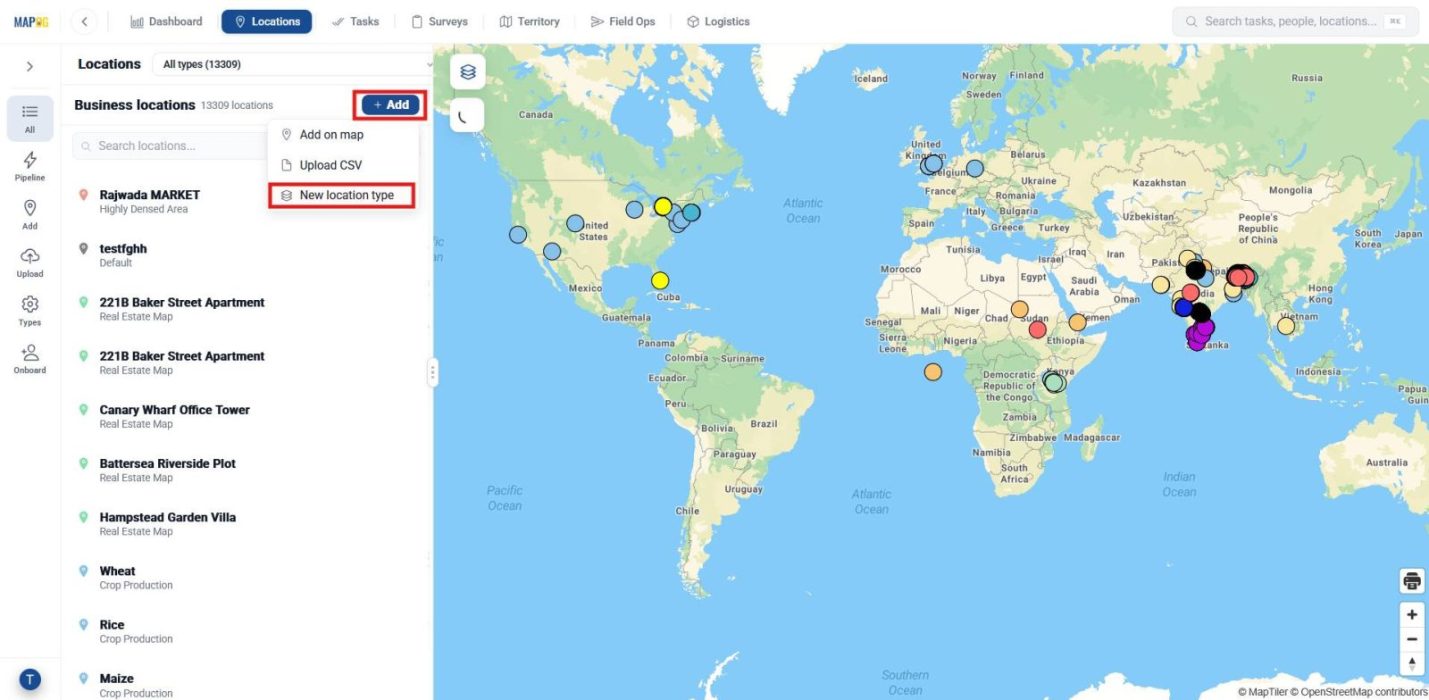
Assign a title, set a color, choose geometry type as Point, and add attributes such as property type with dropdown options (residential, commercial, industrial) and click add to add your attributes in the template. Click Create Type to save and the template becomes reusable for other similar projects.
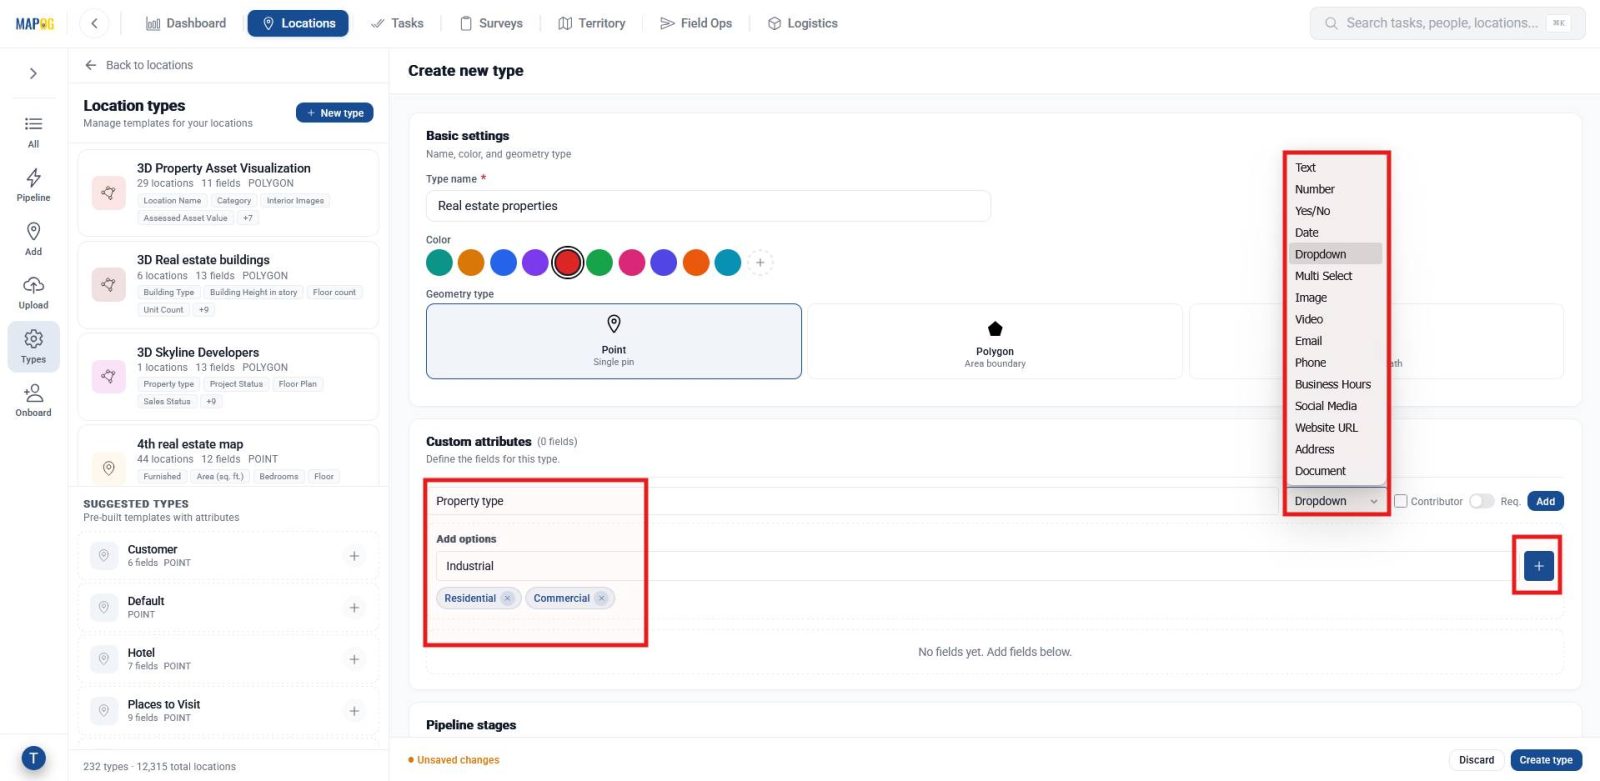
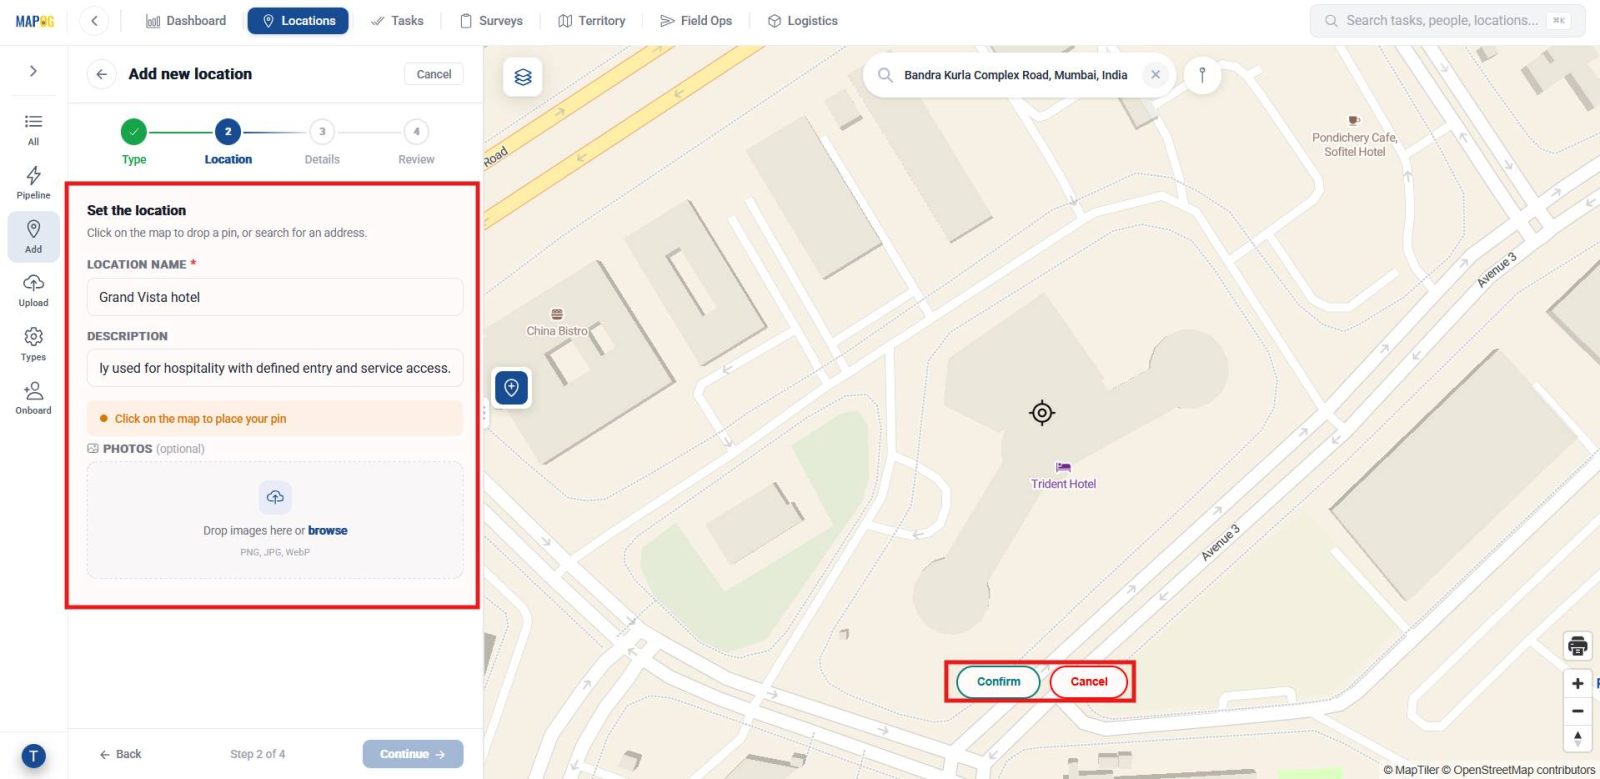
Then, return to Locations and choose Add on Map. Search for your template, then search for your location. Plot a point, name it, add a description and photos,
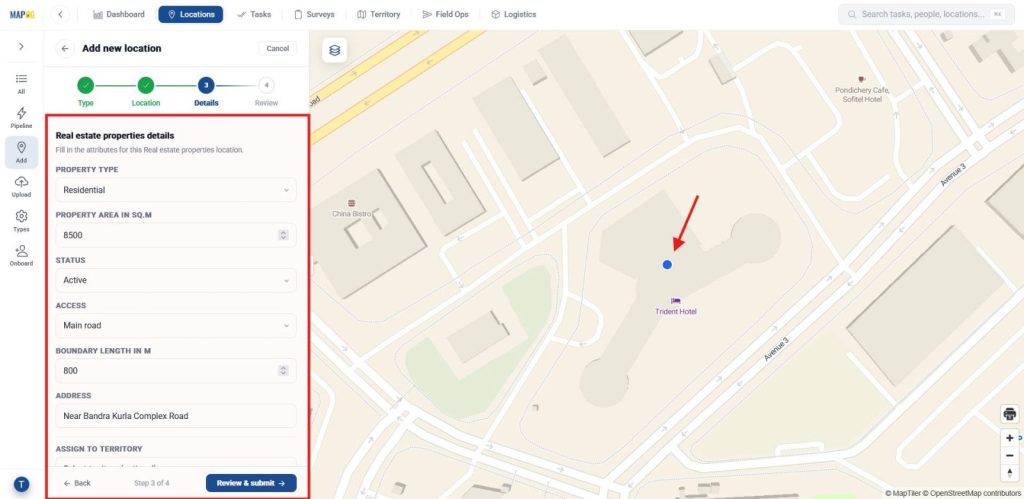
and fill in attribute details. Click review and Submit. This helps link each boundary to its respective property, making the 3D walls easier to understand in context.
4. Display Locations on the Map
Once your details are defined, open your map in the Dashboard. Click Add Custom Location, then Add via Library, and search for your template.
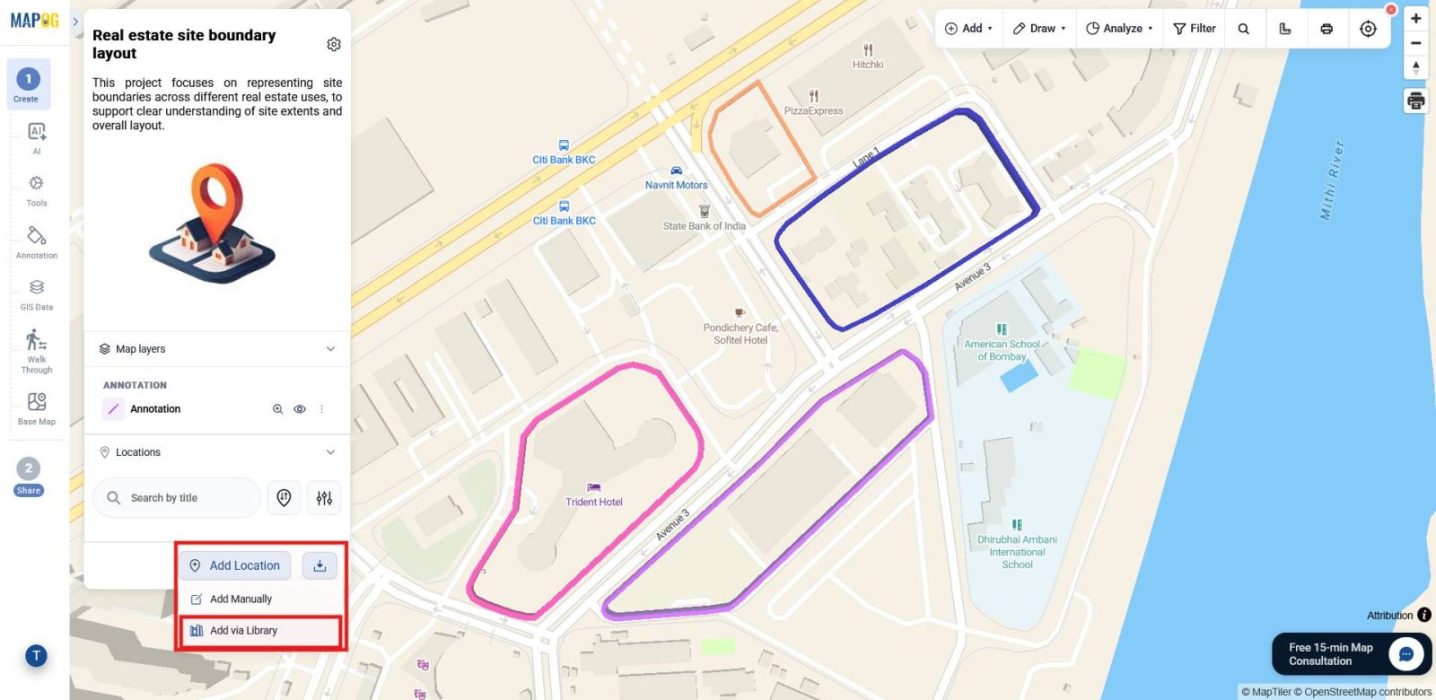
Select the business locations you want to showcase, then click Add Business Location. This allows the plotted locations to appear within the boundaries, giving a clearer view of how each site is organized.
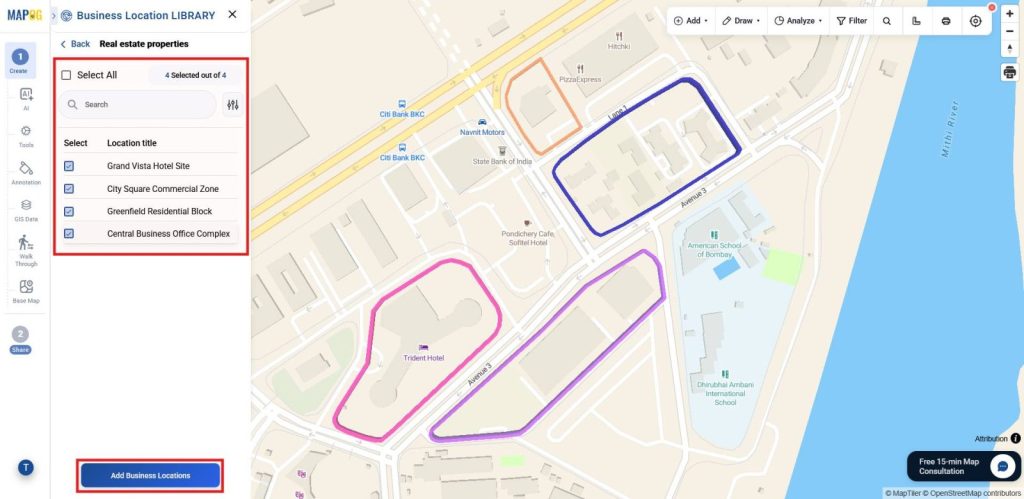
5. Edit and Adjust Views
If updates are needed, click the pencil icon to edit property details.
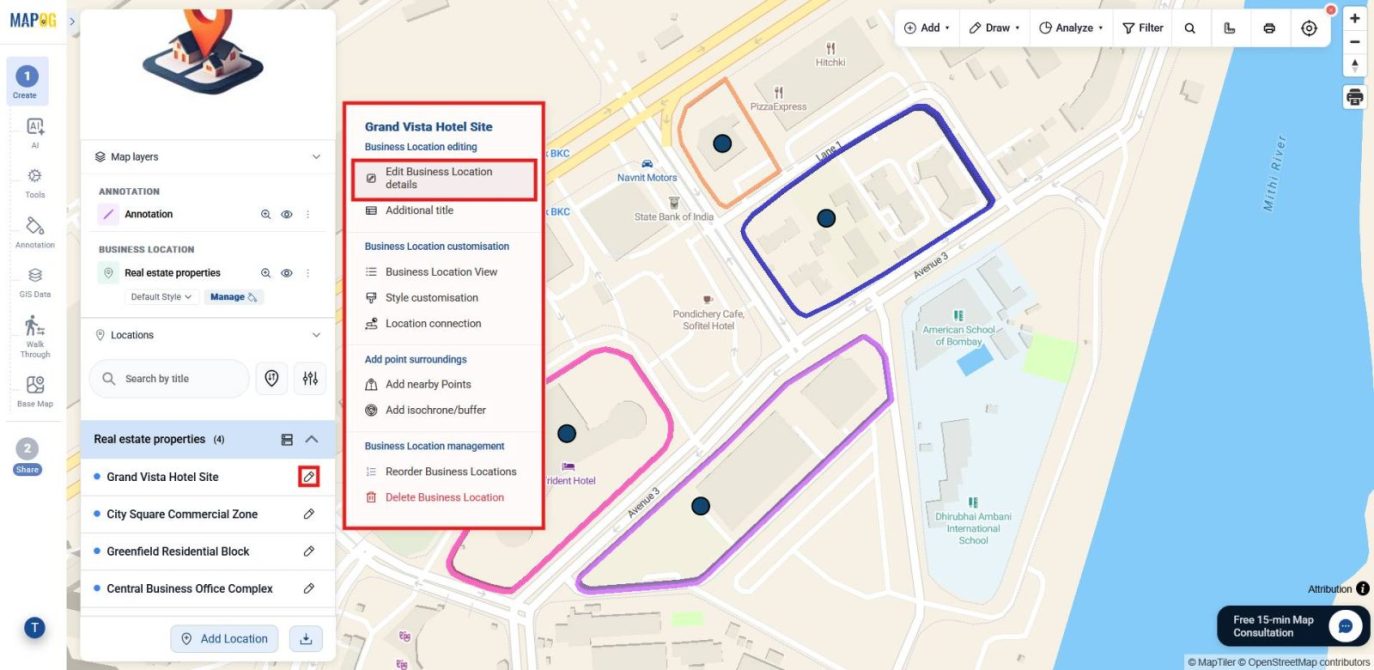
do the changes if needed and save changes will appear in the pop up.
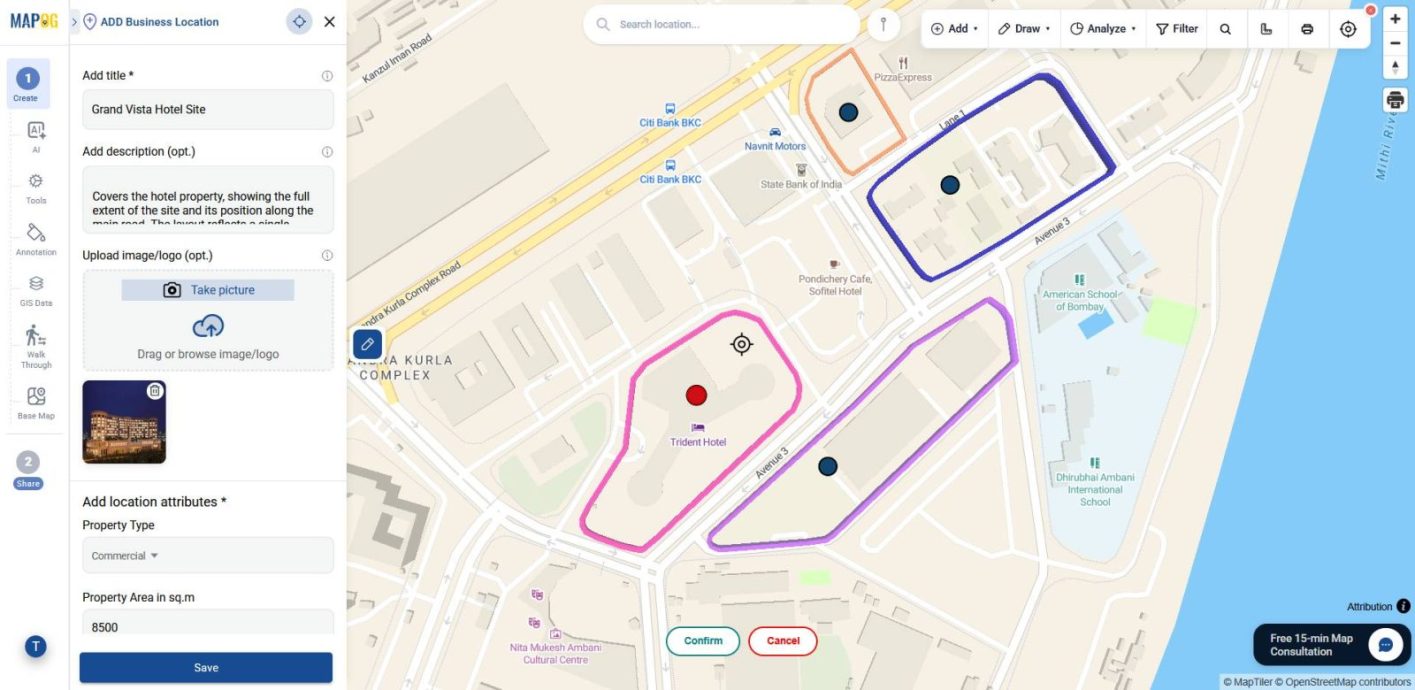
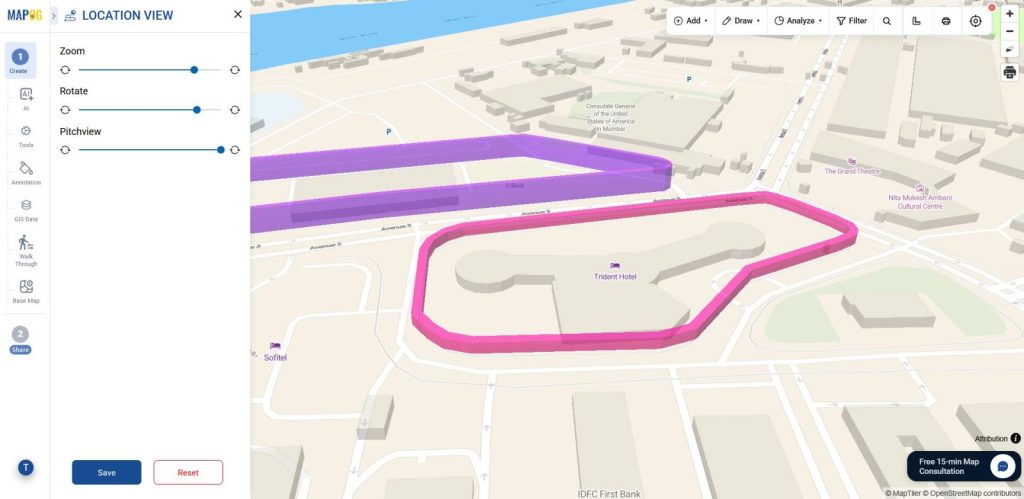
You can also change the Business Location View to explore boundaries and buildings from different angles. Adjust zoom, rotate, and pitch-view scale, then save. This keeps the map flexible and clear, helping stakeholders view the property effectively while making 3D boundary height and separation easier to understand.
6. Group Properties
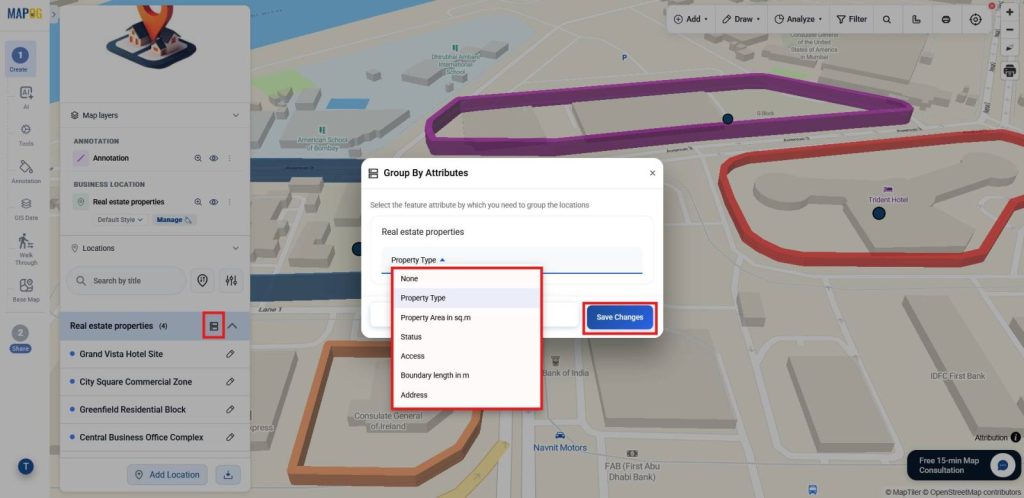
To organize layouts more effectively, use the Group By option. Categorizing properties by type or other attributes helps boundaries display more clearly, making comparisons easier and layouts more readable.
7. Enhance with Styles and Labels
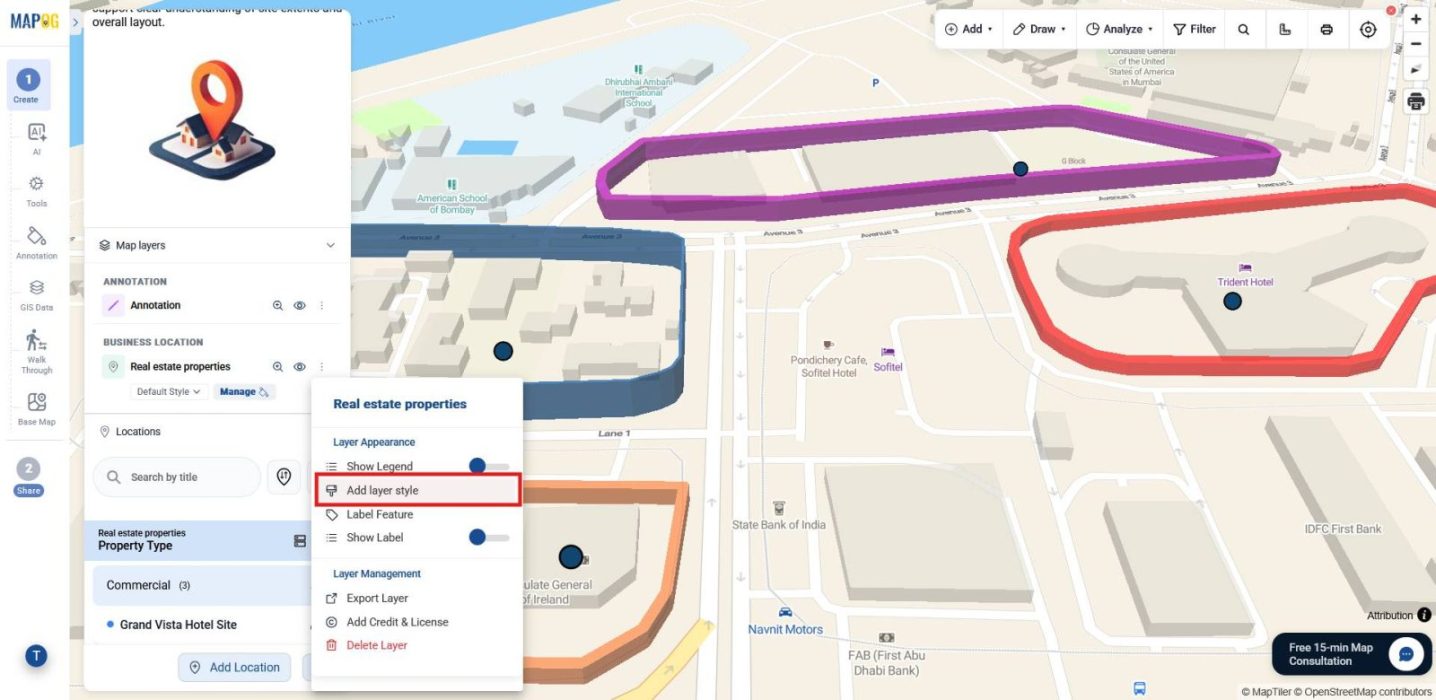
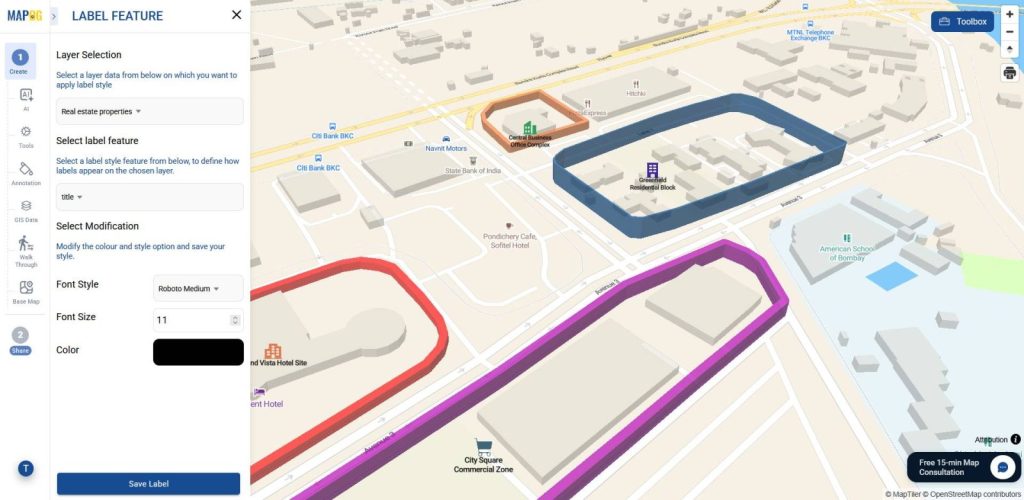
For added clarity, go to the Layer Panel and select Add Layer Style.
In the Category Section, choose an attribute to display points. Use Category Icons to color‑code points and distinguish them with different icons, then save.
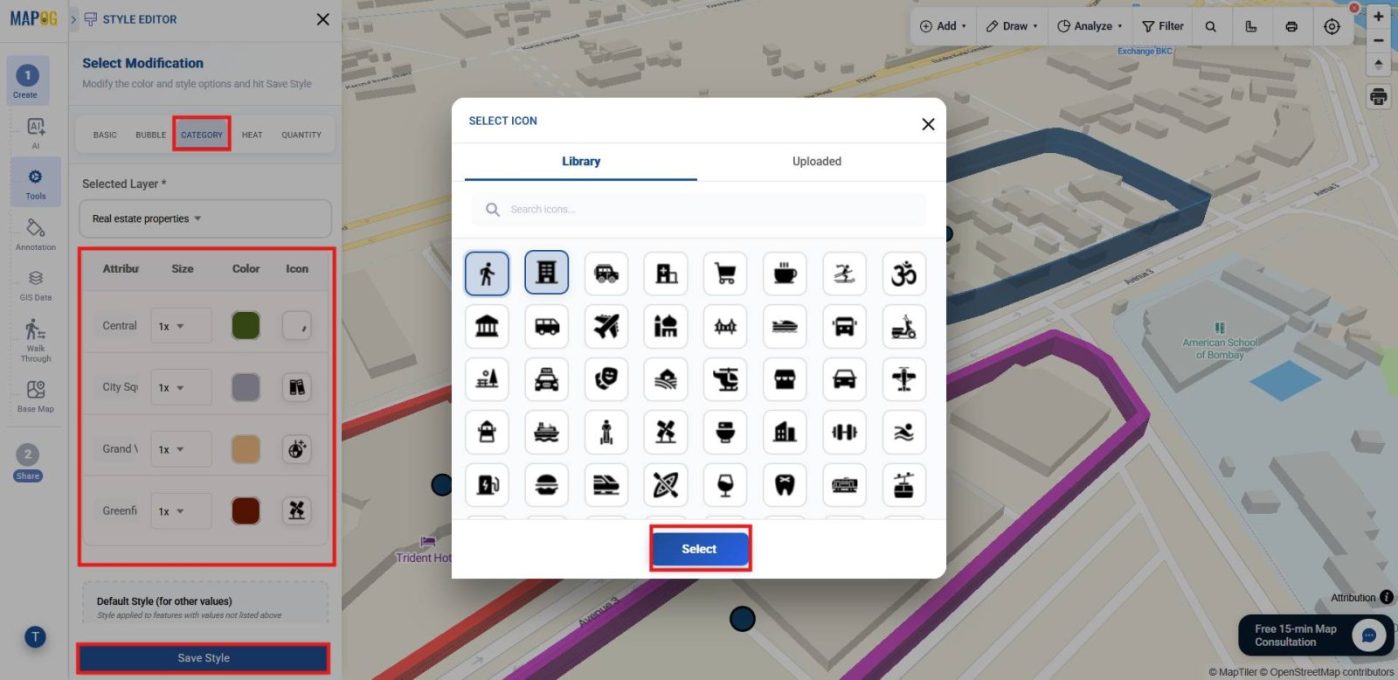
Add labels by selecting an attribute, adjusting font style, size, and color, and clicking save. This makes your map visually informative and professional, ensuring details are easy to interpret at a glance.
8. Preview and Share
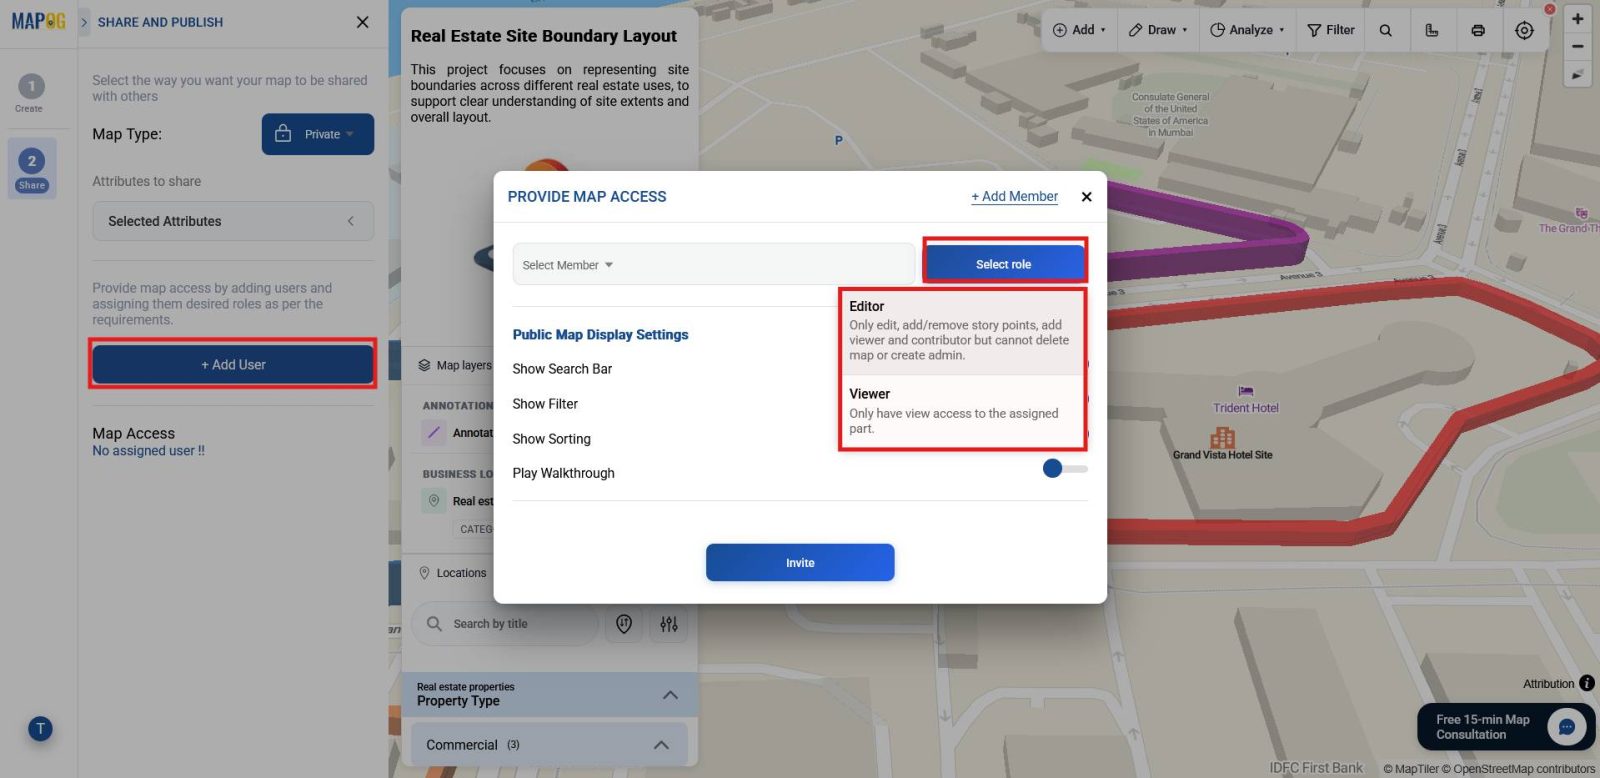
Finally, open the Preview and Share section. Share privately by adding users with assigned roles,
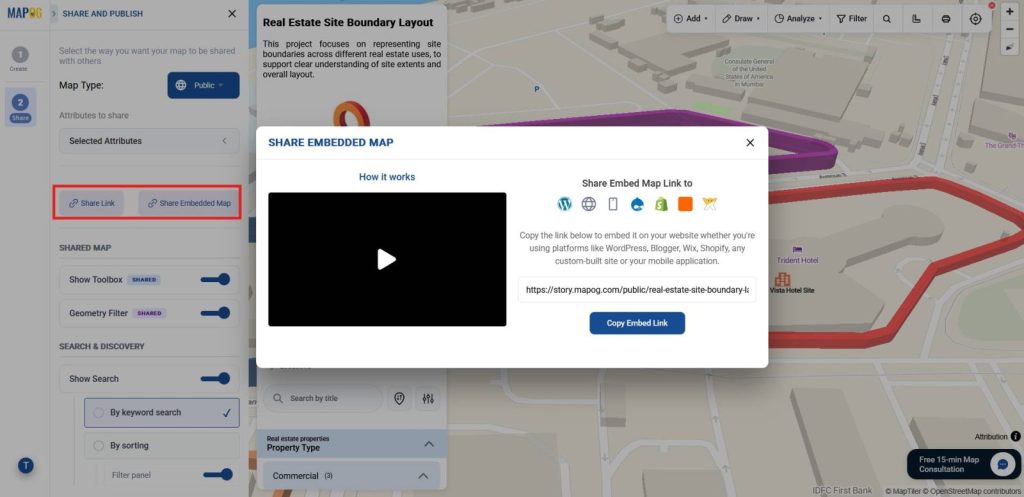
or publicly via share link or embed option. Enable permissions to control access. This way, your map can be securely shared for collaboration or showcased in presentations with confidence.
Industrial Use and Benefits
3D boundary mapping makes site limits visible and practical. In construction, it separates active zones from restricted areas. Similarly, energy projects secure solar farms and substations, while logistics organizes storage and movement. Likewise, infrastructure distinguishes public from private, improving safety, compliance, and coordination.
Conclusion
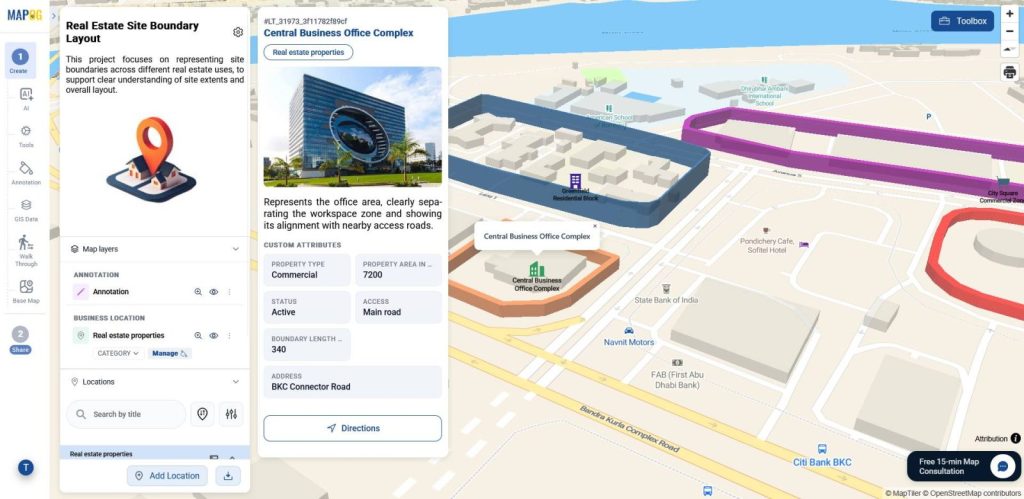
3D boundary walls make site layouts clearer by turning flat outlines into visible, easy-to-understand boundaries. As a result, properties are easier to read, compare, and present. With MAPOG, creating these boundaries remains simple, allowing maps to communicate space more effectively without added complexity.