In real estate and infrastructure projects, 3D models often stay limited to design software or displays, making them difficult for clients to understand in real-world context. Consequently, they fail to show nearby roads, amenities, transport, or developments. MAPOG maps 3D models with location data.
Key Concept – Why Use 3D Models on Maps
Because maps add real-world context by showing accessibility, nearby infrastructure, and project surroundings. Thus, 3D models become interactive map, client-ready tools that improve planning, understanding, and decision-making.
What Is Using 3D Models on Maps ?
Consequently, Using 3D models on maps is a GIS-based approach where buildings and infrastructure are visualized with real-world location data. It helps users view nearby roads and amenities, improving project presentations, planning, and decision-making.
Methodology: Use 3D Models on Maps for Real Estate & Infrastructure
Organizing 3D project data on maps improves visualization accuracy and stakeholder communication.
1. Configure the 3D Mapping Project
Go back to the MAPOG dashboard.
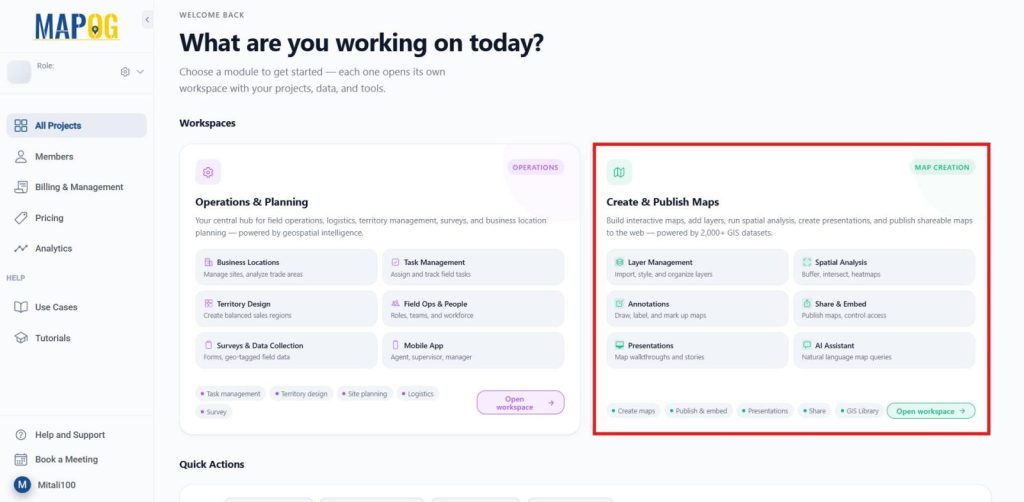
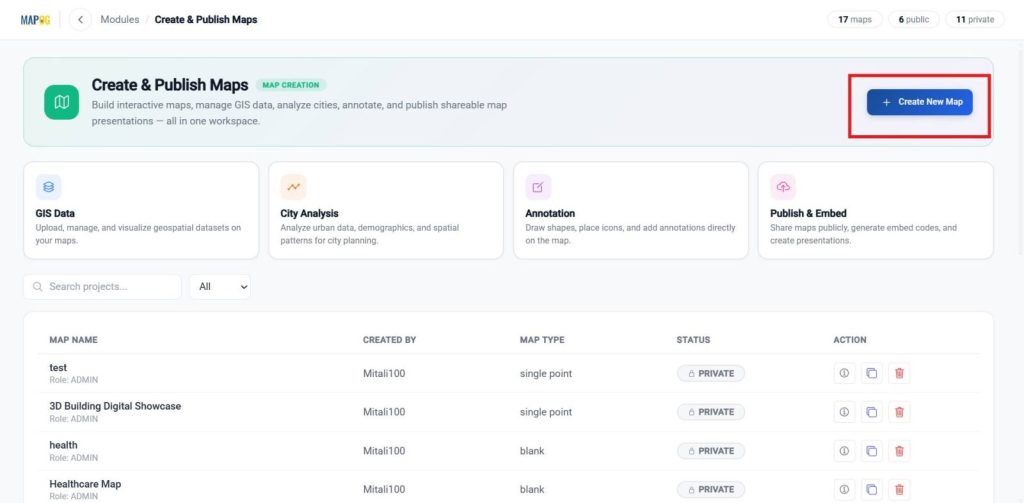
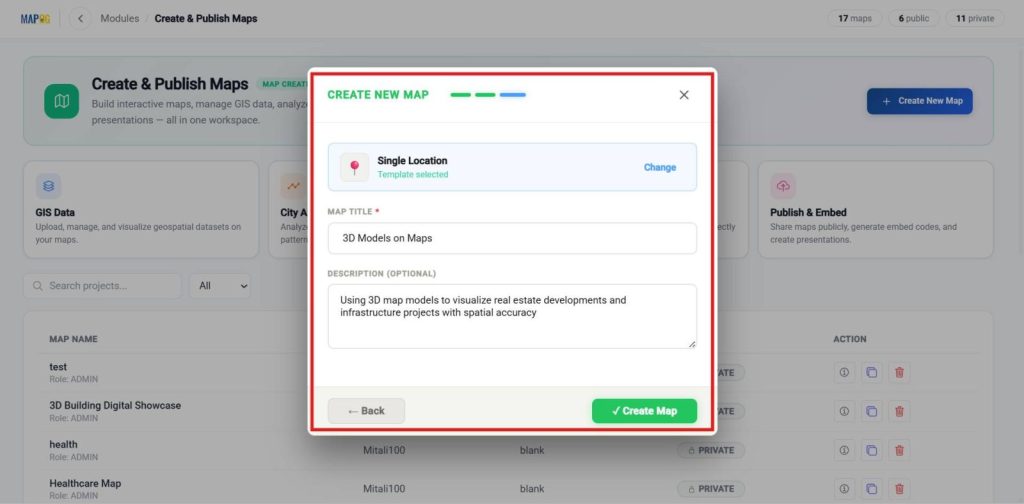
In the Create and publish map Dashboard, choose Create New Map.
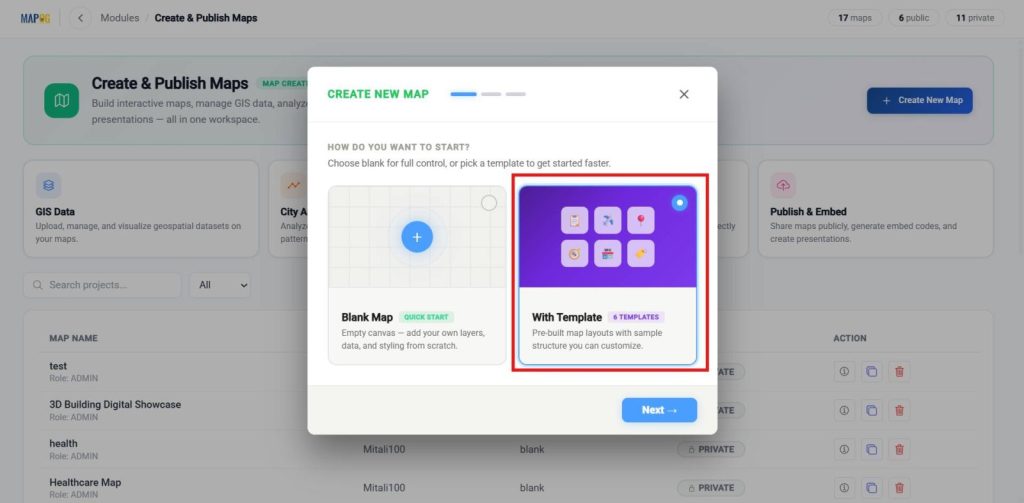
Choose a template, and proceed to the next step.
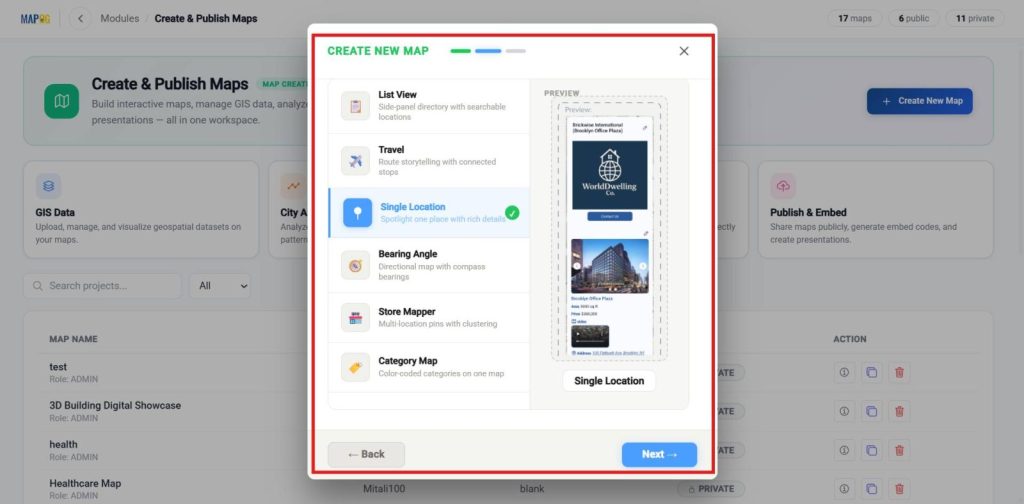
Select the template as Single point , then proceed to the next step.
Enter a clear title and a brief description, then click Create to save your map.
2. Upload and Place Your 3D Model
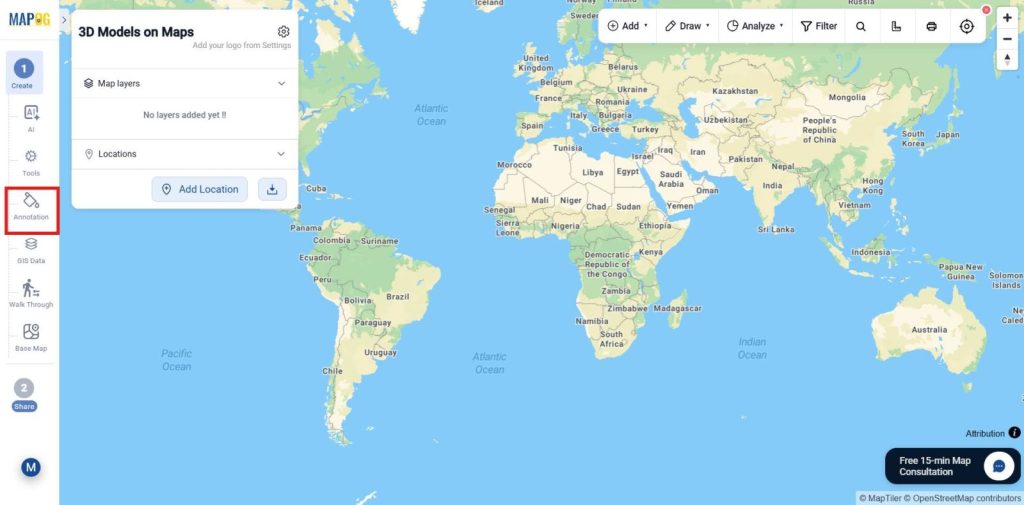
Once the map is created, select go to the annotation in tools bar.
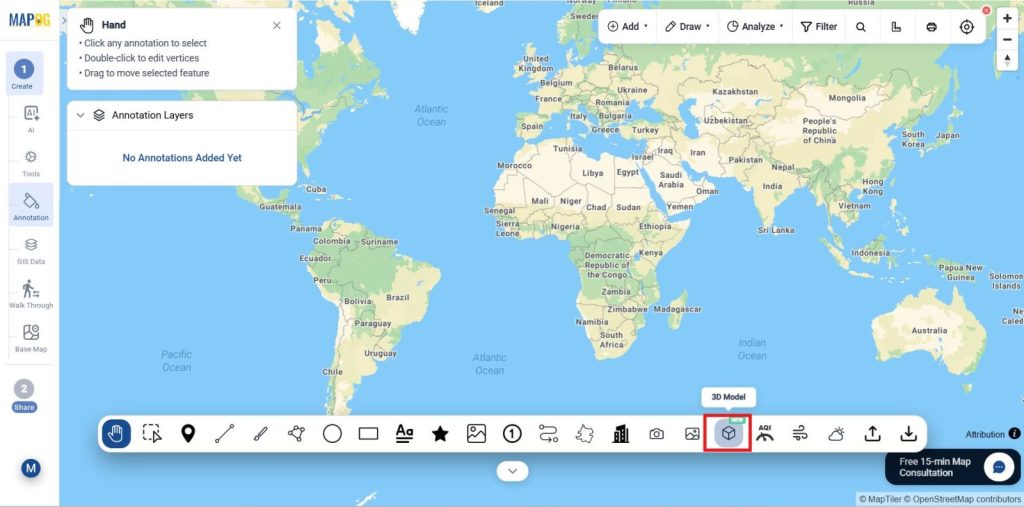
In Annotation select the 3D model as shown.
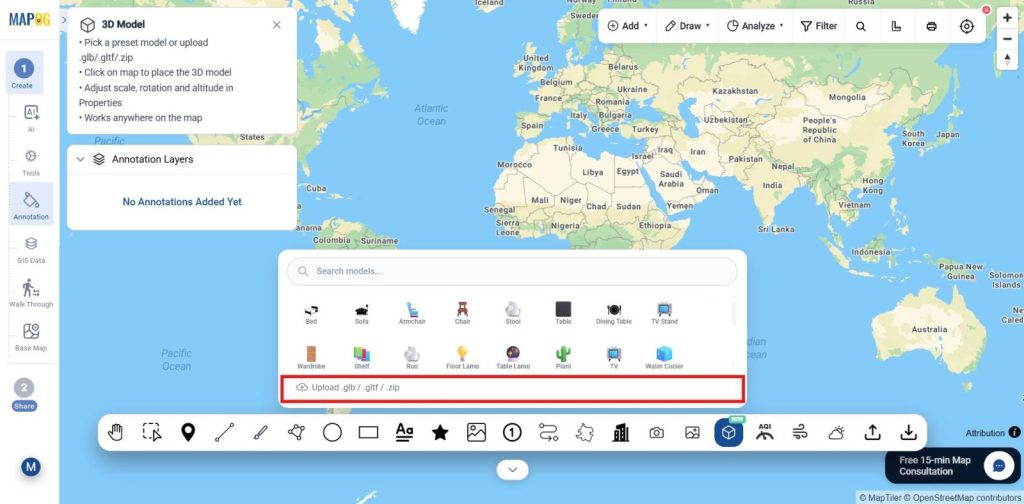
In which select the 3D file using Upload .glb / .gltf / .zip in this format as given.
Once you upload the location, move to the exact location of your site by searching using name or using the lat/long from the tool bar in top right.
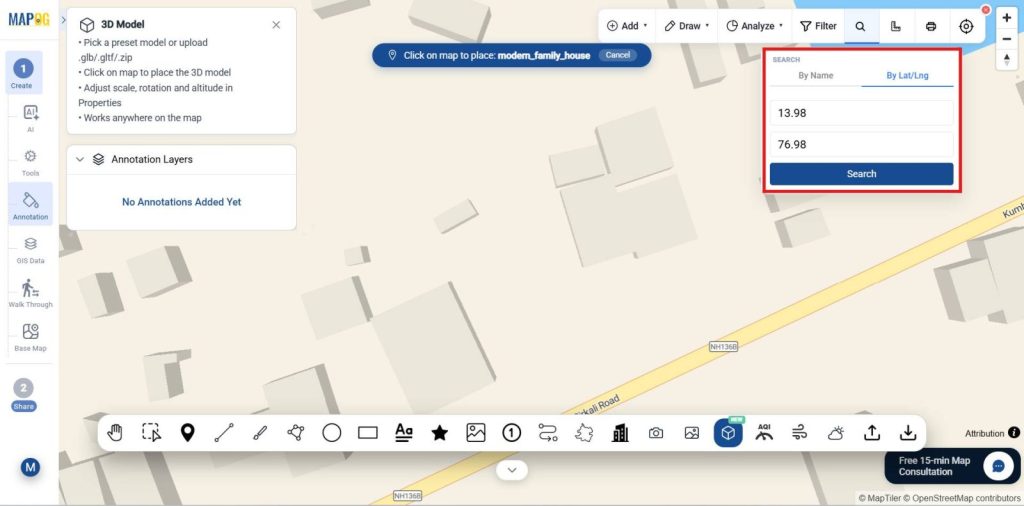
Now place the cursor and place the 3D image on the map as shown.
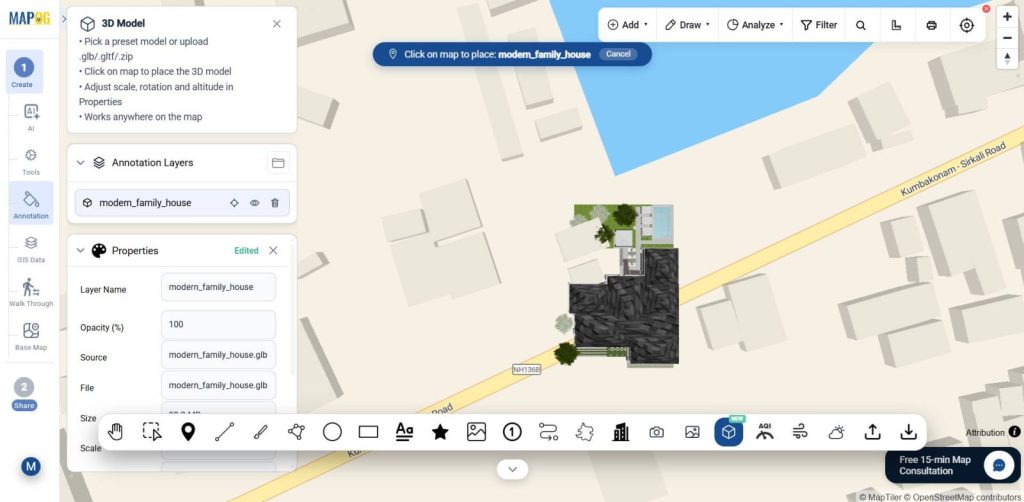
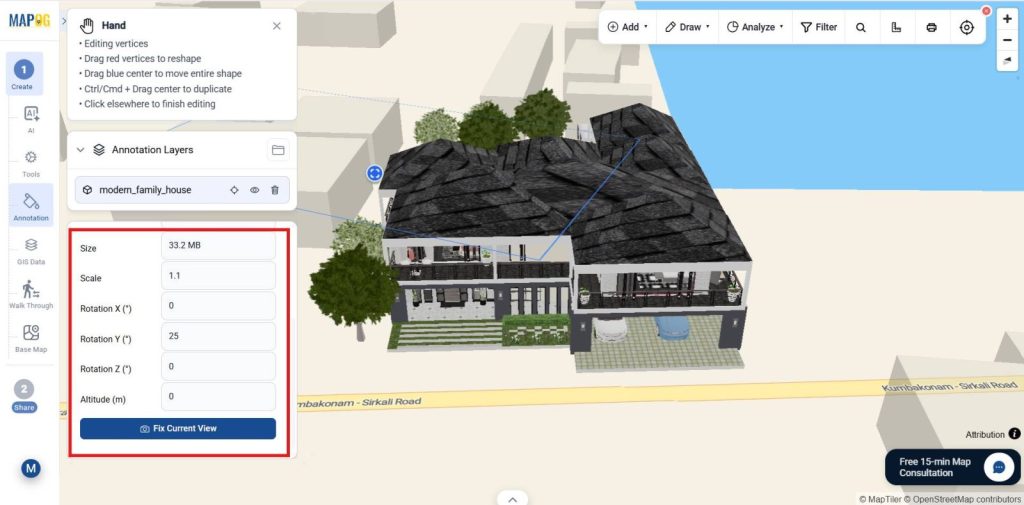
Now, using the Scale, Rotation ( X, Y, Z) and attitude fix the image view and finally select the Fix Current View.
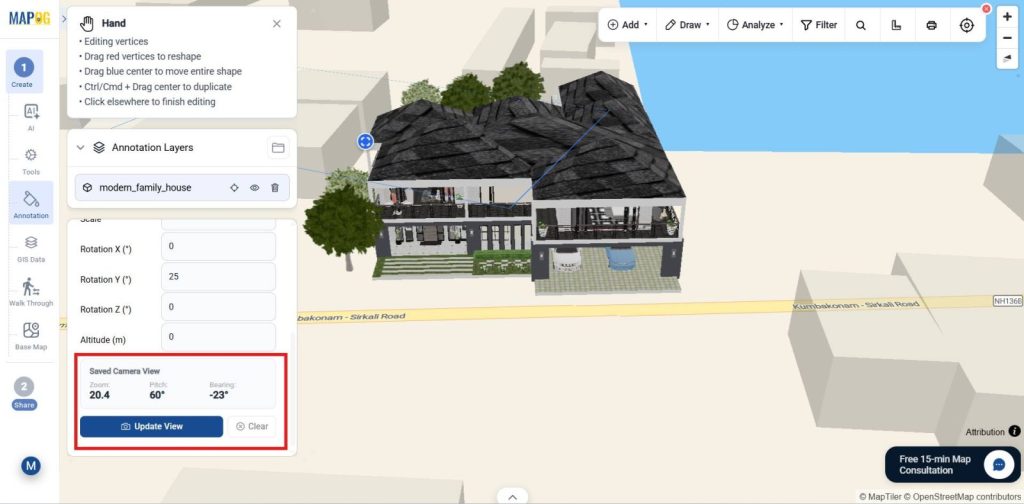
Once the location is fixed it will save the Zoom, bearing value and Pitch view and if you want you can further update it also.
3. Add Custom Location Details
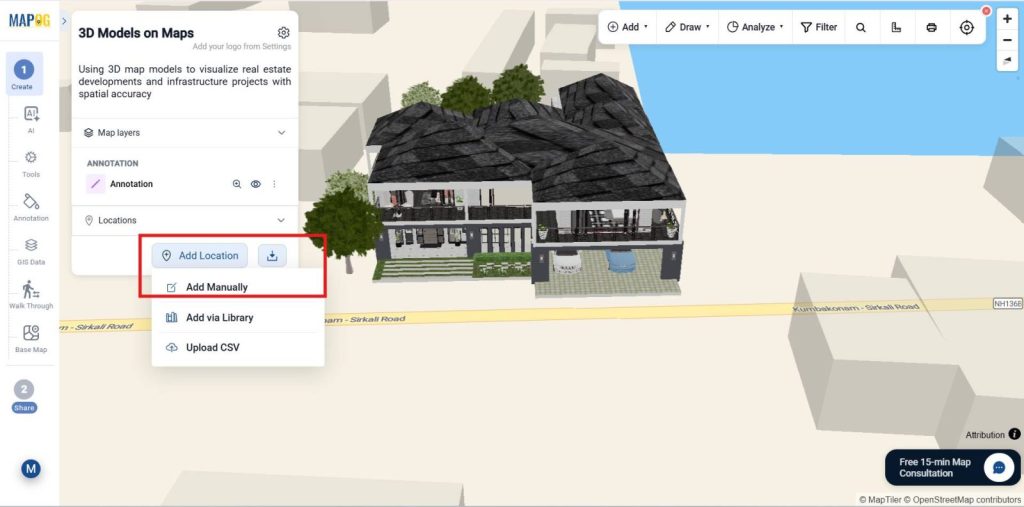
Next, click Location and select Add manually to enhance your 3D model with detailed and interactive project information.
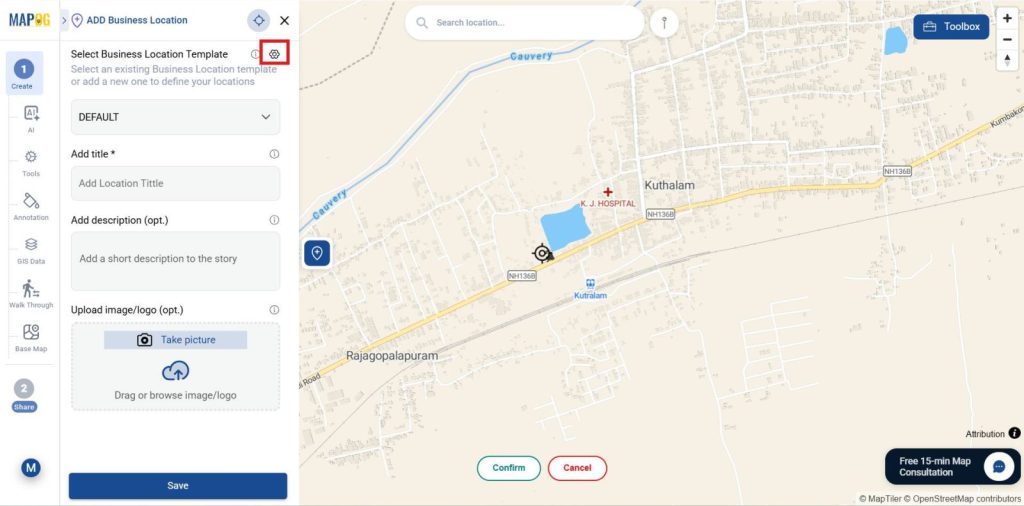
Then, open the settings icon in the select business location template.
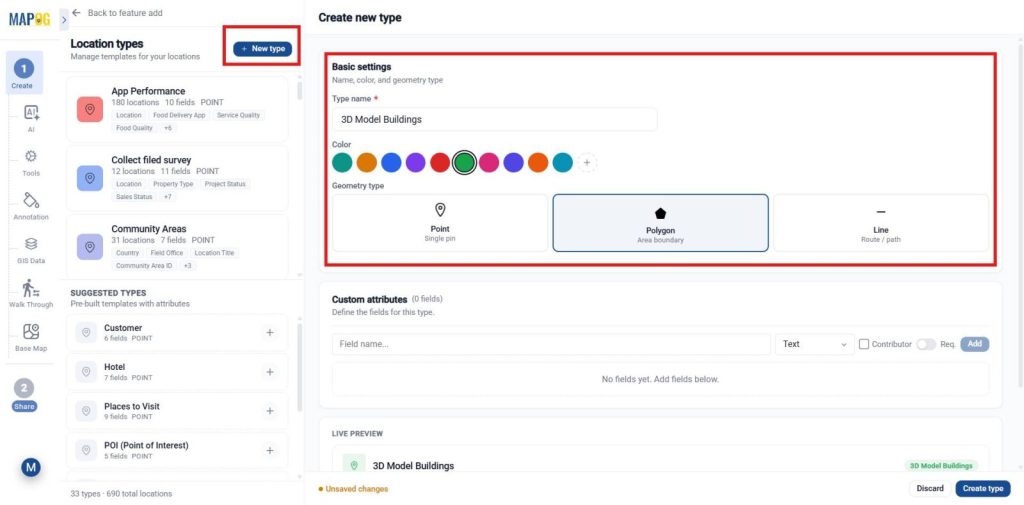
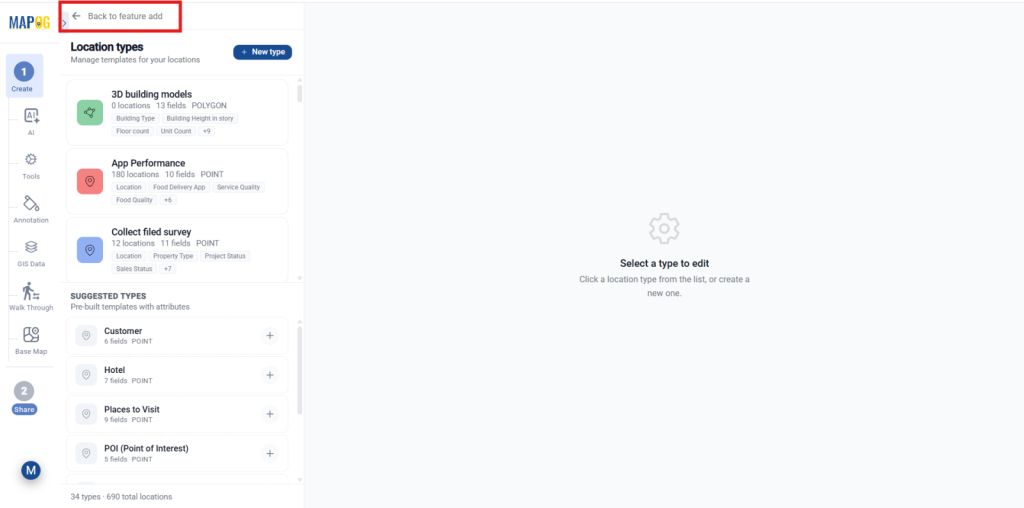
In Location types select new type & Name it, choose Polygon geometry (to define and capture the complete boundary area of the 3D project accurately), assign a color, and save.
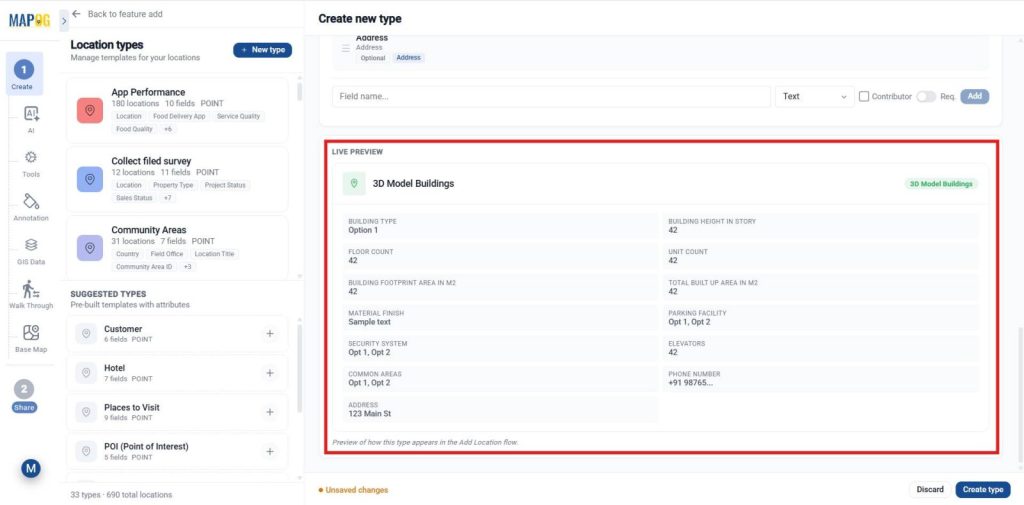
Include field attributes like Building Area, Address, Building Amenities, Photos, and Contact Details. Assign suitable field types such as Number, Address, Multiselect, Image, and Phone, enable “Allow for Contributor” for real-time updates, and mark important fields as Required to maintain accurate and consistent project information.
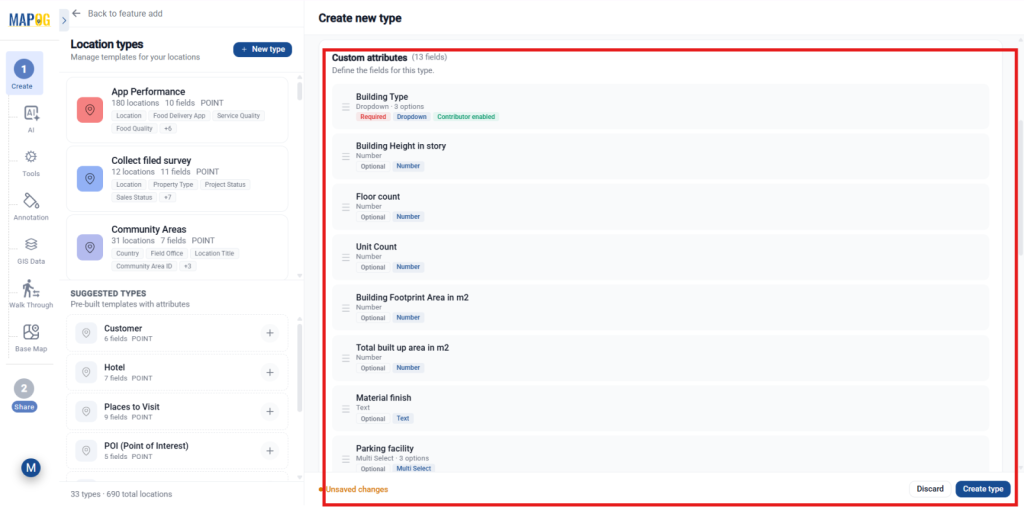
Once all attributes are added, use Live Preview to verify the setup, then click Create Type to save and create the template.
Then, return to the previous step to add features.
Now, select the created template from the dropdown.
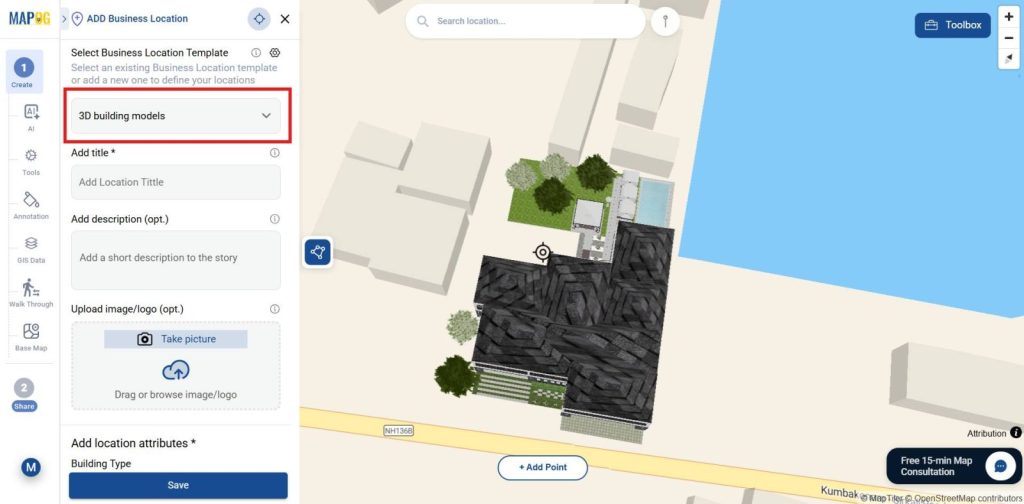
Since Polygon geometry was selected, place multiple points around the 3D model to create a project boundary.
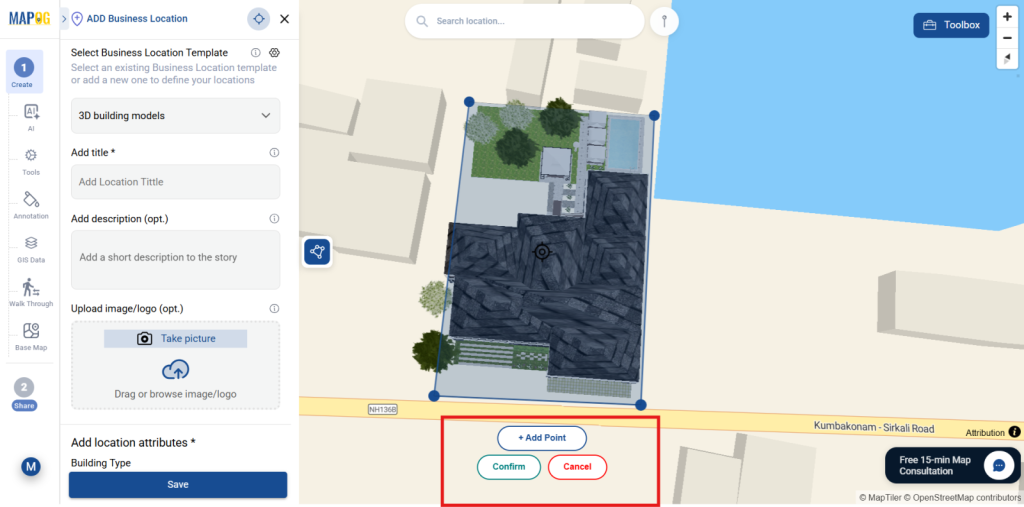
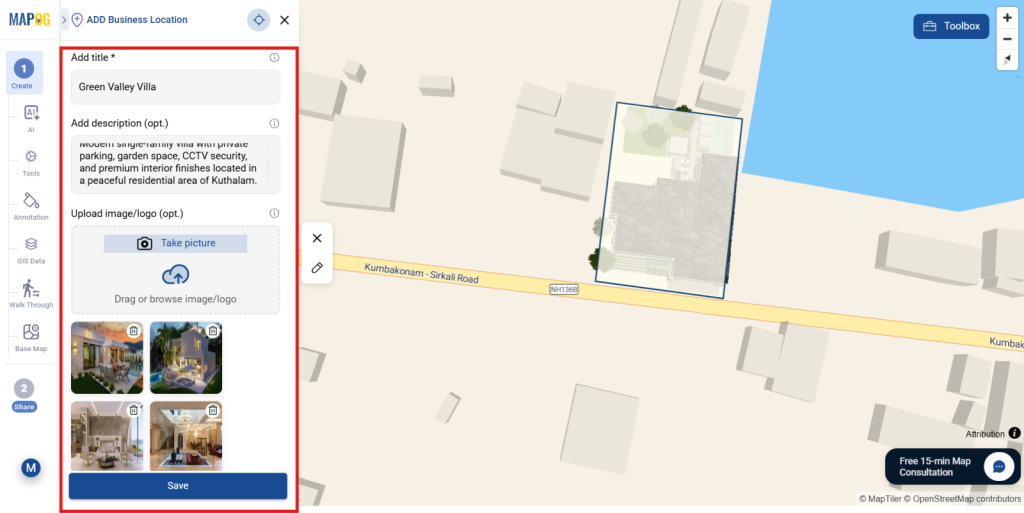
Add a project description, upload site images, and fill in attributes like building type, area, parking, security, and contact details. Once completed, click Save.
4. Adding Nearby Location details
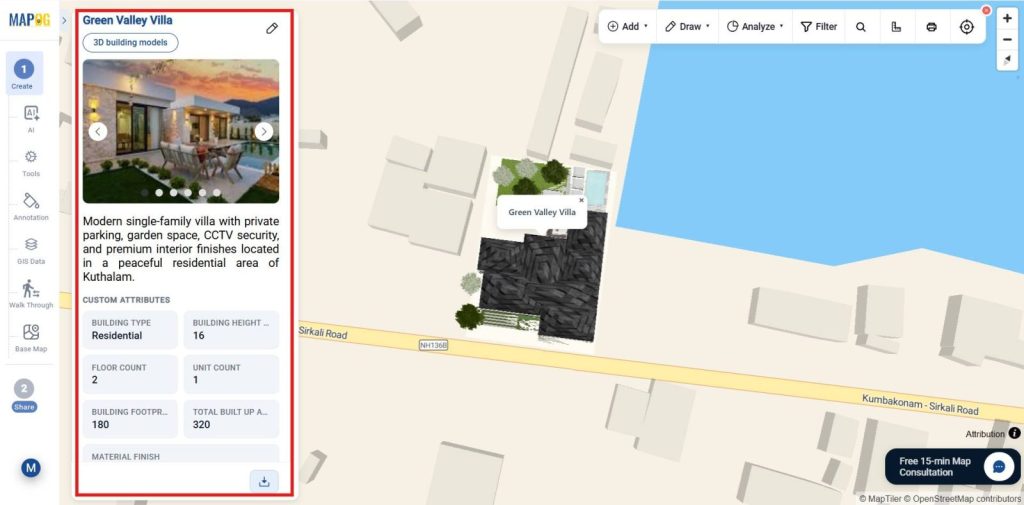
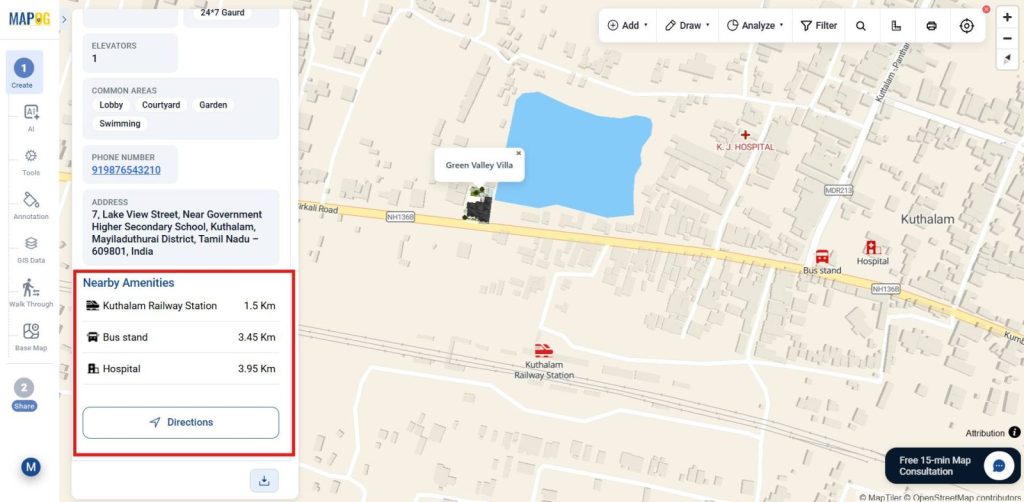
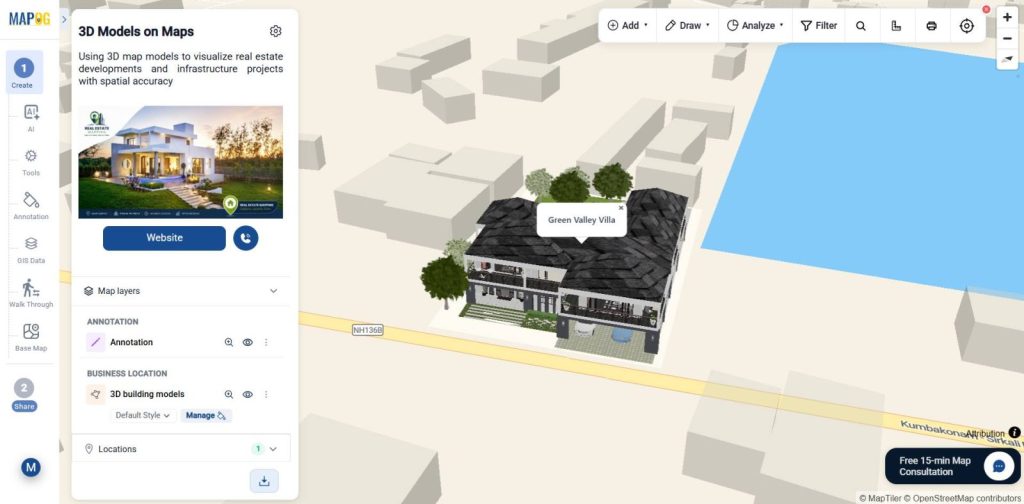
Moreover, All project details will now appear directly on the interactive map, making the 3D showcase more informative and visually complete.
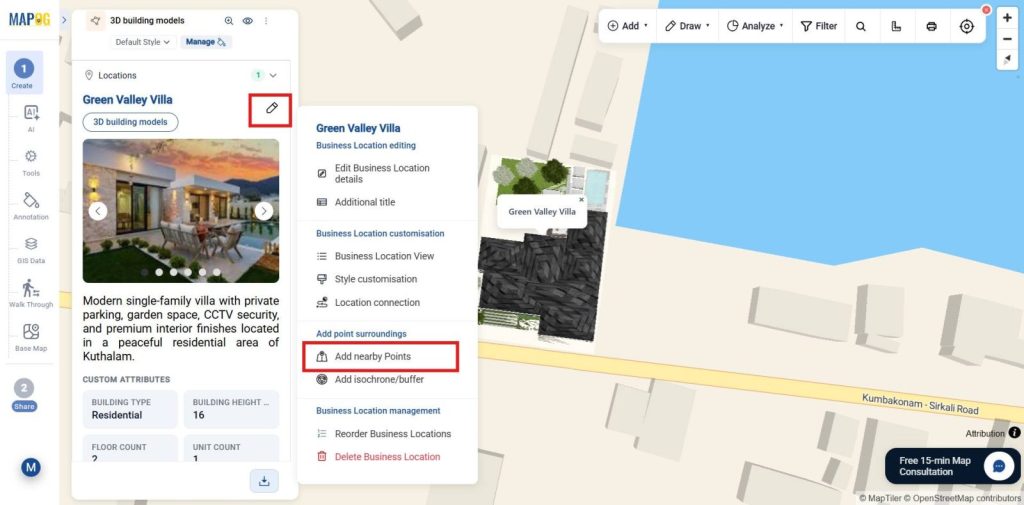
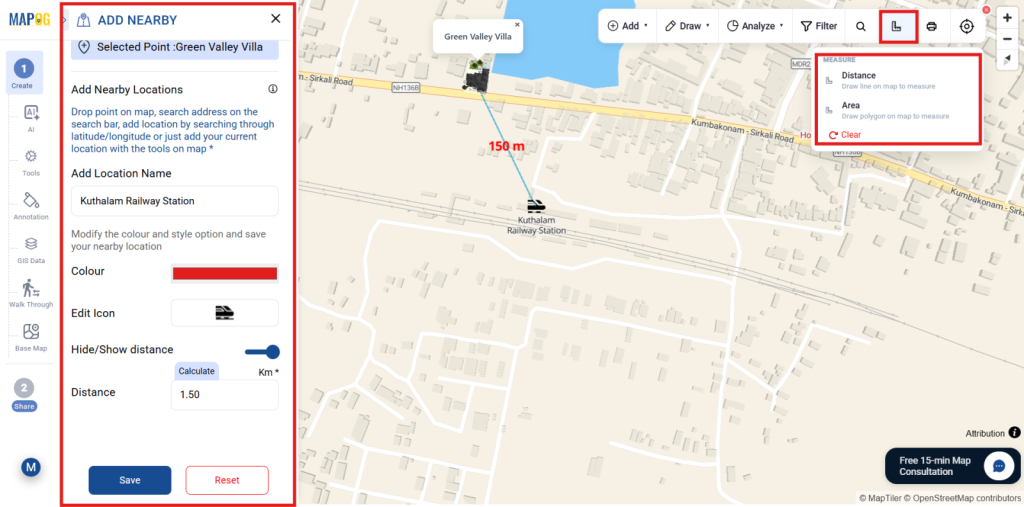
Next, highlight nearby amenities to improve project context and accessibility. Click the pencil icon and select Add Nearby Points.
Search nearby places by name or manually add points on the map. Enter a name, select a color, and assign an icon for each amenity.
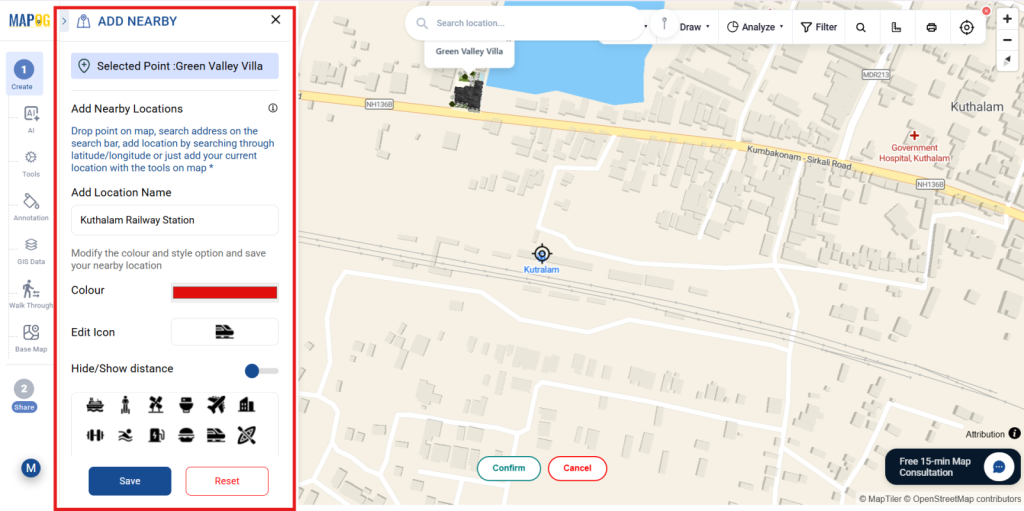
Enable Show Distance and use the Calculate tool to automatically measure distances between the project site and nearby locations. Click Save to add all points to the map.
Similarly, Click Save to add all nearby points to the map.
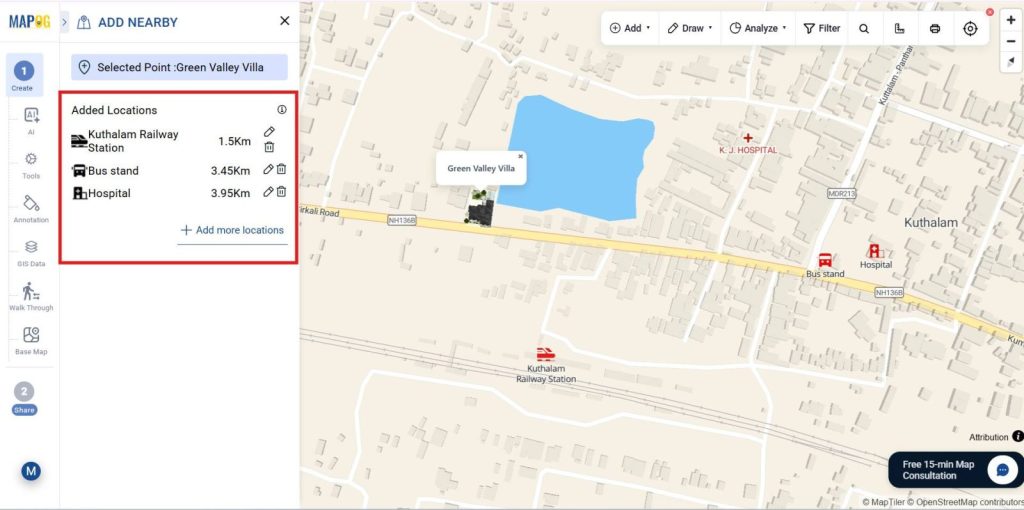
This helps viewers instantly understand connectivity to hospitals, transport stations, and other important places.
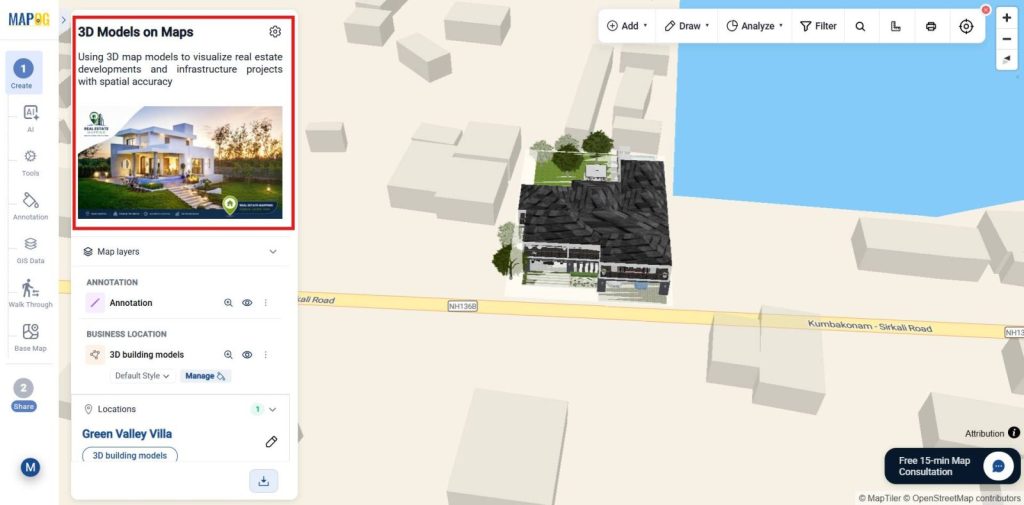
5. Adding Brand Logo
Now customize your project branding from Map Settings. Click Replace to upload a company logo or project image, make the required adjustments.
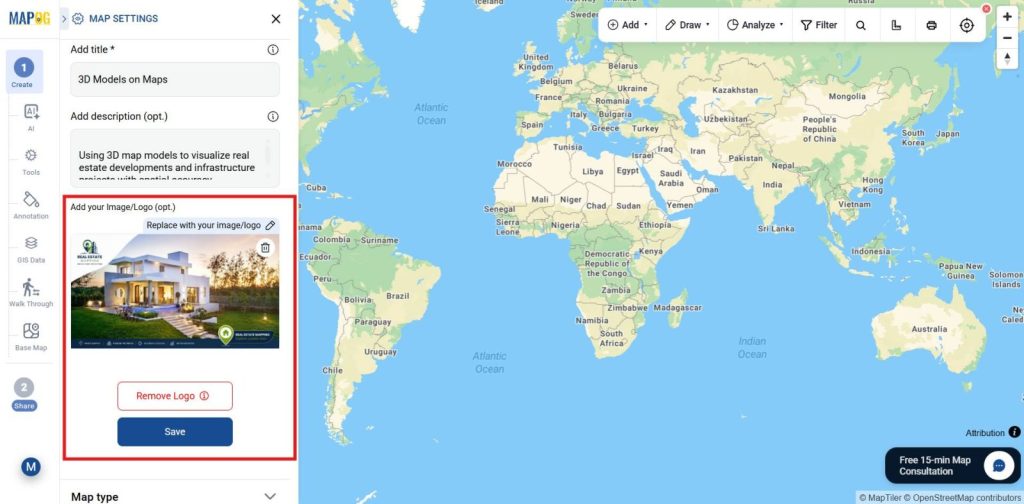
Then, save it as the branding element.
6. Use of Action Button
Next, go to Map Settings and select Action Button. Add actions like a website link, phone number, or contact page, then save the changes.
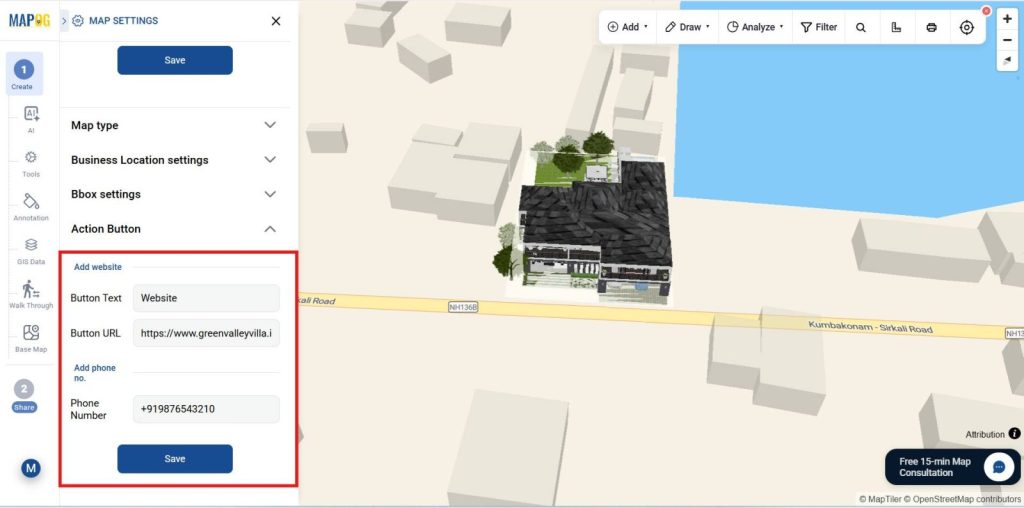
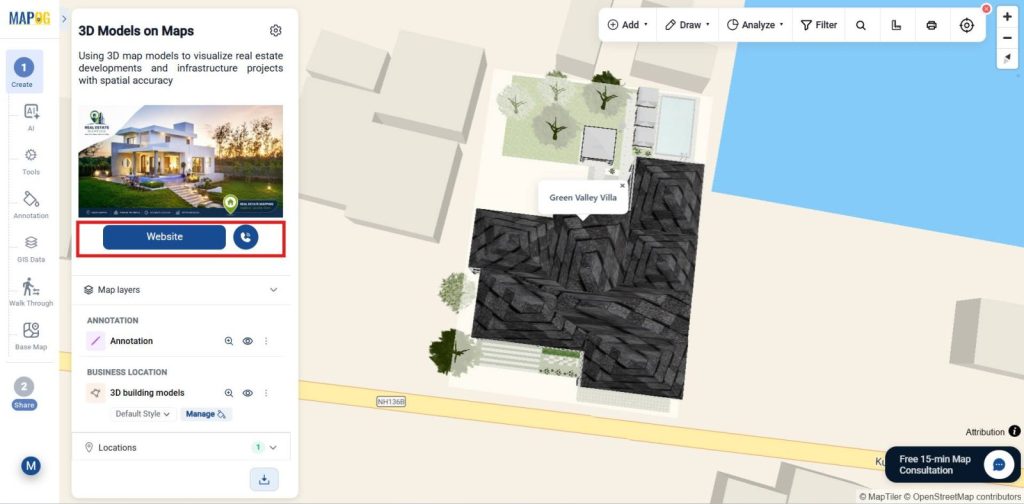
At last, Users can now instantly access the website or contact the organization directly from the interactive map.
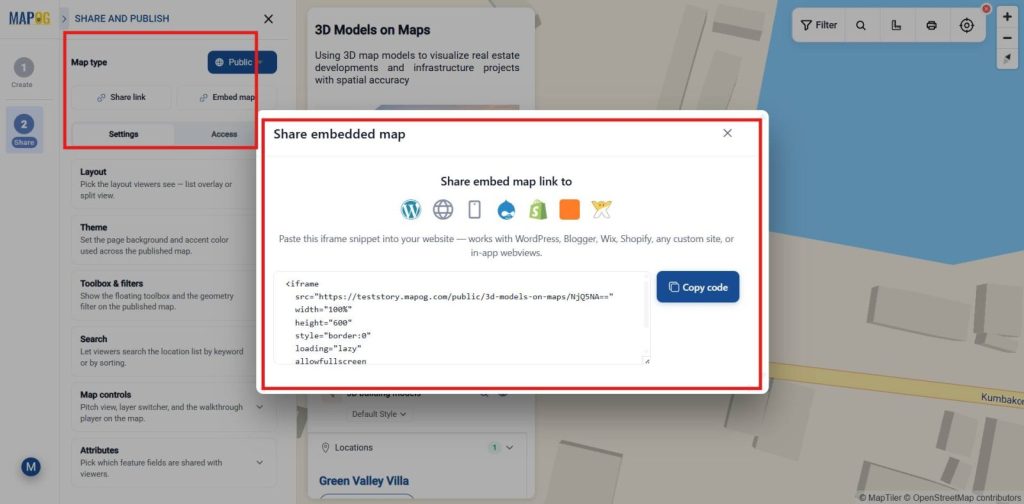
7. Publish and Share Your Map
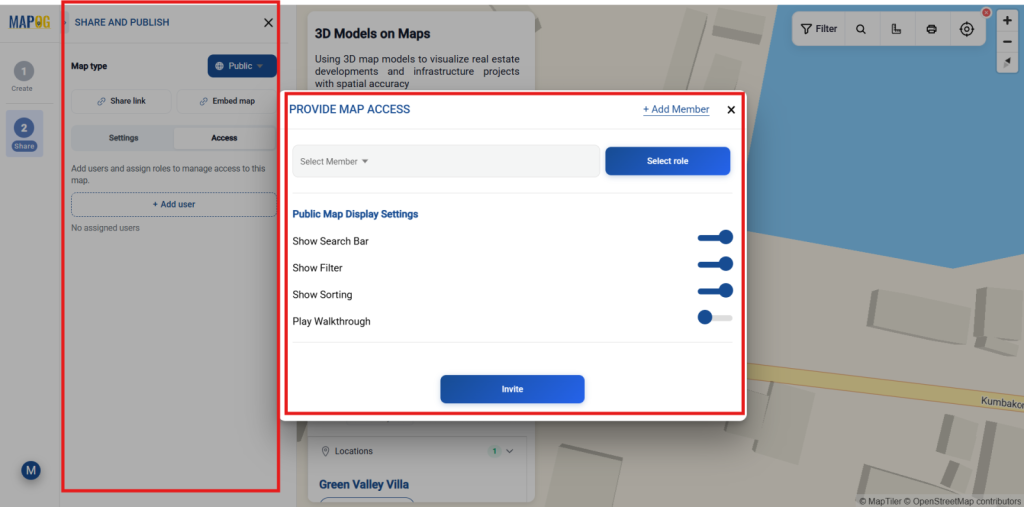
Once setup is complete, use Preview & Share to publish your map and generate a shareable or embeddable link, letting users explore properties by all or selected attributes.
So, Provide map access by adding users, assigning roles, and enabling shared tools like geometry filters, search, and map controls. As well as, Use +Add Users to invite members, assign view/edit permissions, and enable public map features like search, filters, sorting, and shared tools.
Industry Use Cases and Benefits
Finally, Visualize 3D buildings and infrastructure on interactive maps to improve project planning, site analysis, stakeholder presentations, and property visualization making projects easier to understand and manage.
Conclusion
In conclusion, MAPOG simplifies 3D mapping by combining models, location data, and interactive visualization in one platform for better planning and smarter decisions.