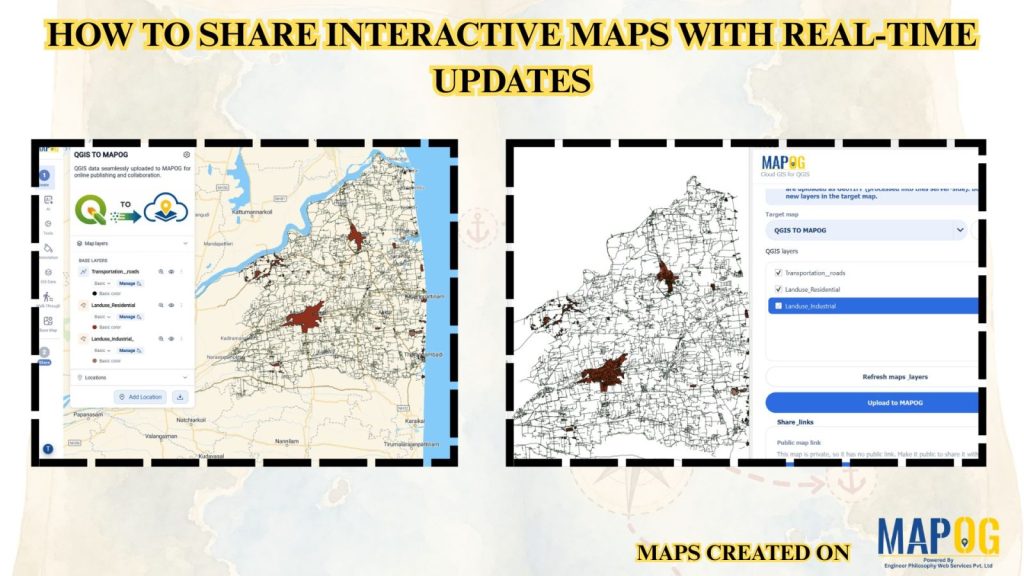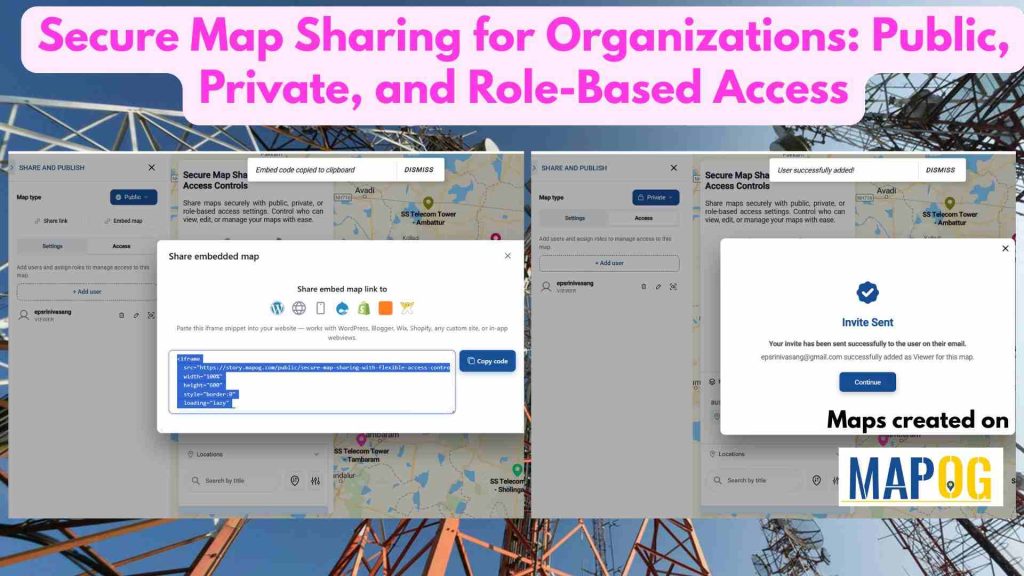
#GIS

Spreadsheet Data into Interactive Maps

Transform Spreadsheet Data into Interactive Maps in Minutes
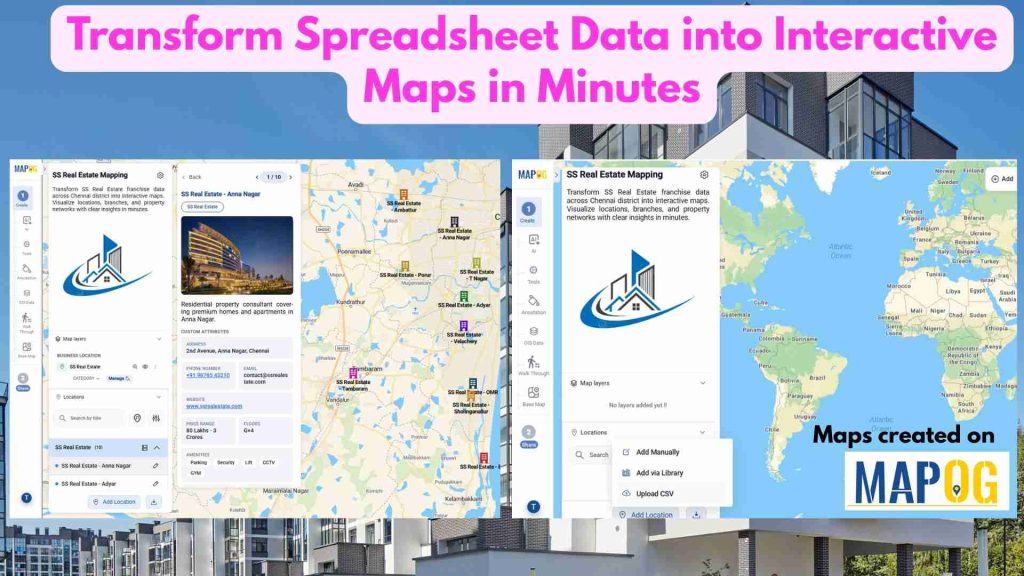
In the real estate industry, managing property listings, project locations, and franchise networks through spreadsheets alone can make it difficult to understand market coverage and location patterns. Businesses often deal with scattered property data, making it challenging to compare sites, track developments, and share location insights with teams and customers. With MAPOG, you can transform … Read more

MAPOG Annotation Tool: A Complete Feature Guide for Every Use Case
MAPOG Annotation Tool: A Complete Feature Guide for Every Use Case

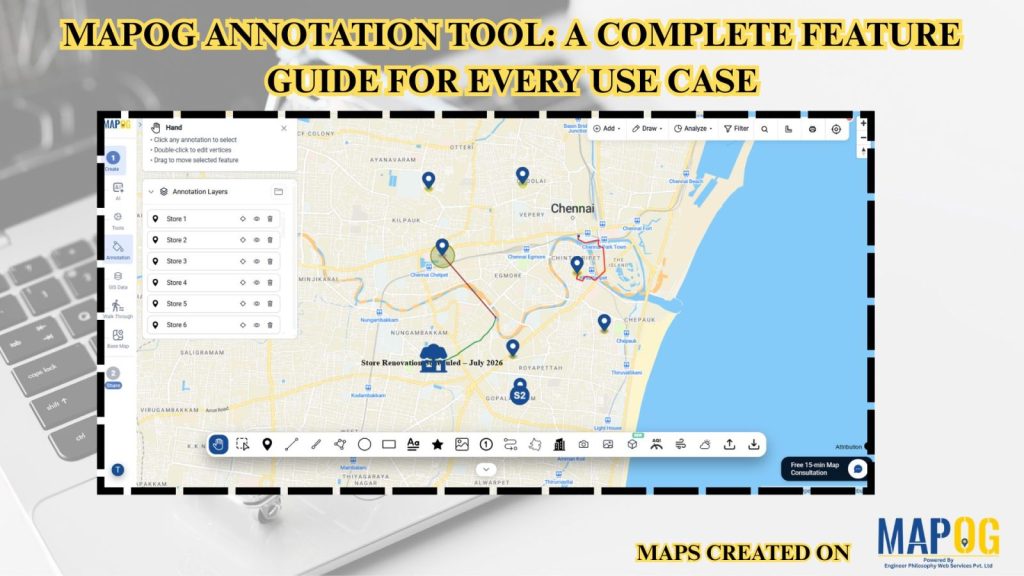
Interactive maps become more effective when users can annotate locations, mark routes, and visualize important geographic information. Similarly, the MAPOG Annotation Tool offers powerful drawing and markup features that support planning, collaboration, and location-based decision-making across industries.  Why Use MAPOG Annotation Tool in GIS Maps? However, Annotations turn maps into interactive workspaces by enabling teams … Read more

How to Visualize Population Data Using Interactive GIS Maps
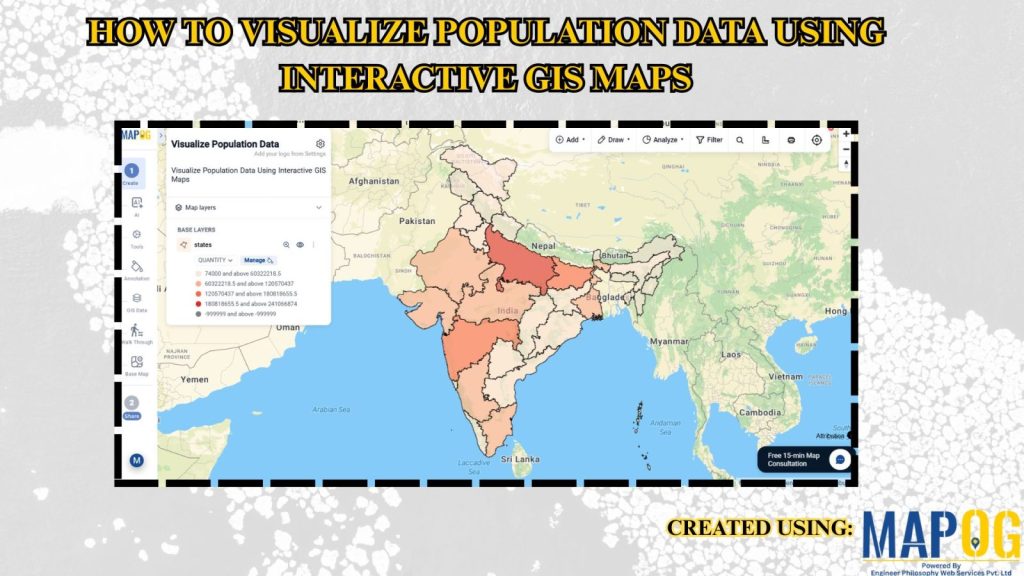
How to Visualize Population Data Using Interactive GIS Maps

In population studies and urban planning projects, demographic data often stays limited to spreadsheets or reports, making it difficult to understand regional patterns and trends. Consequently, users struggle to identify population density, growth areas, or demographic distribution visually. MAPOG Visualize Population Data using interactive GIS maps. Key Concept: Why Use Interactive GIS Maps for Population … Read more

Using 3D Models on Maps for Real Estate and Infrastructure Projects
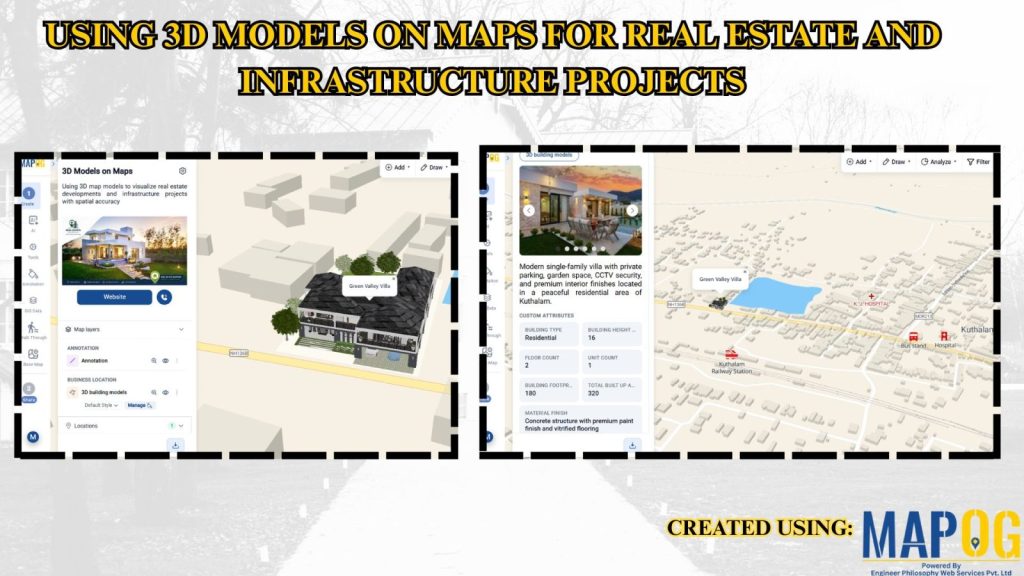
Using 3D Models on Maps for Real Estate and Infrastructure Projects

In real estate and infrastructure projects, 3D models often stay limited to design software or displays, making them difficult for clients to understand in real-world context. Consequently, they fail to show nearby roads, amenities, transport, or developments. MAPOG maps 3D models with location data. Key Concept – Why Use 3D Models on Maps Because maps … Read more

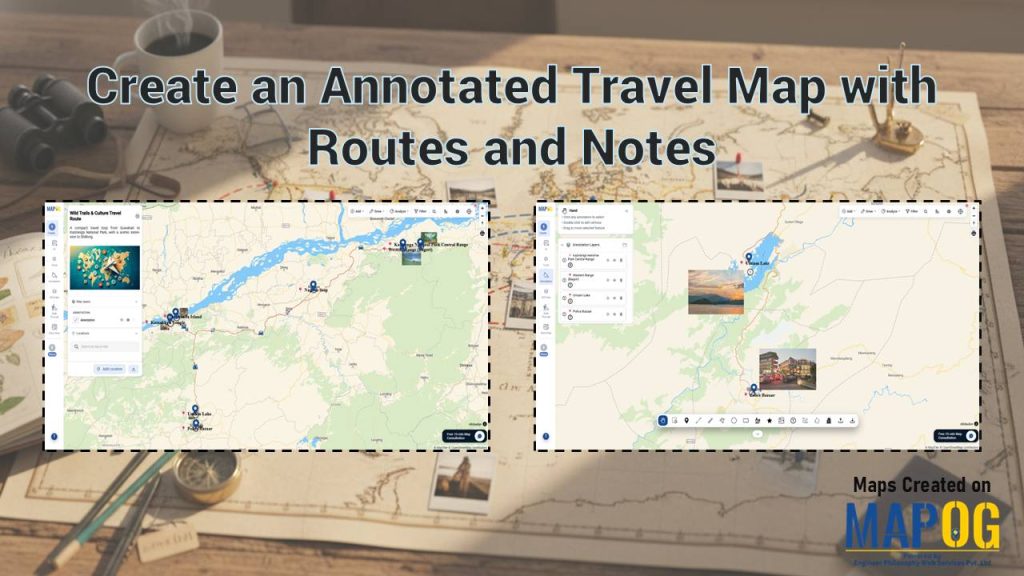
Create an Annotated Travel Map showing routes connecting locations with labels and images in a digital map interface

Create an Annotated Travel Map with Routes and Notes
To Create an Annotated Travel Map is to turn movement into meaning. Instead of static directions, you layer routes with insights, context, and memory. MAPOG elevates this workflow through precise annotation capabilities, so every path tells a story, not just a route. As a result, travelers, planners, and analysts move from “where” to “why it … Read more

Plot Your Points on a Map and Add Details with Images

Plot Your Points on a Map and Add Details with Images

In today’s data-driven workflows, simply listing locations in spreadsheets is no longer enough. Teams need a visual and interactive way to understand, manage, and communicate location-based information effectively. Whether it’s for field surveys, asset tracking, or site inspections, relying on disconnected tools often leads to missing context and delayed decisions. With MAPOG, you can Plot … Read more

How to Collect Field Survey Data with Photos, Videos, and GPS Location on a Map

How to Collect Field Survey Data with Photos, Videos, and GPS Location on a Map

Traditional field surveys often cause delays, data mismatches, and poor location accuracy. MAPOG simplifies the process by combining field data collection and mapping into one real-time workflow. Key Concept: Collect Field Survey Data with Media & GPS Instead of collecting notes separately and mapping later, MAPOG enables direct data capture on the interactive map. You … Read more

Map Residential and Commercial Properties Separately for Better Planning

Map Residential and Commercial Properties Separately for Better Planning

Traditional datasets mix property types, reducing spatial clarity and slowing analysis. MAPOG solves this by converting data into an interactive map with separate Residential and Commercial Properties layers, enabling clear visualization and smarter planning. Key Concept: Residential and Commercial Properties Instead of combining all properties, assets are grouped into separate map layers. Residential and commercial … Read more

Featured image Export or Share Your Customer Maps Securely with Your Team

Export or Share Your Customer Maps Securely with Your Team

Sharing customer maps is essential for effective collaboration and decision-making when your business relies on location-based client data. With MAPOG, you can export or share customer maps showing client locations, sales regions, or service zones. Furthermore, this keeps sensitive data secure through robust permission settings and controlled access management. Key concepts: Export or Share Customer … Read more

Share Private and Public Maps

How to Share Private and Public Maps Securely

Sharing maps is essential in modern digital workflows. For example, professionals in planning, logistics, and research use map sharing tools every day to collaborate and make data-driven decisions. MAPOG makes this process simple and secure by allowing users to control visibility and access. However, it’s important to know how to share private and public maps … Read more