In today’s data-driven workflows, simply listing locations in spreadsheets is no longer enough. Teams need a visual and interactive way to understand, manage, and communicate location-based information effectively. Whether it’s for field surveys, asset tracking, or site inspections, relying on disconnected tools often leads to missing context and delayed decisions. With MAPOG, you can Plot Your Points on a Map by plotting points and enriching each location with detailed information and images. This not only improves clarity but also helps teams collaborate better, validate on-ground conditions, and make faster, more informed decisions.
Key Concept
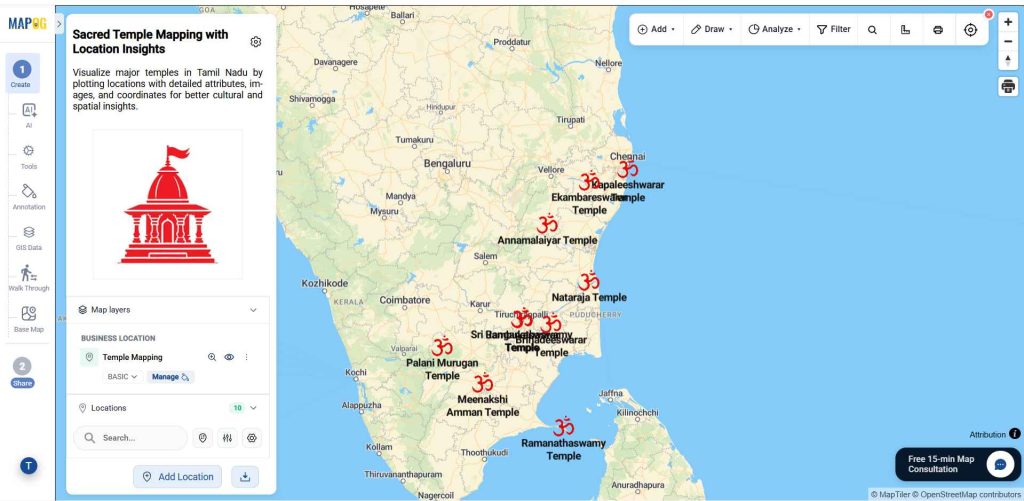
Before mapping, organize your data in an Excel/CSV file with key fields like Unique ID, location name, category, description, status, assigned personnel, and accurate latitude/longitude. This ensures consistency, easy tracking, and precise plotting. In this example, temple locations are used, with attributes such as location, deity, type, and year built. Upload the file into MAPOG using a predefined template to standardize entries. Once mapped, enhance each point with images and notes for better context. This helps teams visually monitor sites, reduce errors, and make faster, informed decisions.
Steps involves in Plot Your Points on a Map and Add Details with Images
Step 1 :Create and Upload Locations
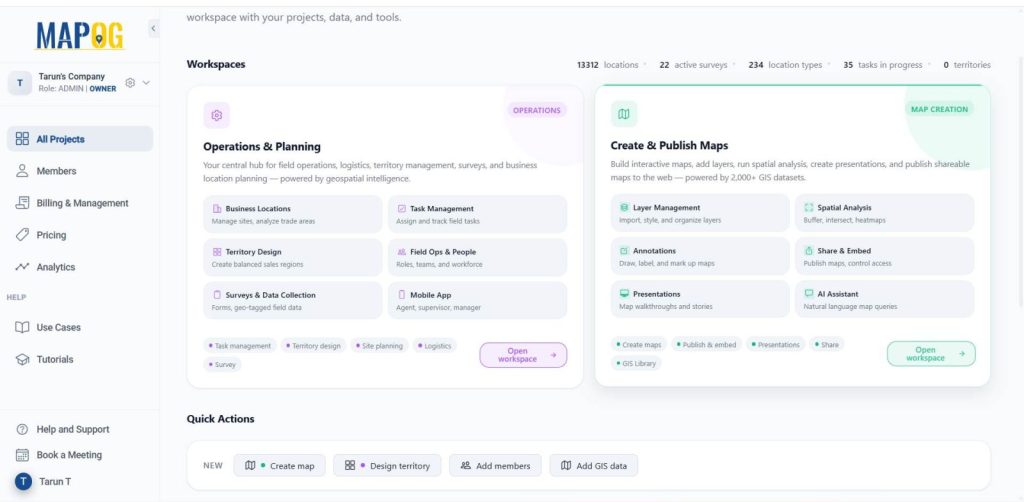
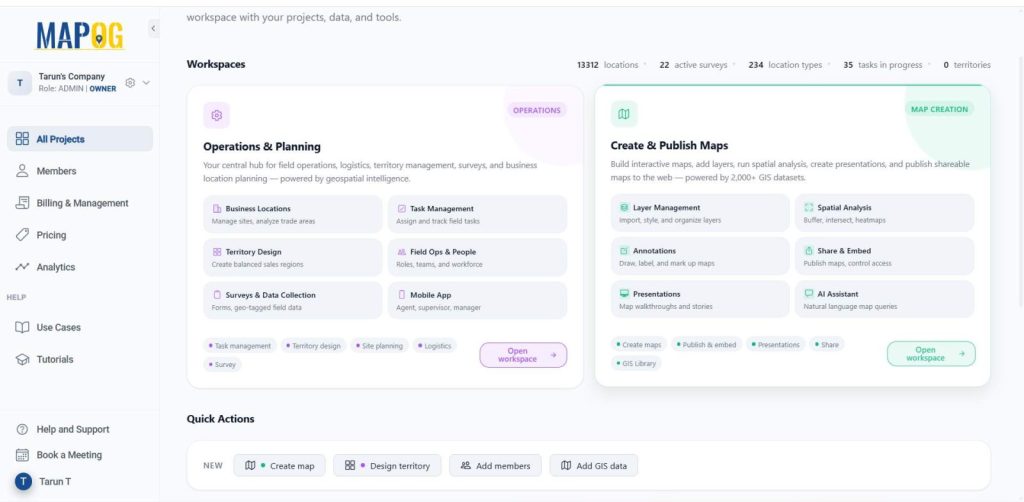
Open MAPOG, and click on Open Workspace in the Operations & Planning section — your central hub to manage field operations, logistics, surveys, and location planning in one place.
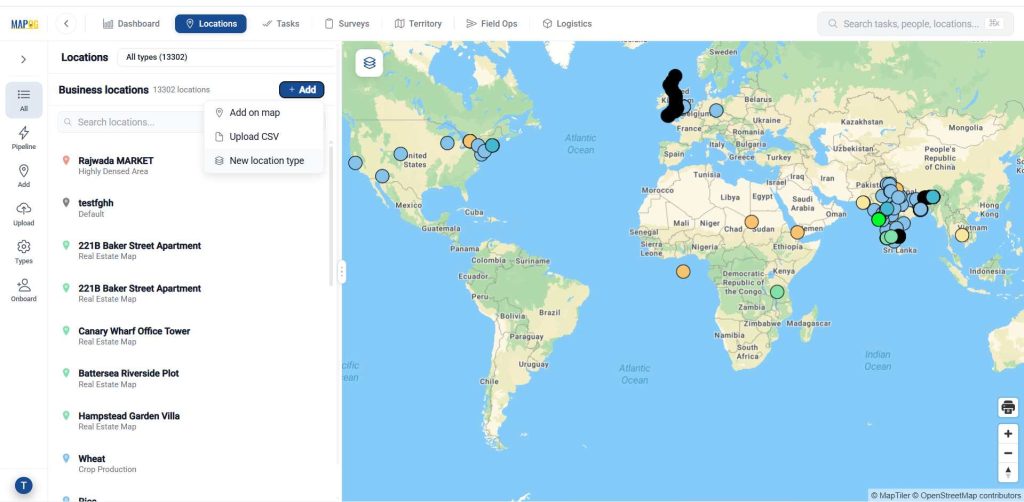
Go to Locations, and click on Add, then select New Location Type to create a new Business Location Template. This ensures consistency and reusability.
Give a name, assign a suitable colour and select geometry type as point.
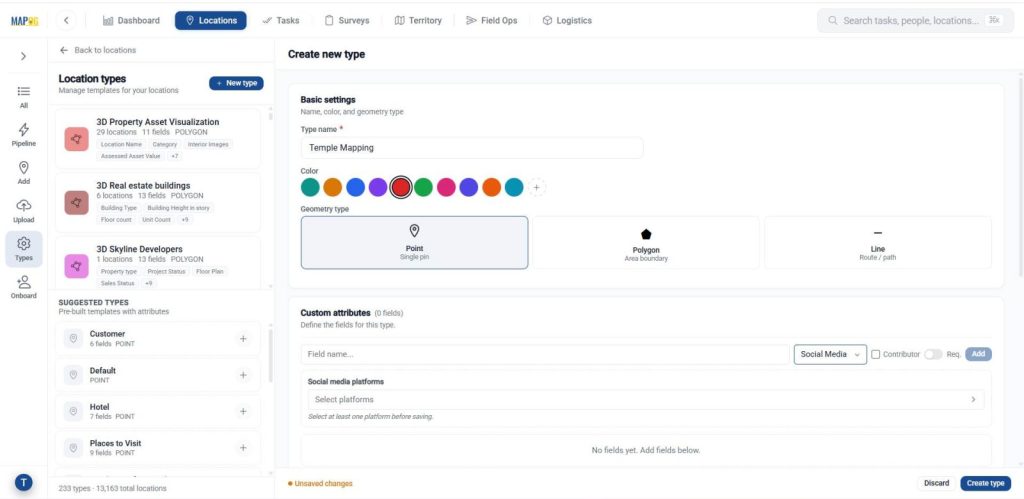
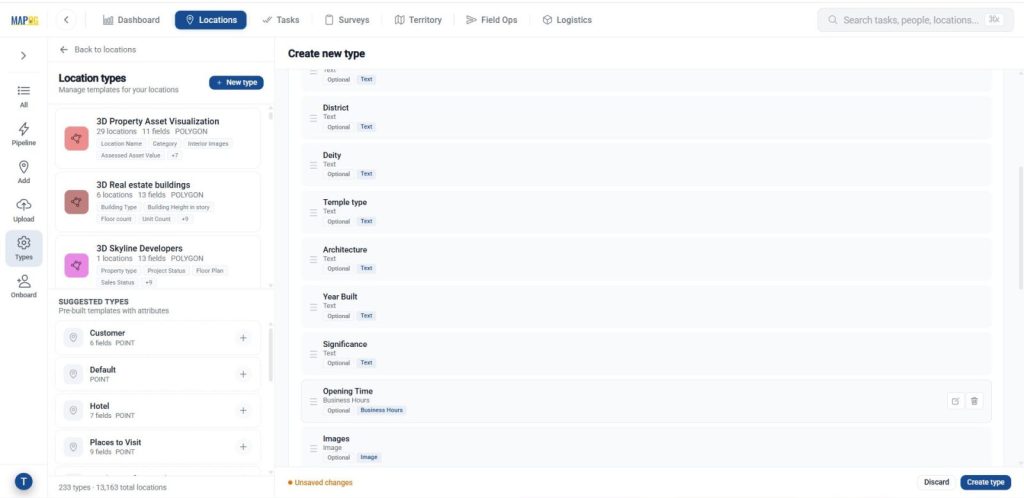
Add attributes that define your point such as location, deity, template type, year build and signature using text, number, dropdown, or multi-select fields based on the information you want to capture. Once configured, then click create type to save the template.
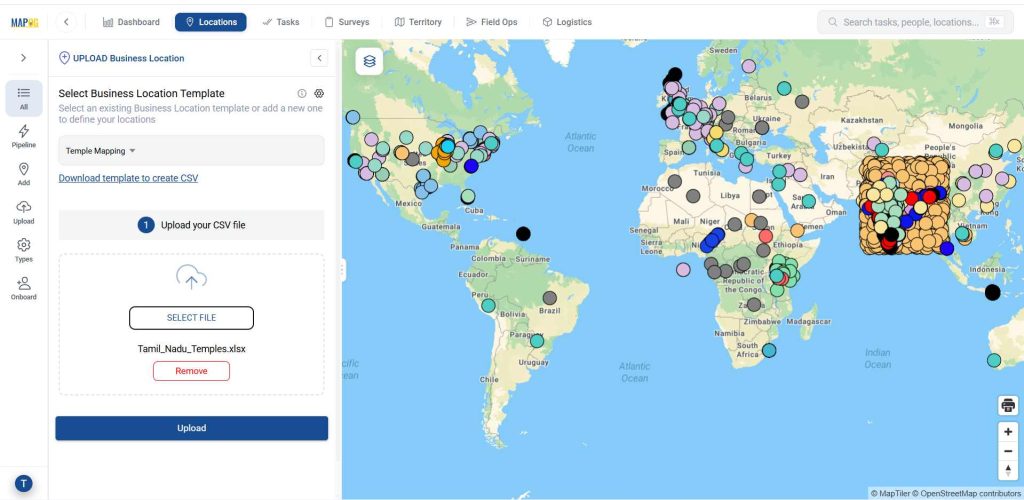
Now go to the Upload option, select the created template from the dropdown and upload your CSV/Excel file, then give upload.
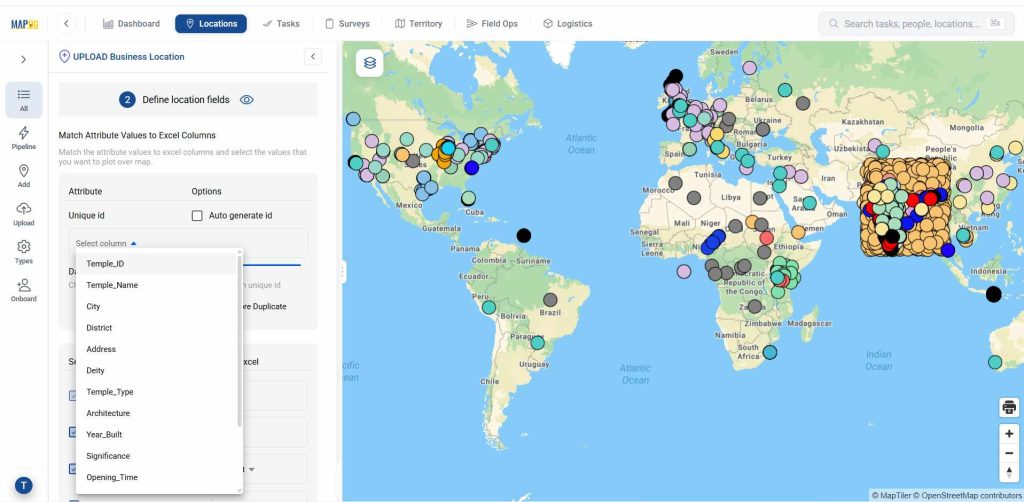
Assign a Unique ID to uniquely identify every location, helping prevent duplicates and enabling easy tracking and updates.
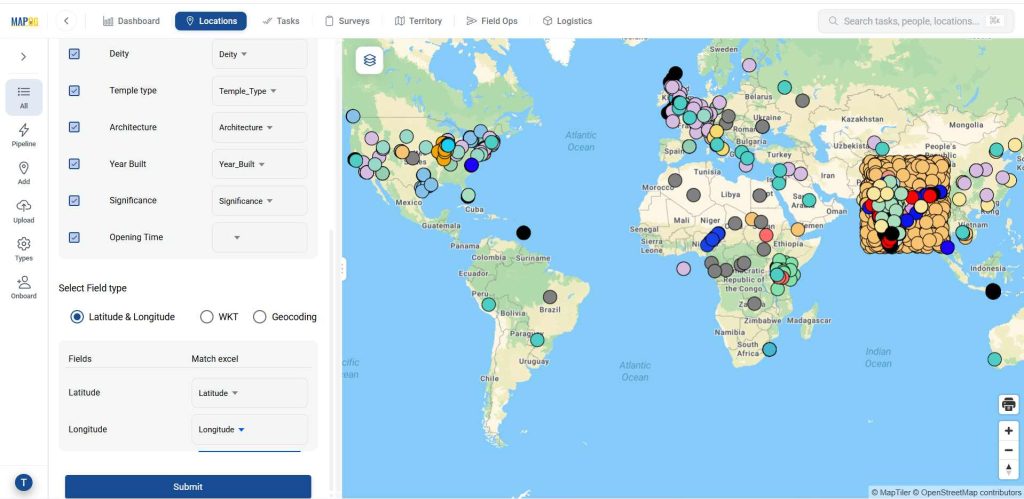
Later match the location, deity, template type, year build and signature column with excel attributes. In the select field type give latitude in first column, give longitude in second column, then give submit.
Step 2 : Create a New Map
Come to the dashboard then, Click on Open Workspace in the Create & Publish section — where you can build interactive maps, add layers, run spatial analysis, and publish shareable maps using rich GIS datasets.
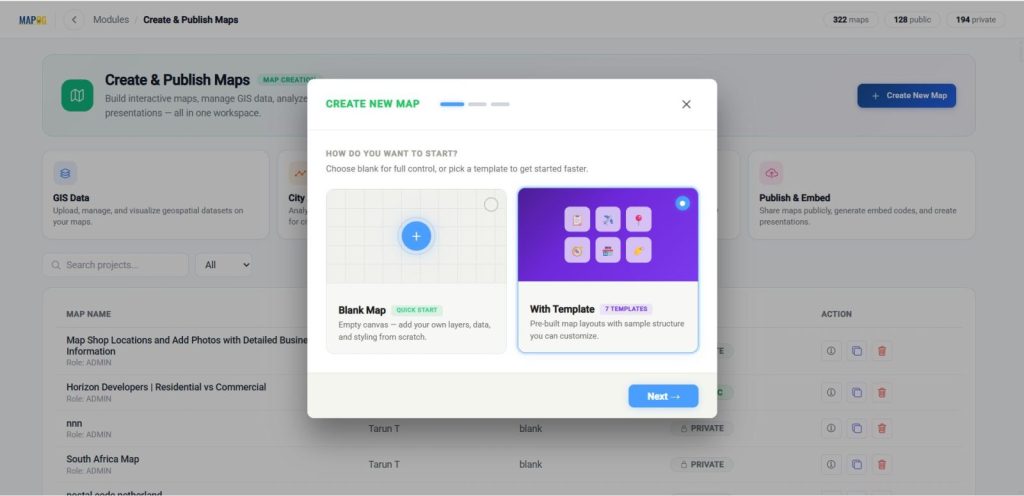
Click on Create New Map — choose Blank Map to start from scratch with your own data and styling, or With Template to use a pre-built layout you can quickly customize. Now click on the “with template” option.
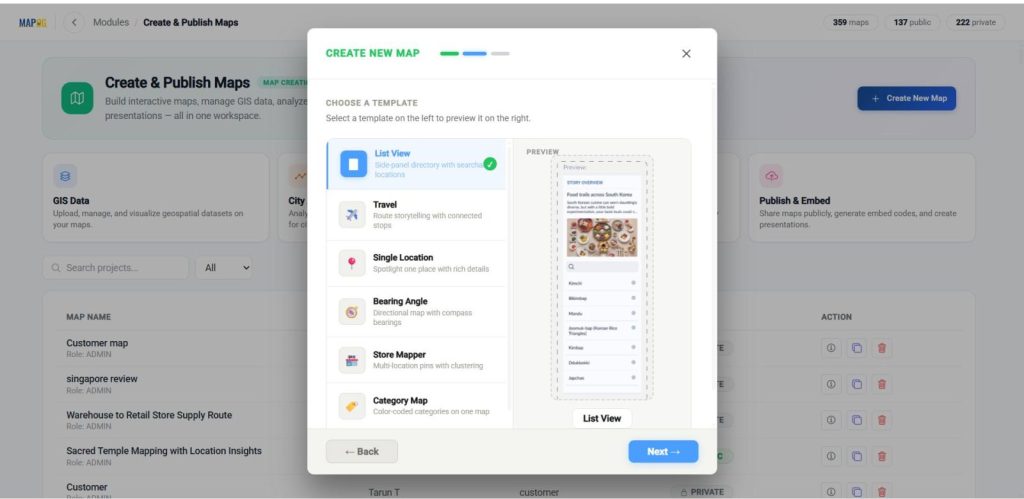
Then select with template option like list view, and click next.
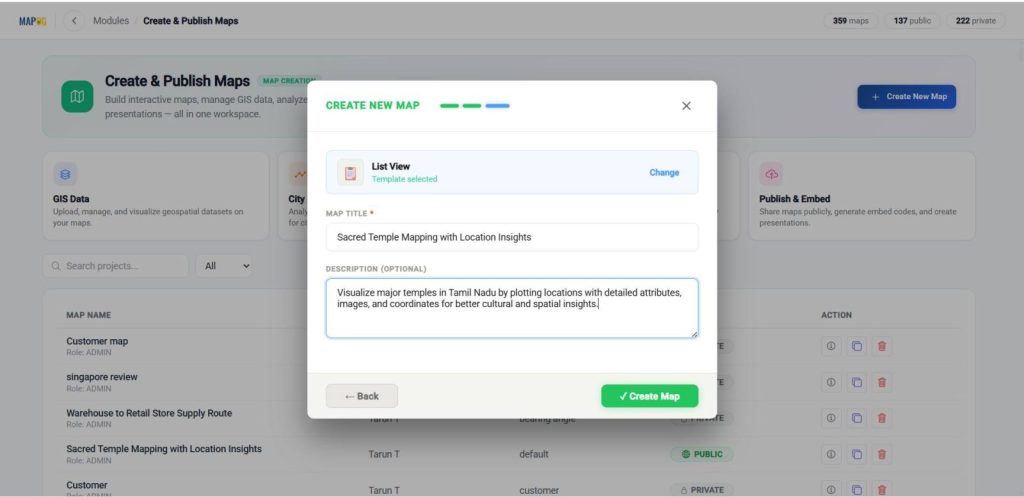
Then provide a title, description, then click create to initialize your project.
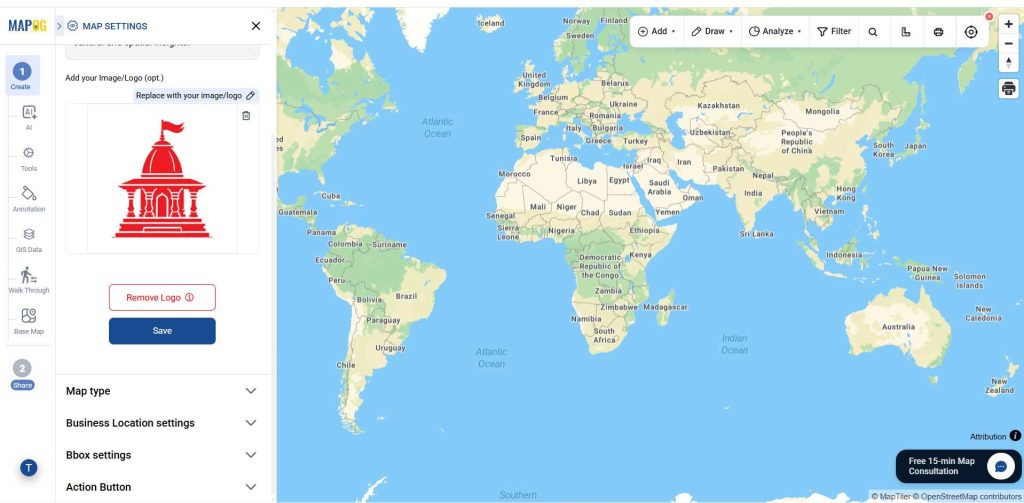
Finally, after coming to the interface, open the settings.
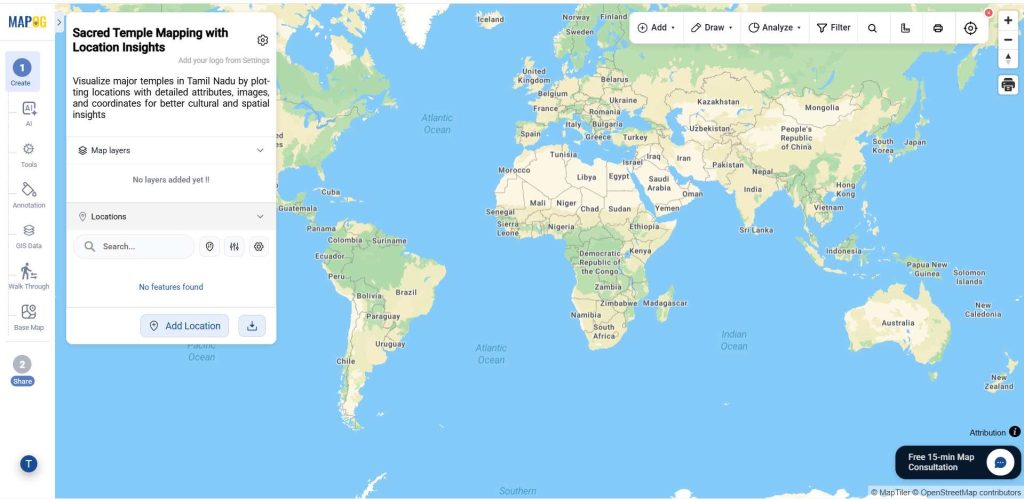
Browse & upload your logo, and save your changes.
Step 3 : Add Locations to Your Map
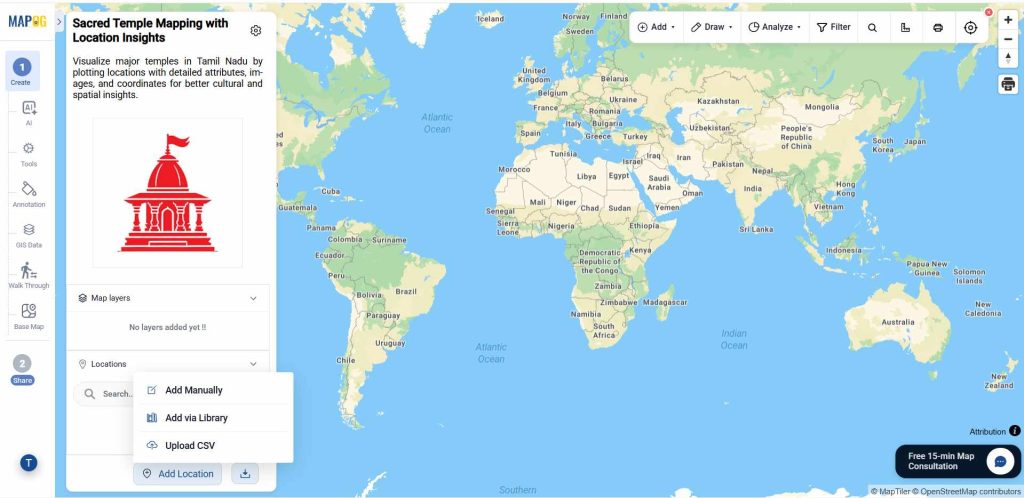
Now, click the Add location, then select the Add via library option.
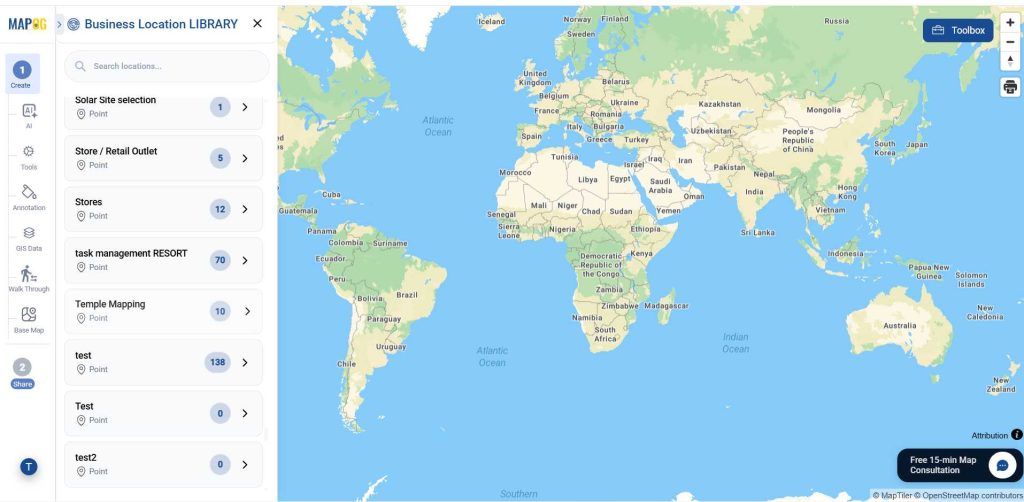
In the Library, look up the business template you created earlier.
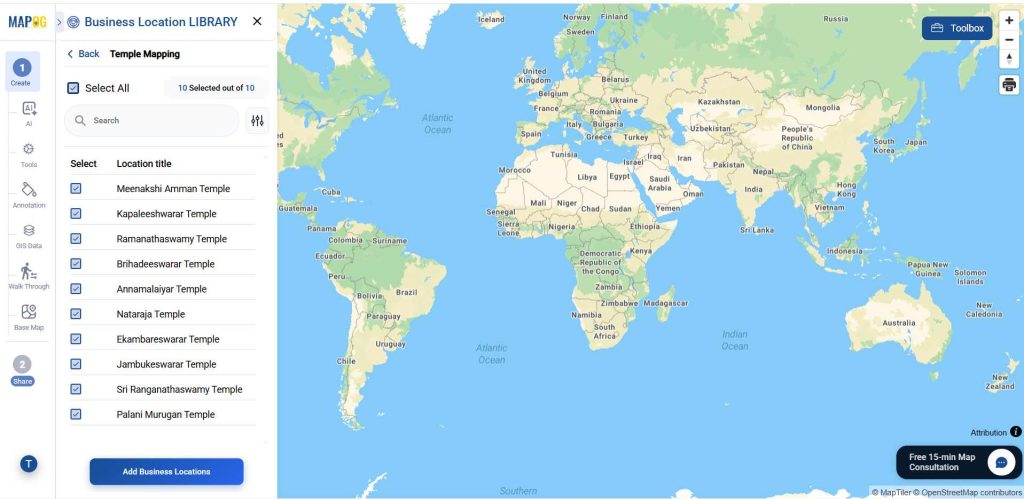
Click on the locations you want to add one by one, or use Select All to include every location at once. Then, click Add Business Locations.
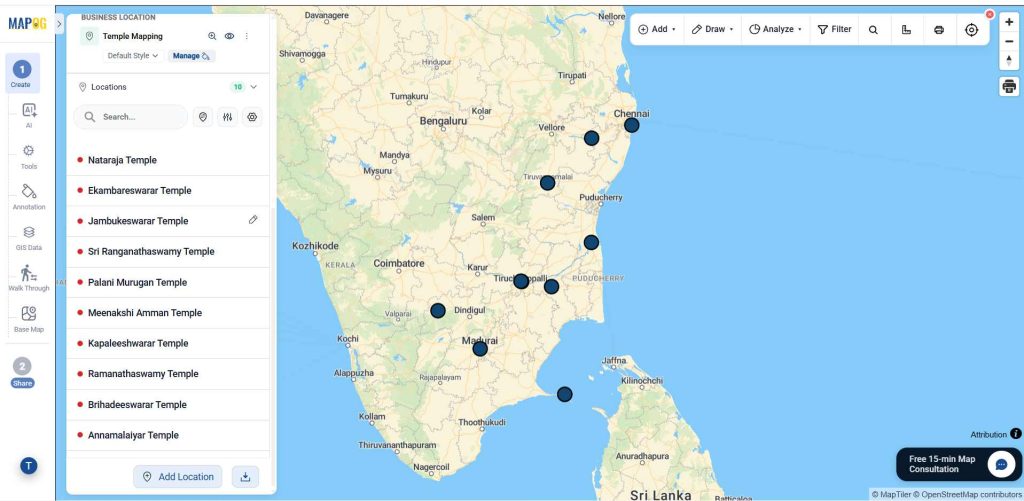
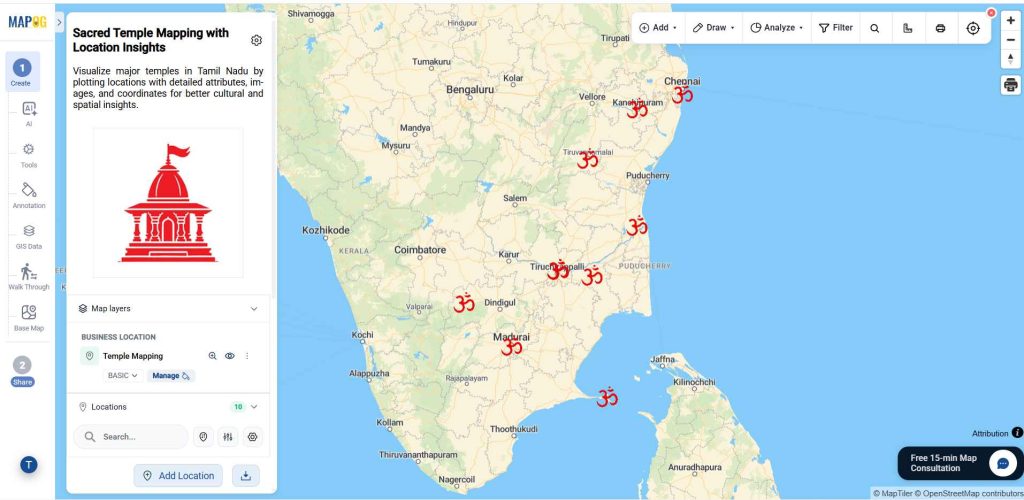
The selected points will now be displayed on the map.
Step 4 : Style and Edit the points
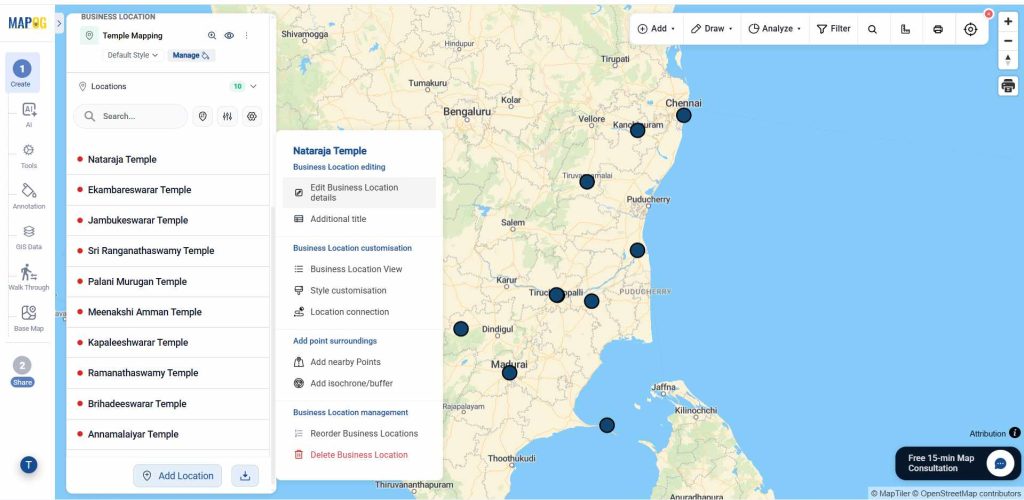
Now click on the edit business location details option.
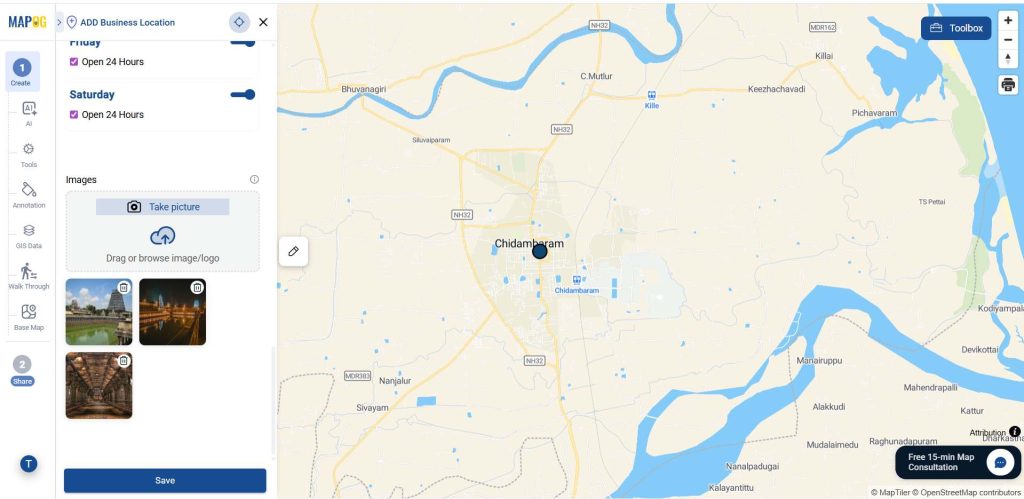
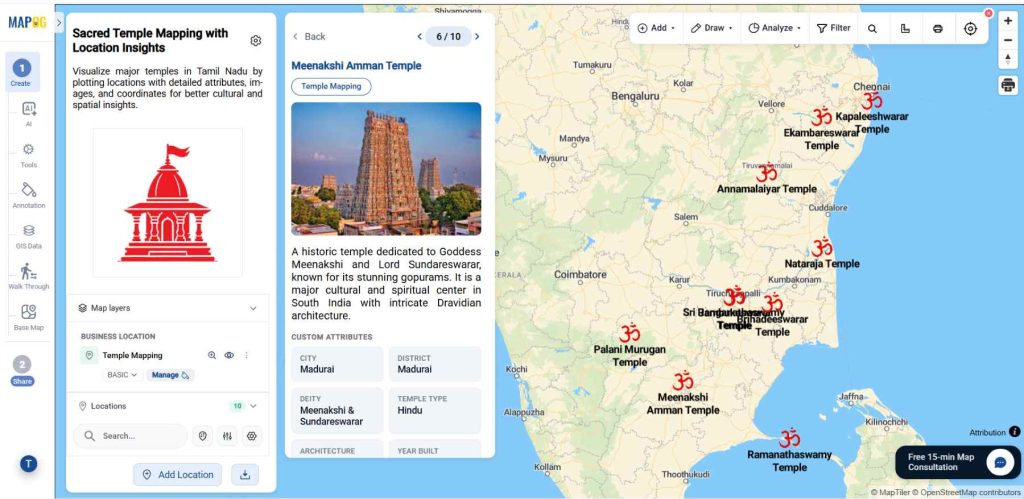
Add description and images and other required details to complete the attributes and follow the same procedure for other points.
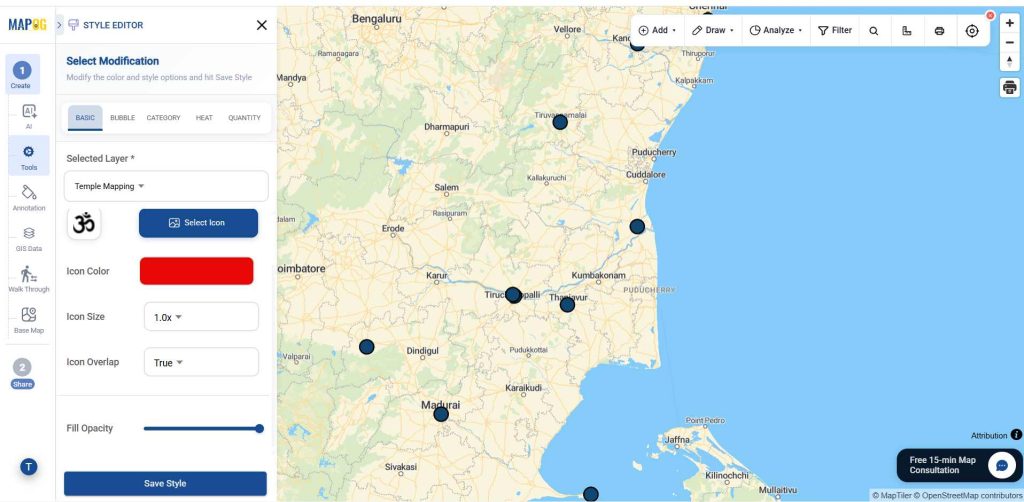
Finally, click Add Layer Style to customize how the point appears.
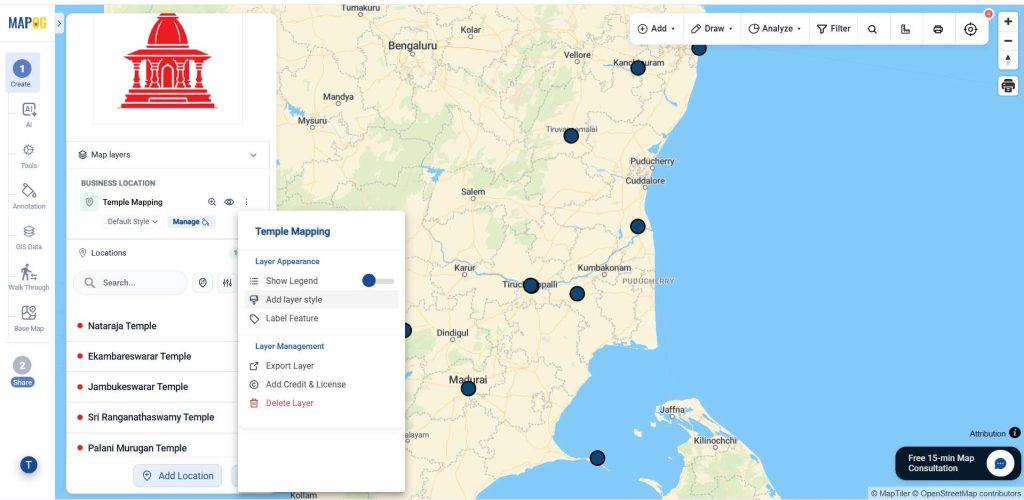
Select an icon and colour, and save the style.
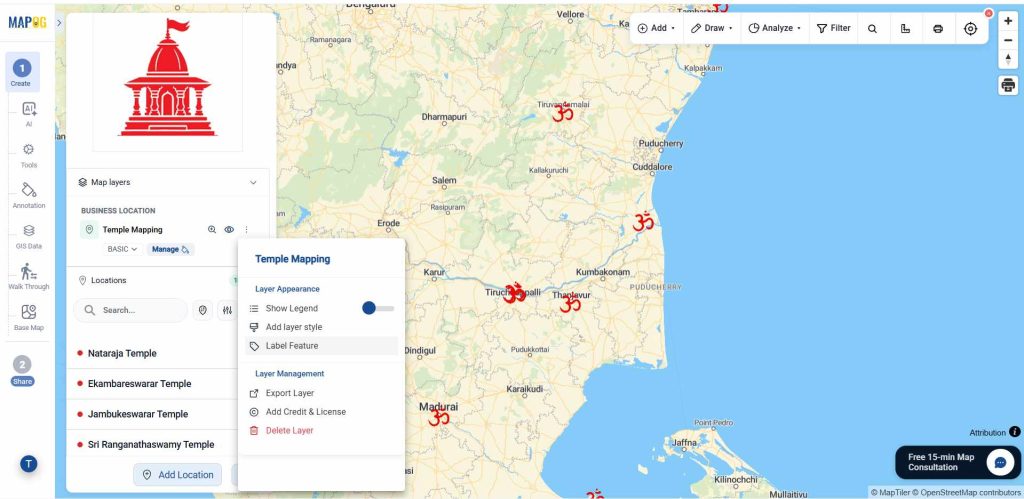
Now, select the label feature option.
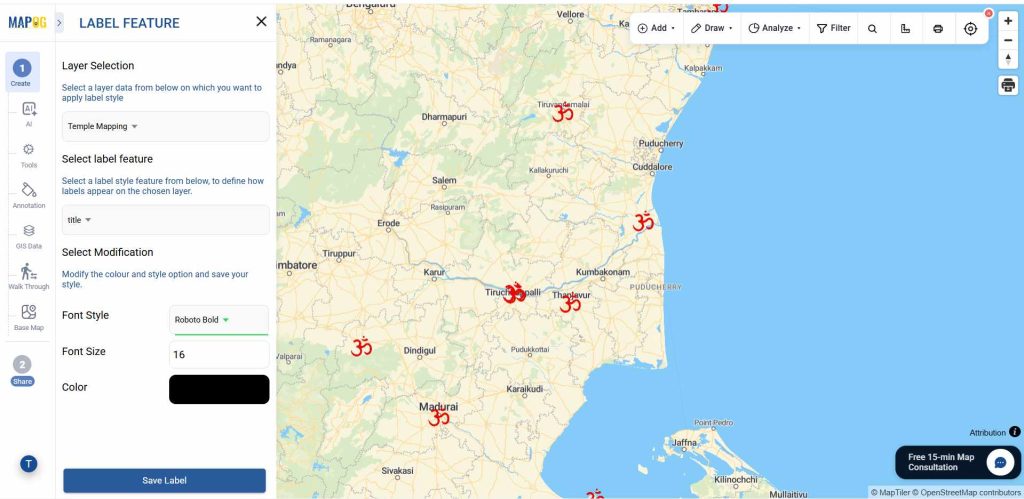
In the select label feature give the layer which you want to label, then select the suitable font and colour, finally give the save label.
Step 5: Preview & share option
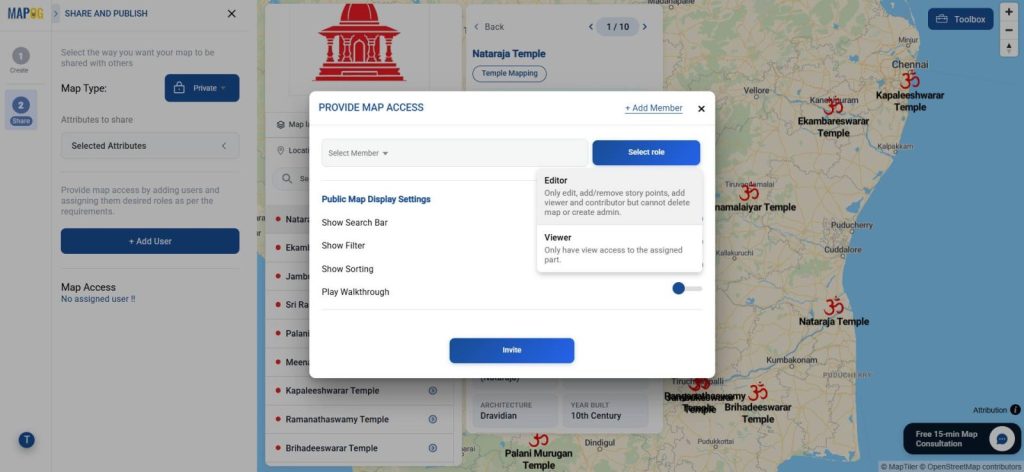
Once your map is ready, go to Preview & Share. Use Add User to invite collaborators and assign roles—Editors can manage content and points (no admin/delete rights), while Viewers have view-only access.
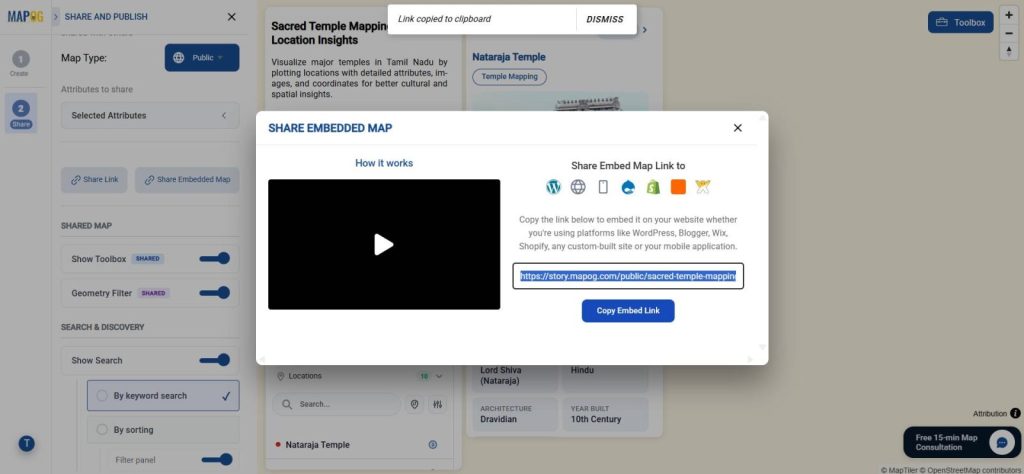
Switch the map from Private to Public to enable sharing. Use the Share Link for quick sharing via email, chat, or social media. To display your map on a website, select Share Embed Link and use the Embed Map option.
Industrial Use and Benefits of Plot Your Points on a Map and Add Details with Images
Plotting points on a map with images is widely used across industries like real estate, construction, retail, utilities, and logistics to visually organize and manage location-based information. Teams can mark specific sites, assets, or points of interest and attach images and details for better context. This helps in site inspections, property showcasing, asset tracking, and field reporting. It reduces miscommunication, improves data accuracy, and allows teams to understand on-ground conditions without being physically present, leading to faster and more informed decision-making.
Conclusion
Plotting points with images transforms maps into interactive, information-rich tools. With MAPOG, you can easily add locations, attach visual details, and create a centralized view of your data. This makes it easier to communicate insights, monitor activities, and share real-time updates, ultimately improving efficiency and collaboration across teams.