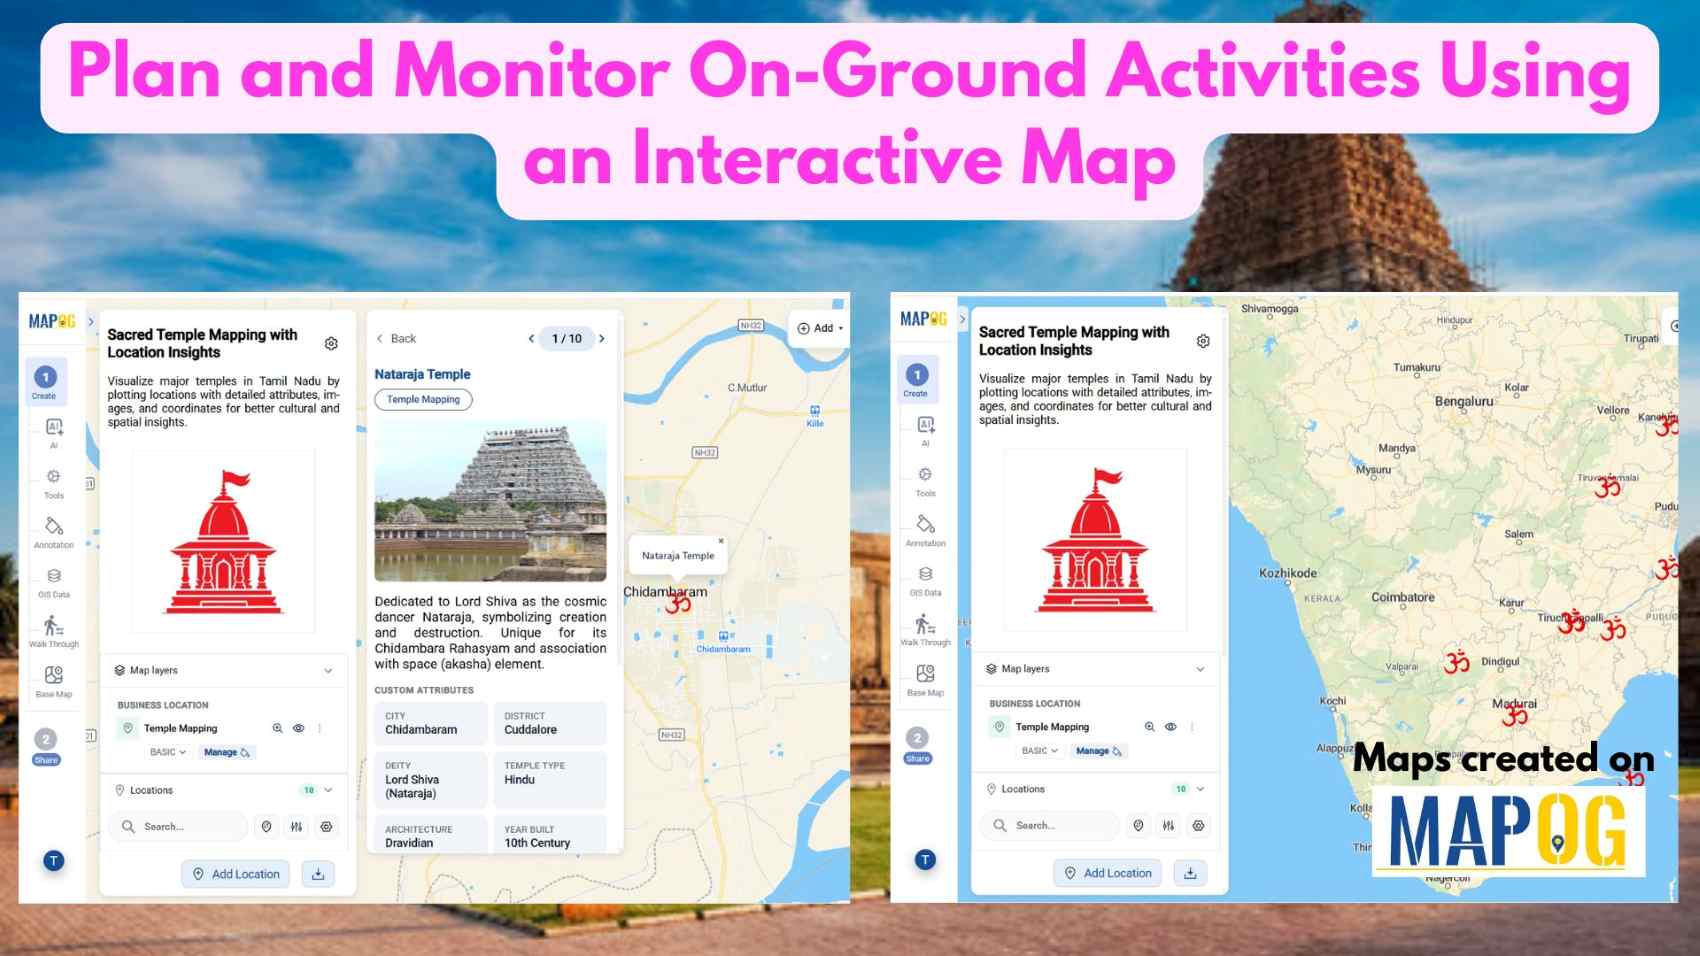
Plot Your Points on a Map and Add Details with Images
In today’s data-driven workflows, simply listing locations in spreadsheets is no longer enough. Teams need a visual and interactive way to understand, manage, and communicate location-based information effectively. Whether it’s for field surveys, asset tracking, or site inspections, relying on disconnected tools often leads to missing context and delayed decisions. With MAPOG, you can Plot … Read more