In industries like real estate, construction, infrastructure planning, campuses, and tourism, clearly defining areas on a map is essential for better visualization and decision-making. Interactive 3D property boundaries help transform flat maps into more engaging and easy-to-understand visual experiences.
With MAPOG, you can create interactive 3D boundaries, customize their height and styling, organize locations, and build shareable property maps without complex GIS tools or coding.
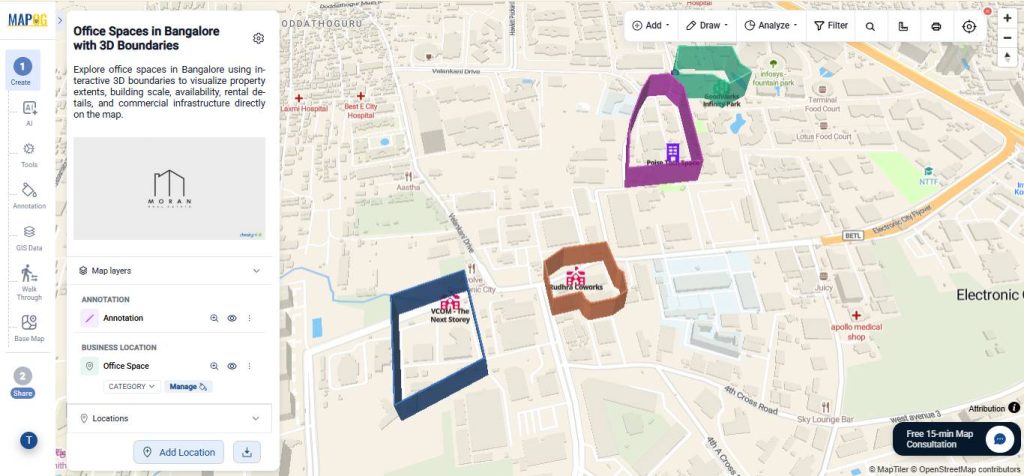
Key Concepts on How to Draw Interactive 3D Property Boundaries
Creating Interactive 3D Property Boundaries uses polygon-based annotations to visually define plots, land parcels, and zones on maps with customizable height, color, and opacity. Layered visualization improves spatial understanding, area comparison, and map presentation, making it useful for industries such as real estate, construction, infrastructure planning, campuses, tourism, and land management. Additional features like CSV-based bulk location upload, labels, category styling, and grouping help organize large datasets and create more interactive, easy-to-explore maps.
Step by Step Process on How to Draw Interactive 3D Property Boundaries
1. Create and Upload Property Locations
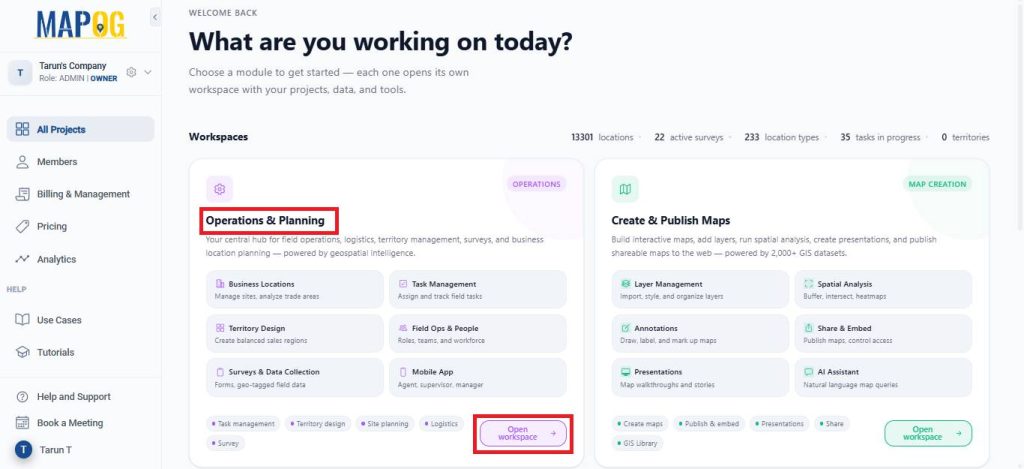
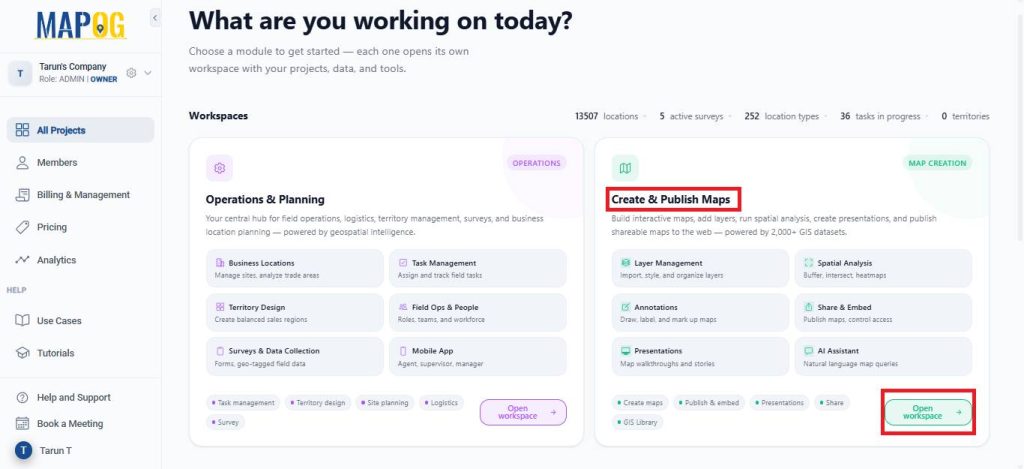
Open MAPOG and go to Open Workspace under the Operations & Planning section.
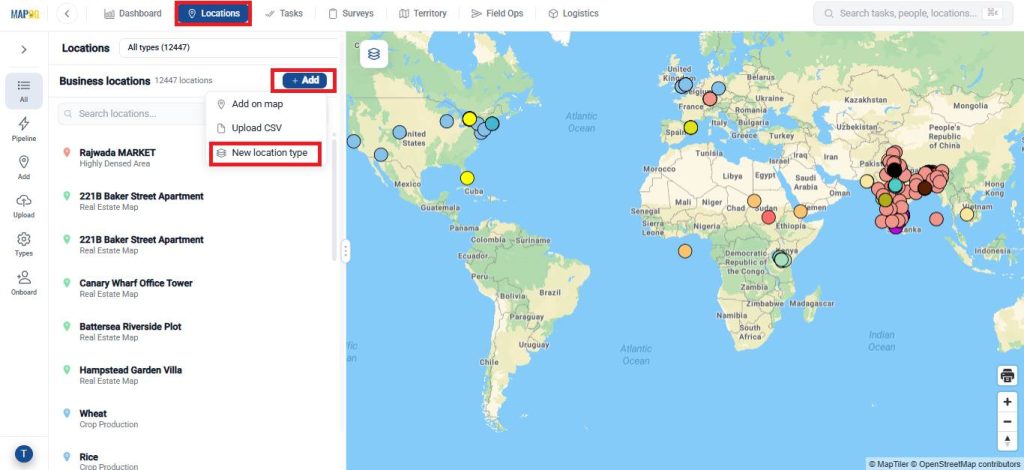
Navigate to Locations and click Add, then select New Location Type to create a Business Location Template.
Enter a name, choose a suitable colour, and set the geometry type as point.
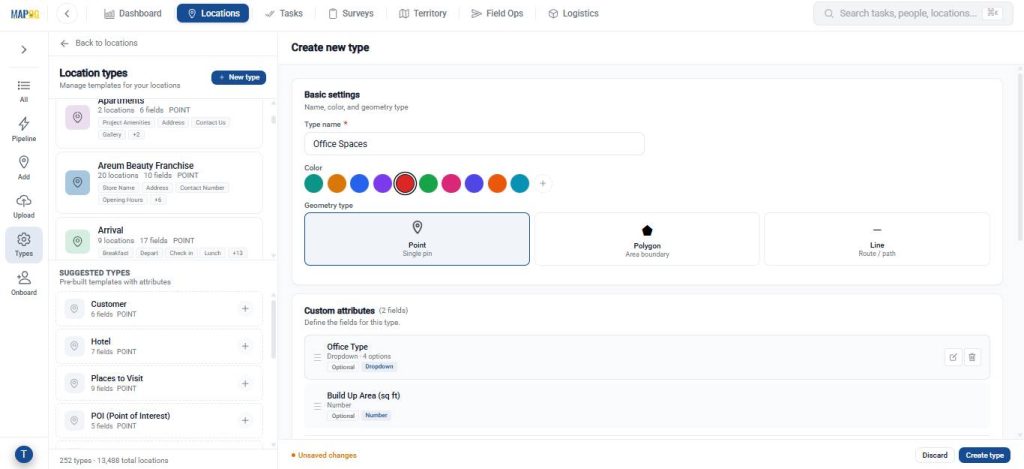
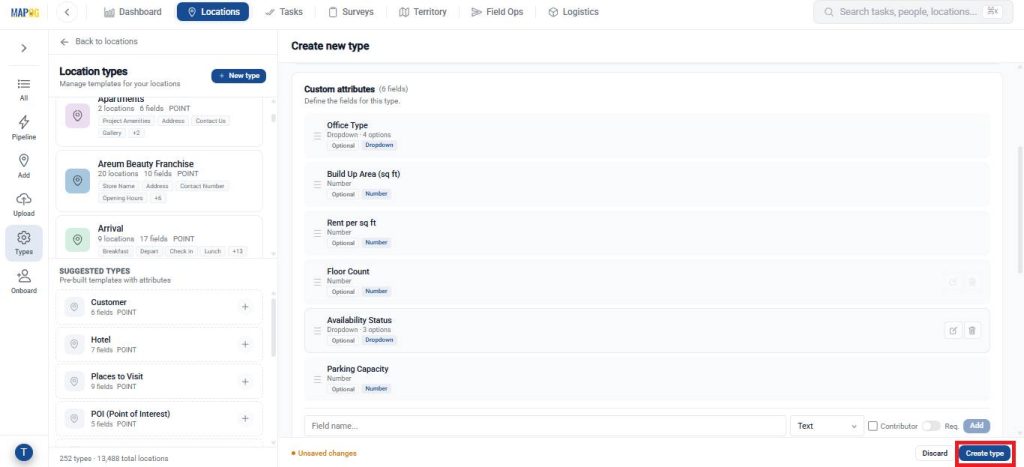
Add attributes that define your point using text, number, dropdown, or multi select based on the details you want to capture, then click create type to save the template.
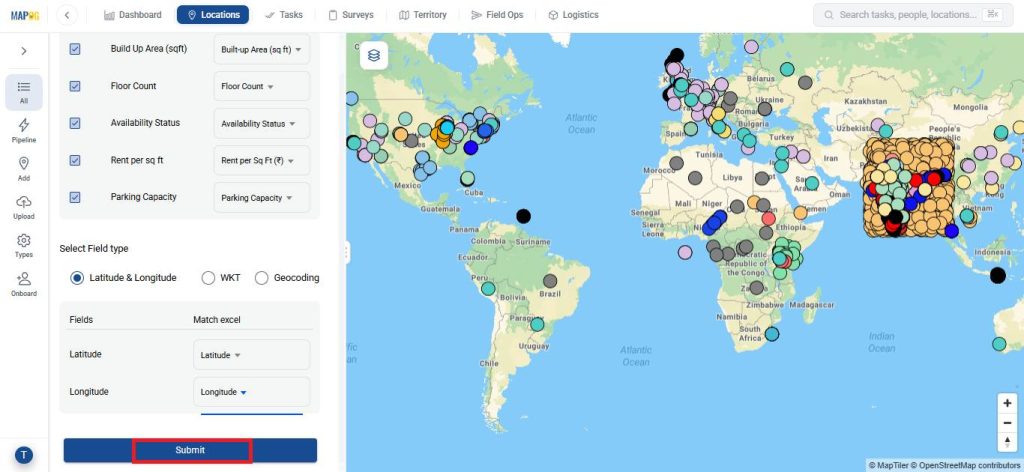
Next, go to Upload, select the created template, and upload your CSV or Excel file.
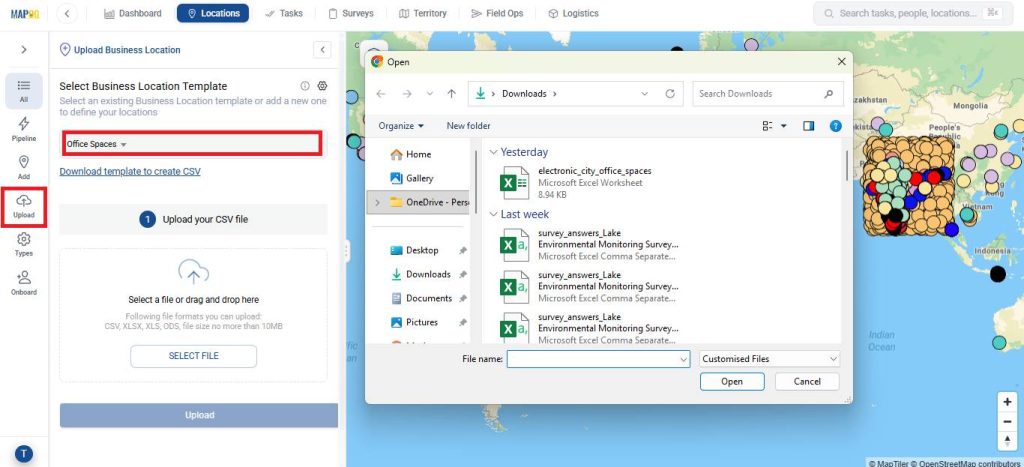
Assign a Unique ID to each location to avoid duplicates and allow easy updates.
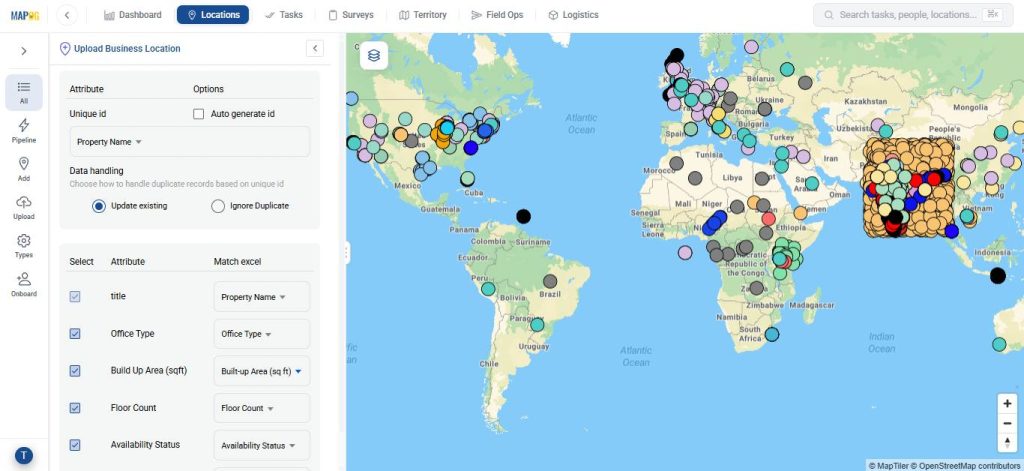
Match the attributes with excel and field type to latitude and longitude. Lastly, hit submit.
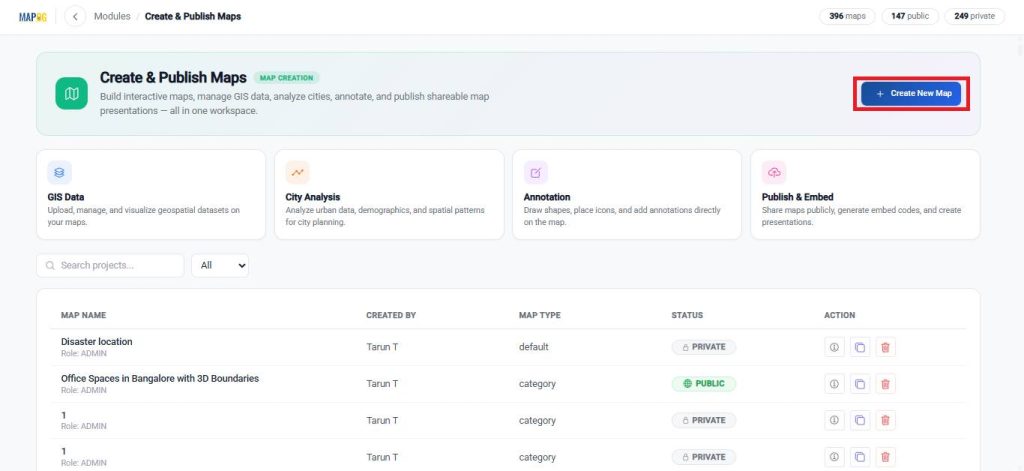
2. Create a New Map
Open MAPOG and go to Open Workspace under the Create and Publish section.
Click on Create New Map.
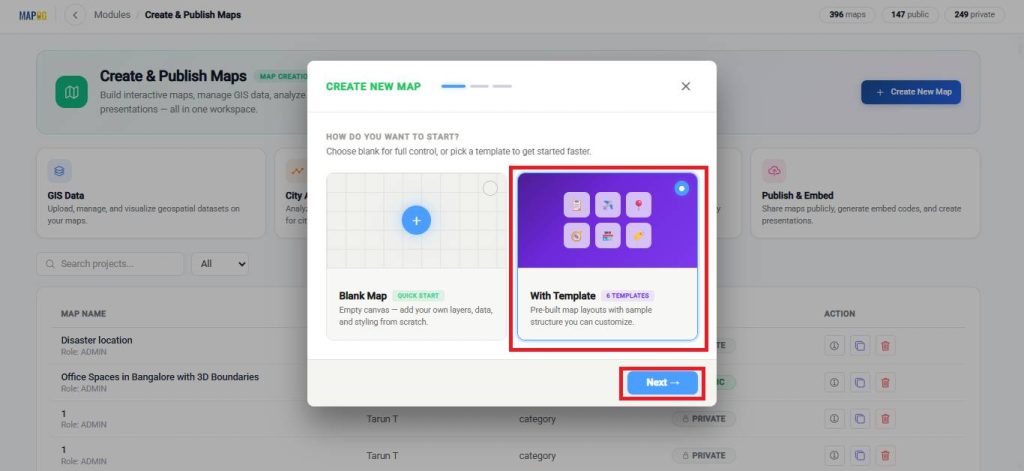
Then, select the Template option and proceed to the next step.
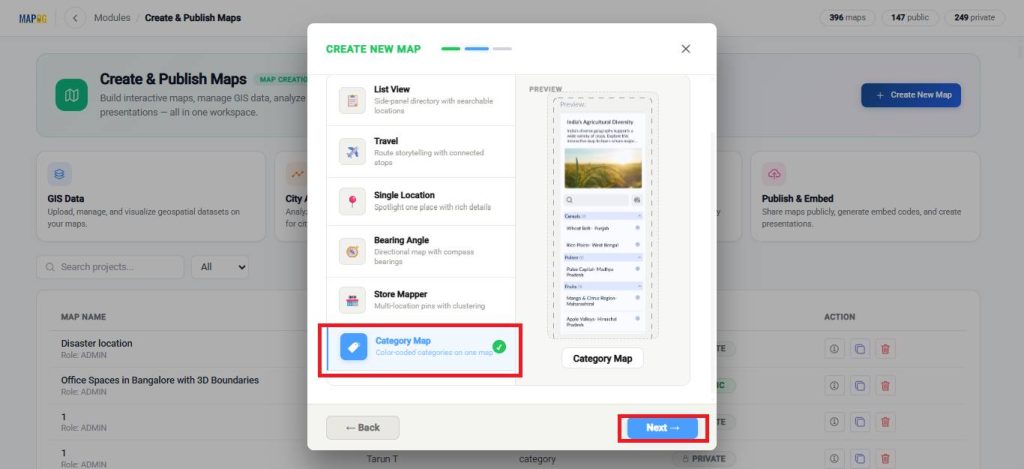
Choose Category template and continue.
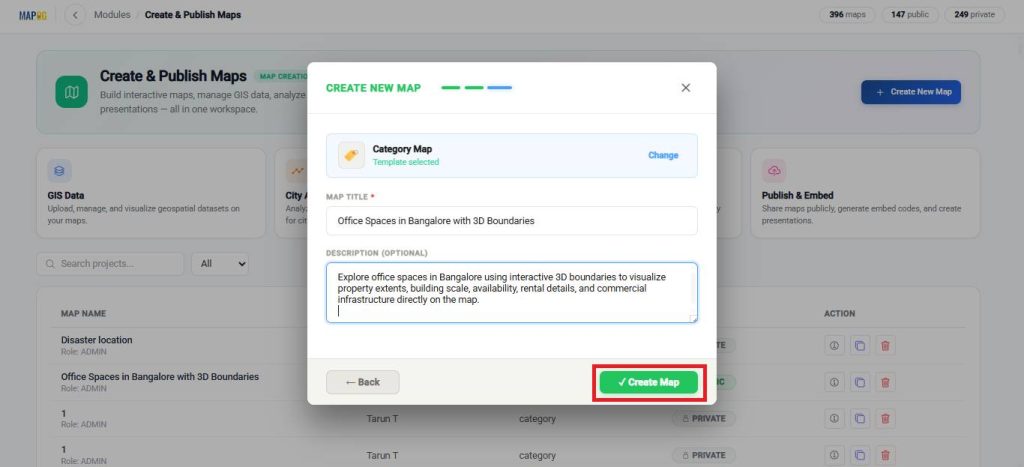
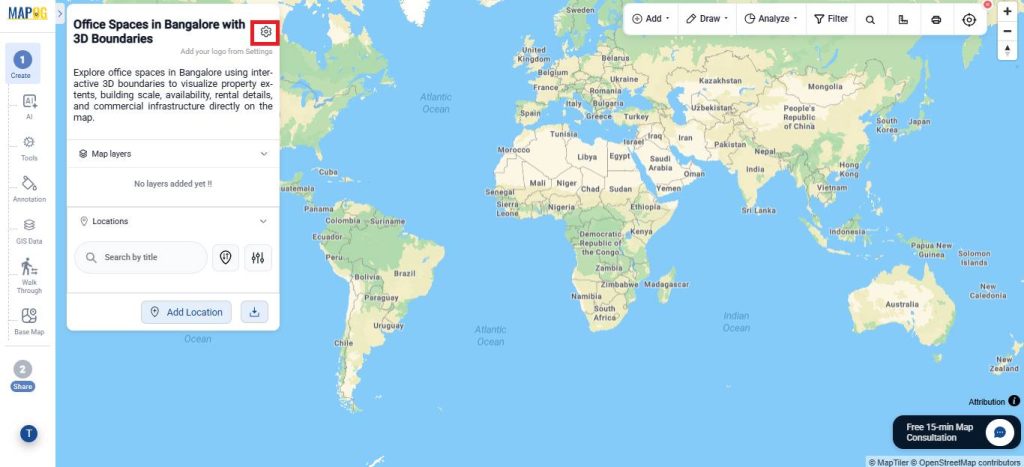
Enter a title and a brief description for your map.
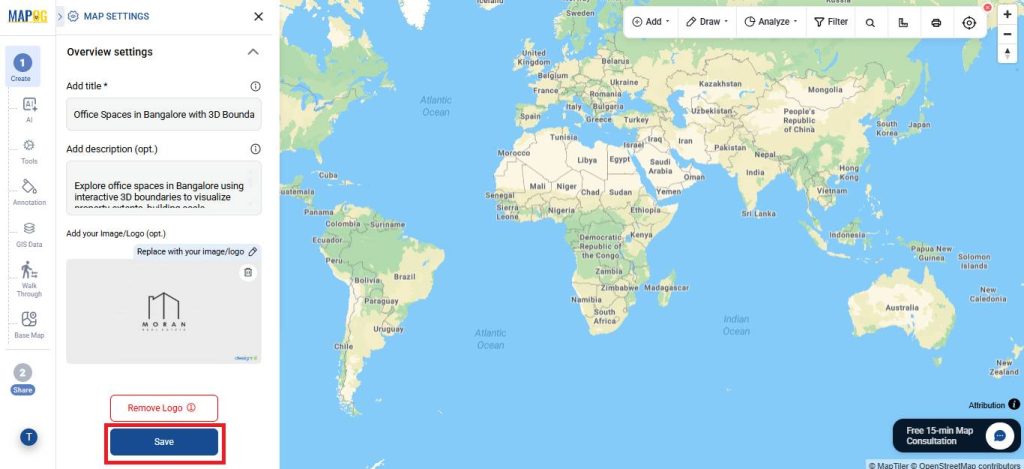
Finally, open the settings, upload your logo, and save your changes.
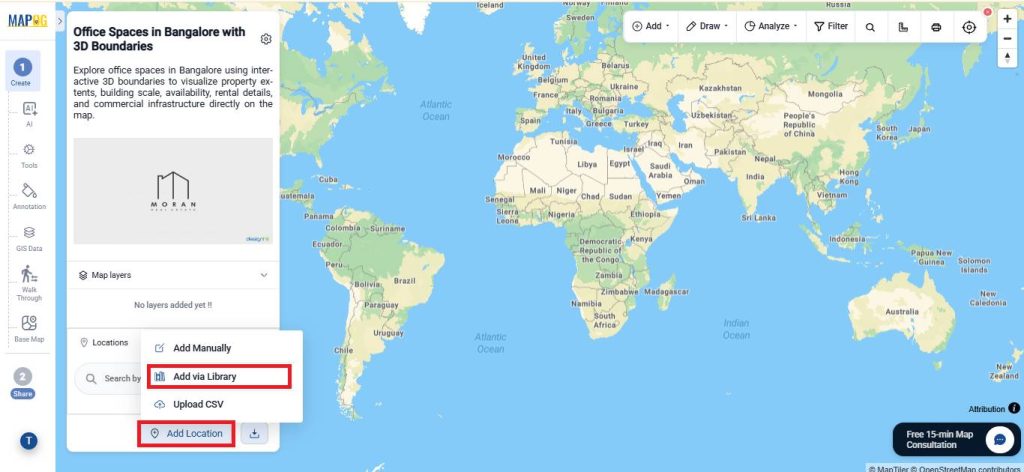
3. Add Locations to Your Map
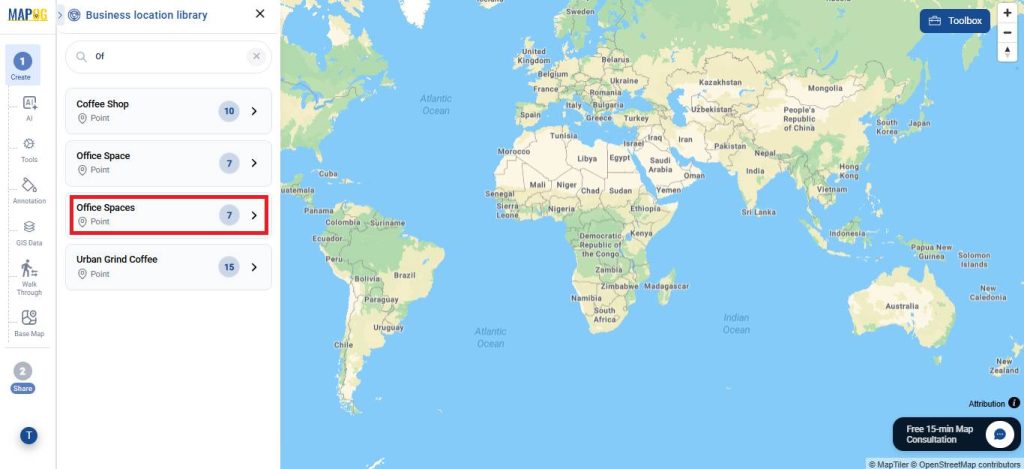
Now, select the Add Location option and choose Add via Library.
In the library, search for the business template you created earlier.
Select the locations you want to add by clicking on them individually, or choose Select All to add every location at once. Then click Add Business Locations.
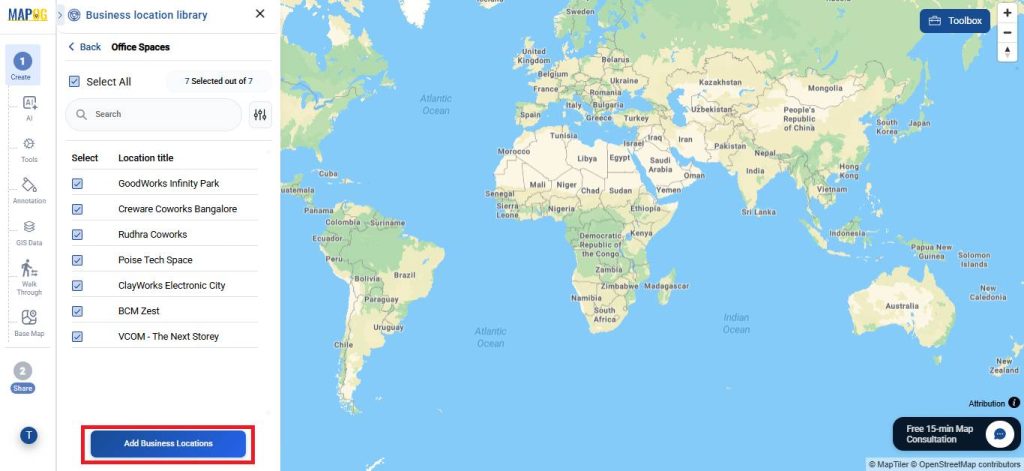
Your selected points will now appear on the map.
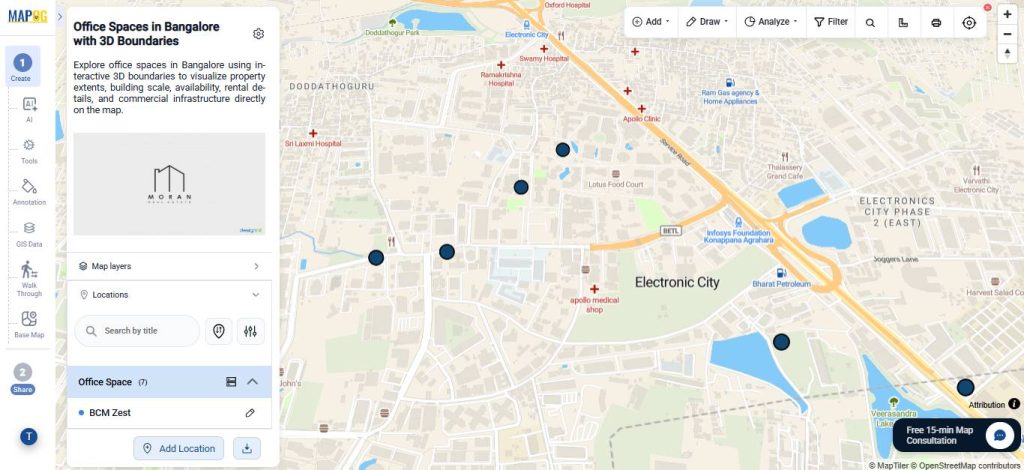
4. Edit Point Details
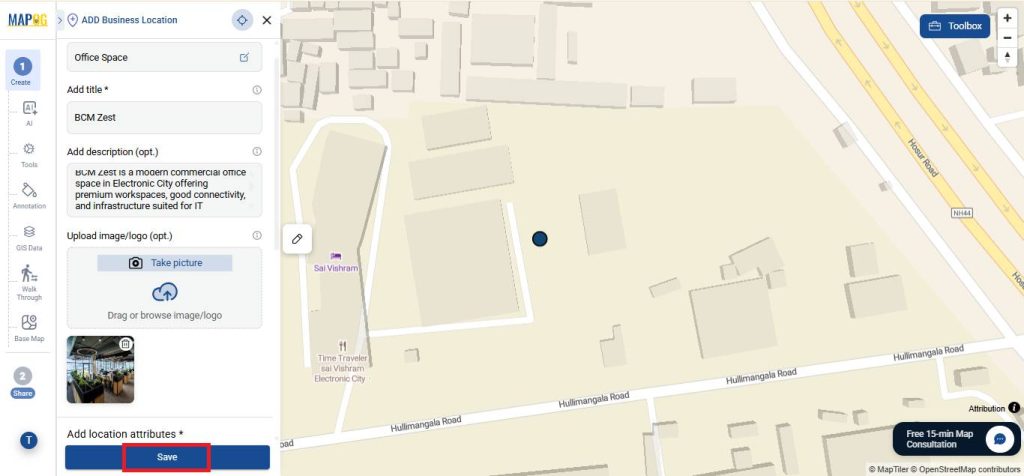
Then, click on any location and open the Edit panel to update business details.
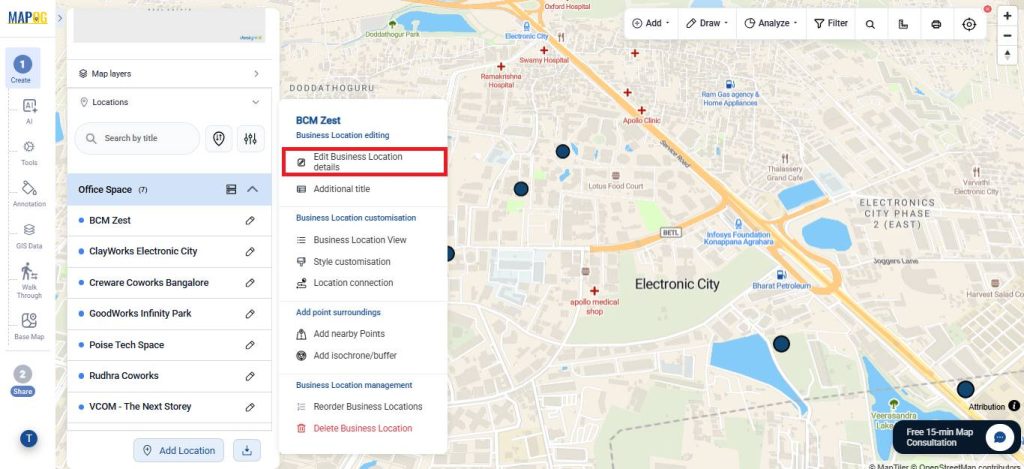
Add descriptions, images, and other relevant information to make every point more informative and visually clear. Repeat this process for all locations to keep your map well-structured and consistent.
5. Draw 3D Boundaries
Next, open the Annotation section and select 3D Boundary.
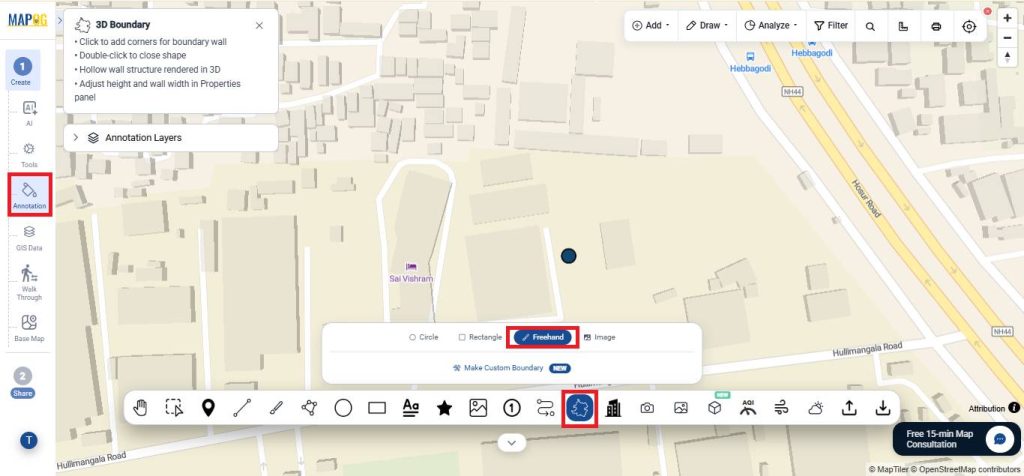
Use the Freehand tool to draw around the required area, then double-click to complete it.
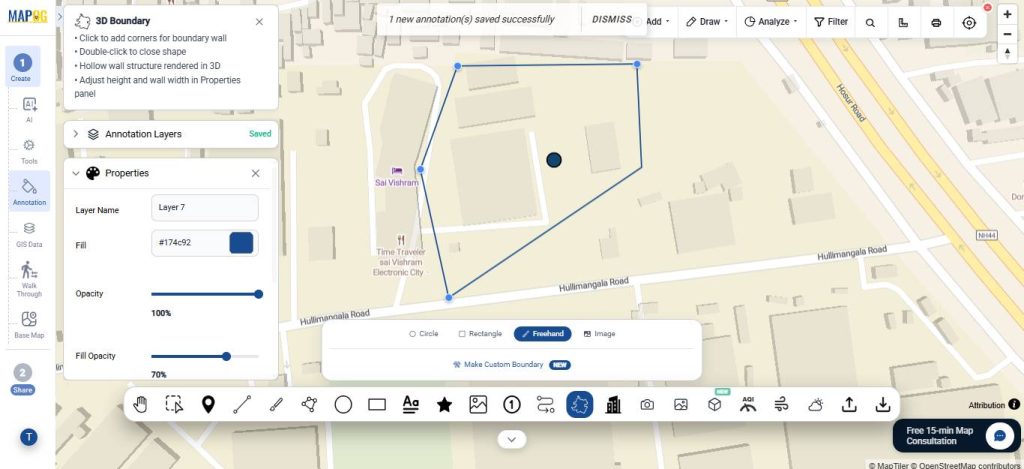
After that, the selected area will instantly appear as a 3D boundary. You can further customize it by editing the boundary name, colour, opacity, and height.
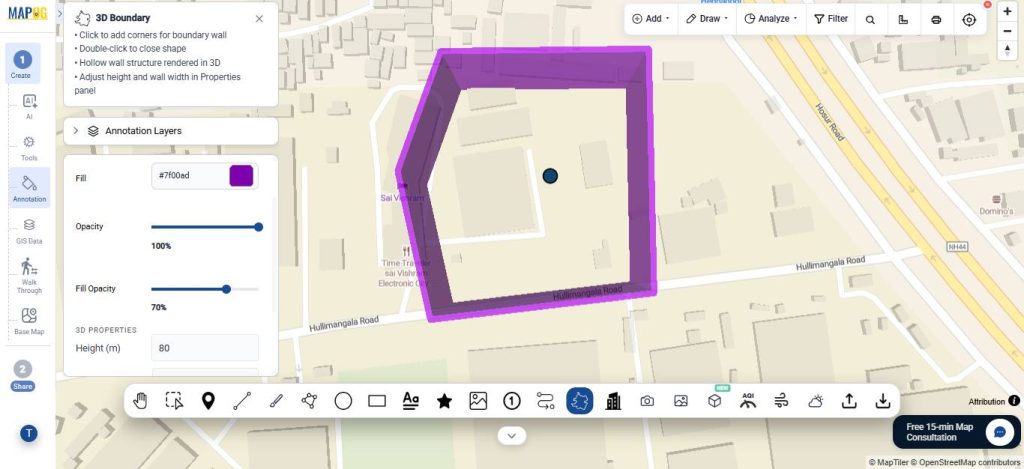
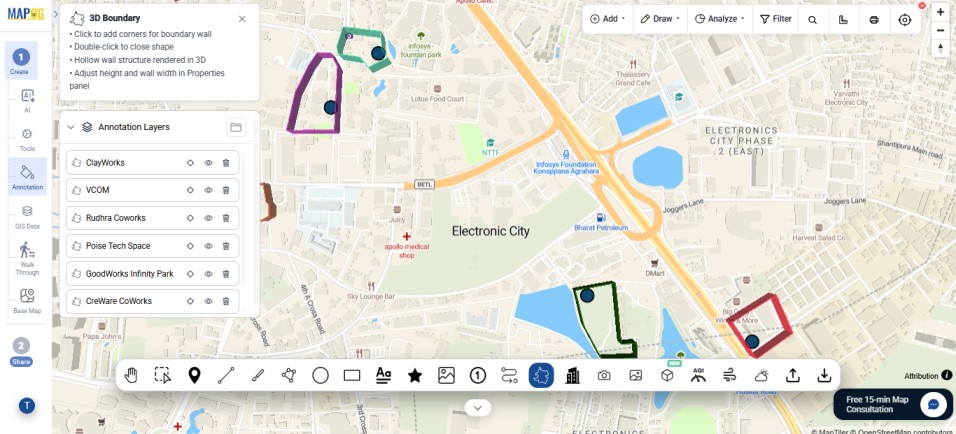
Then, repeat this for multiple zones to clearly separate and highlight different regions on the map.
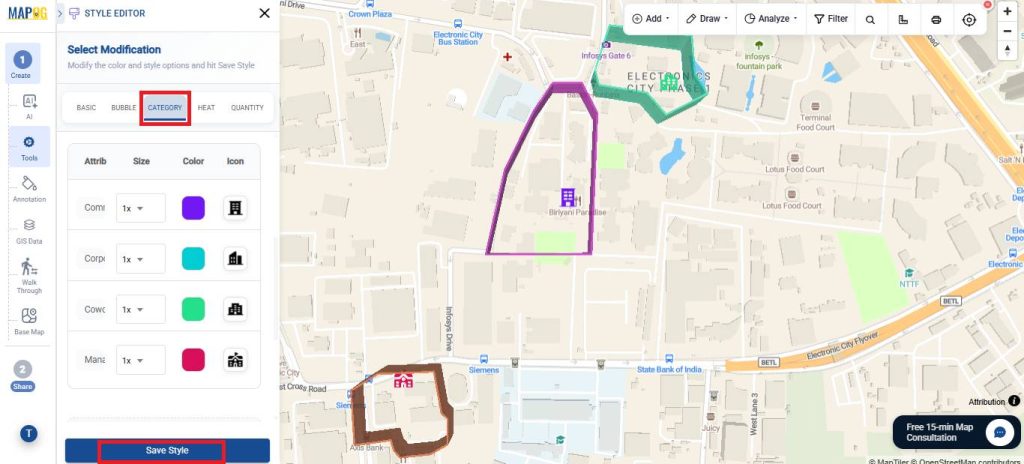
6. Customise icons and add labels
To make the map easier to understand, go to Add Layer Style and choose Category styling.
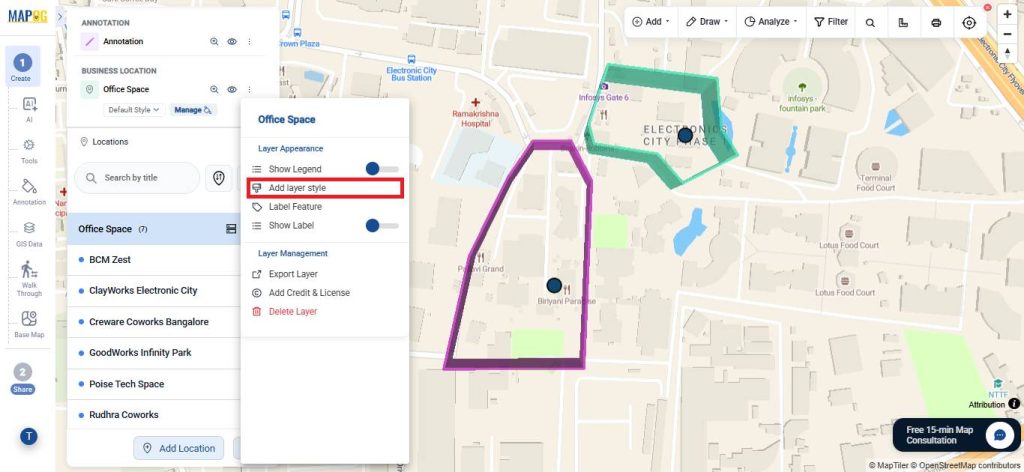
Assign different colours and icons based on attributes so locations can be visually distinguished at a glance.
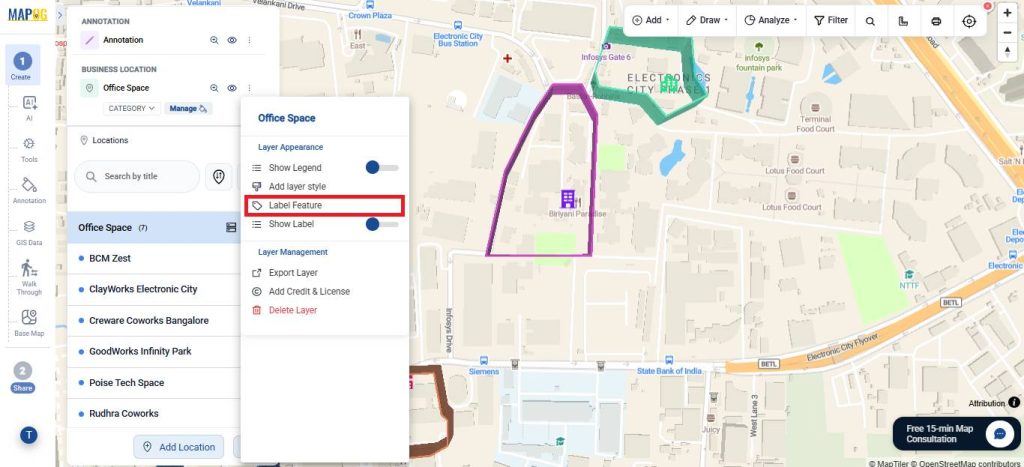
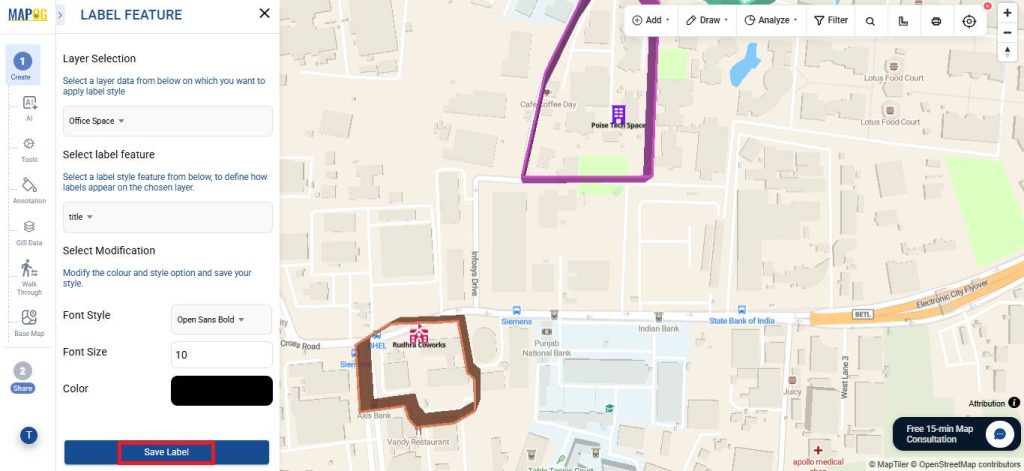
Then enable Label Feature to display names directly on the map, with options to customize the font, size, color, and style.
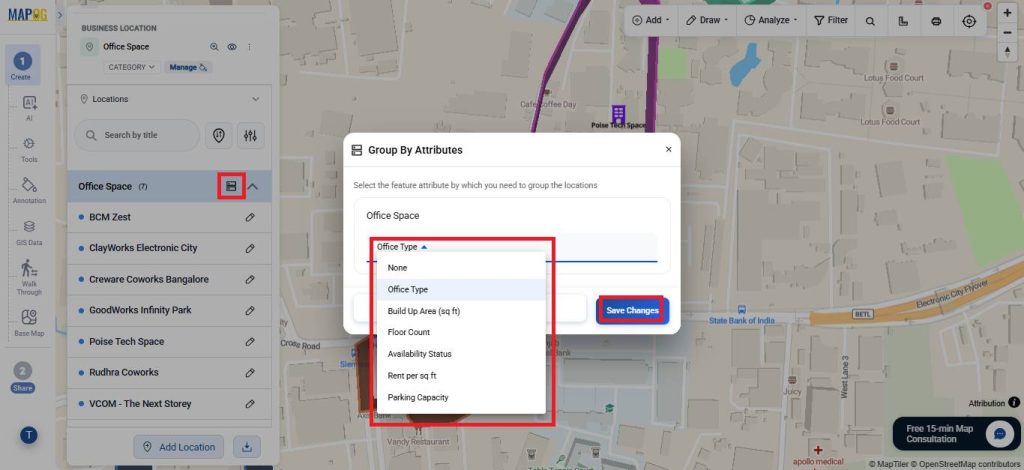
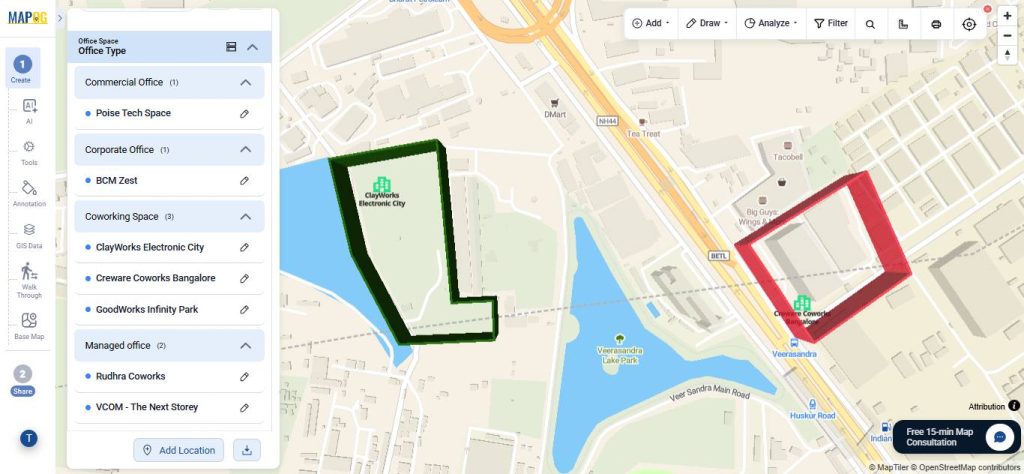
7. Group the points by attributes
You can also use the Group By feature to organize locations according to specific attributes, helping reduce clutter and making the map more interactive and easier to navigate.
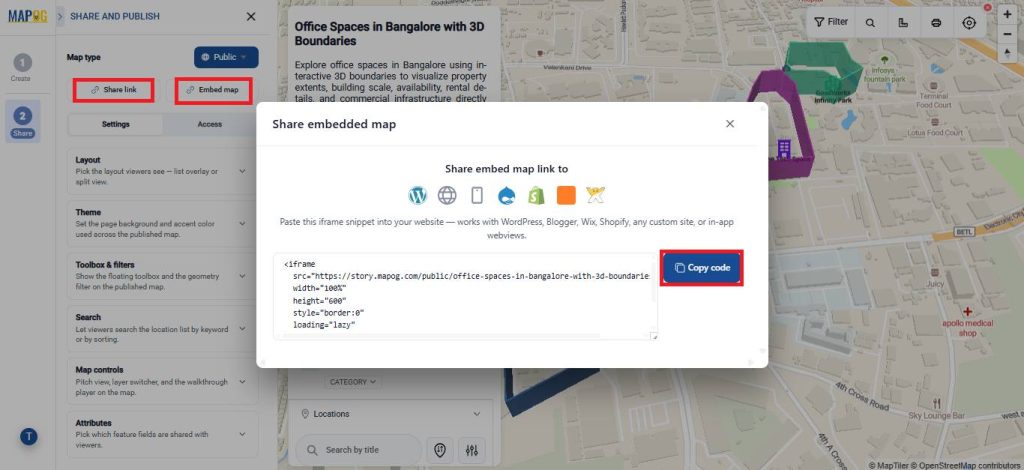
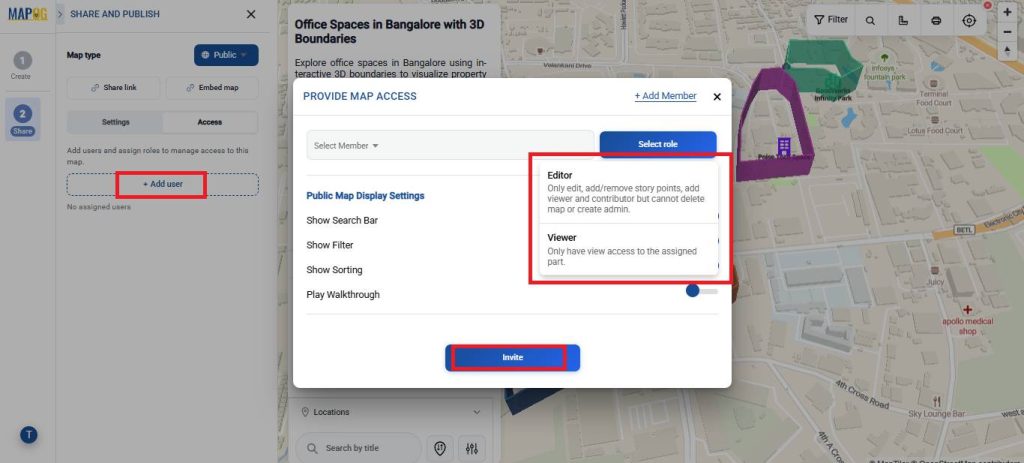
8. Preview and Share
Once everything is ready, open Preview & Share to configure sharing settings. Choose whether the map should remain Private or be accessible publicly. You can share it using a direct link, embed it into a website, or invite collaborators by adding users and assigning different access roles.
Real World Application
Interactive 3D property boundaries have applications across multiple industries where clear area visualization is important. In real estate, they help showcase plots, gated communities, and commercial properties more effectively. In construction and infrastructure planning, they can define project zones, work areas, and utility layouts. Campuses and business parks can use them for navigation and space management, while tourism projects can highlight attractions, heritage zones, and visitor regions. They are also useful in land management, survey mapping, urban planning, industrial site visualization, and environmental monitoring where understanding spatial boundaries and area coverage is essential.
Conclusion
In conclusion, interactive 3D boundaries make maps more visual, informative, and easier to explore across industries like real estate, construction, tourism, and infrastructure planning. With MAPOG, you can create customizable 3D property boundaries, organize locations, and build interactive maps that improve both visualization and communication.