Traditional maps often only display locations without explaining why those places are important. Important details are usually separated into reports, documents, or datasets, making geographic information harder to understand and less engaging for users. Annotated text on interactive maps solve this problem by adding labels, notes, and pop-ups directly onto the map. This makes information easier to explore and visually connects data with real-world locations.
With MAPOG, you can help create these interactive experiences by combining mapping with annotations, allowing users to present geographic information in a more clear, interactive, and engaging way.
Key Concepts on How to add Annotated Text on Interactive Maps
Key concepts in annotated text in interactive maps include visualization, context, interactivity, and accessibility. Visualization helps users understand geographic information more clearly by presenting data spatially rather than through plain text or tables. Context is important because annotations such as labels, notes, and pop-ups explain the significance of specific locations. Interactivity improves user engagement by allowing users to explore information directly on the map, while accessibility makes complex spatial data easier for both technical and non-technical audiences to interpret and use effectively.
Step by Step Process on How to add Annotated Text on Interactive Maps
1.Create a New Map
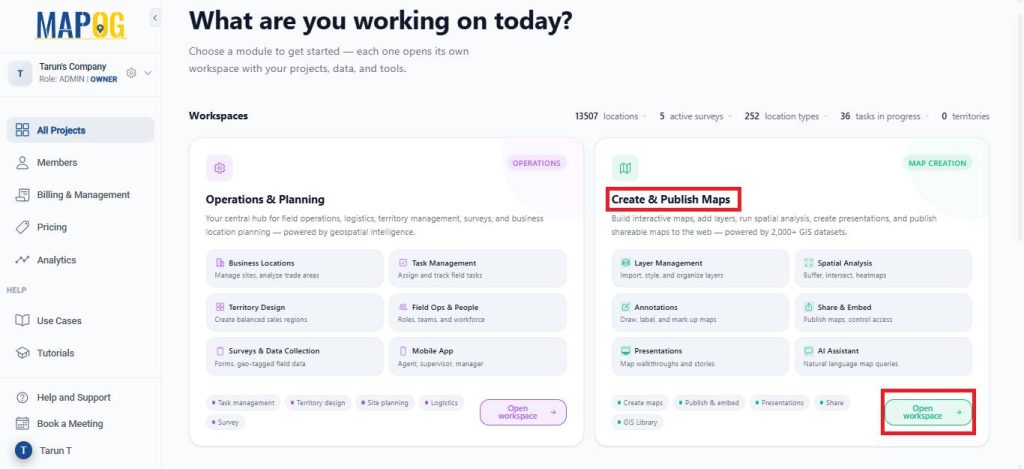
Open MAPOG and go to Open Workspace under the Create and Publish section.
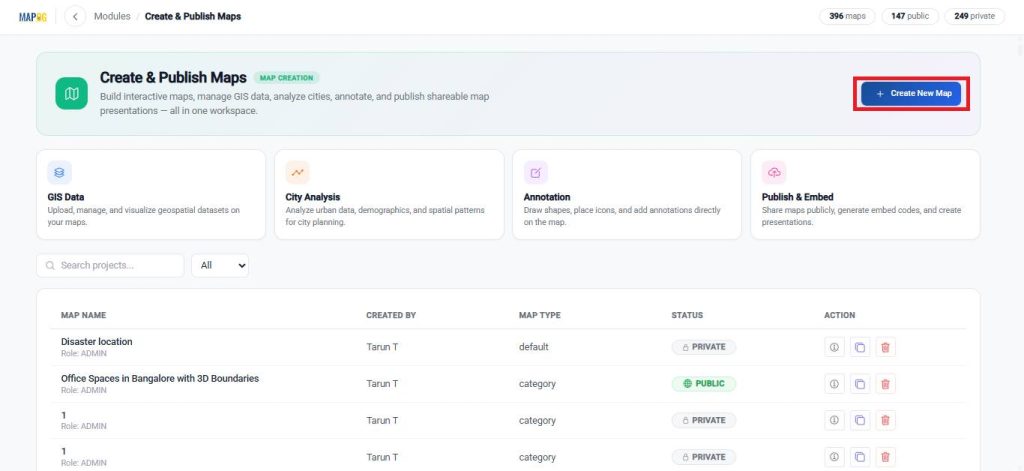
Click on Create New Map.
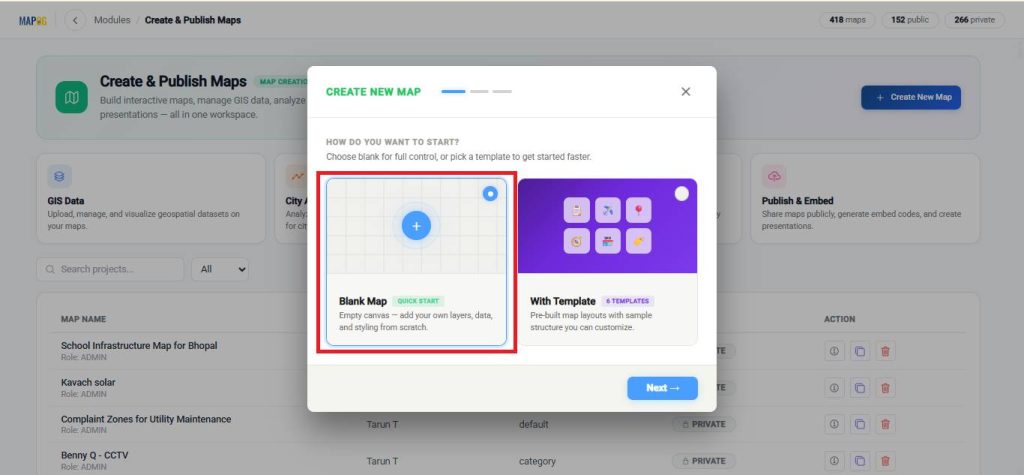
Then select the blank map option.
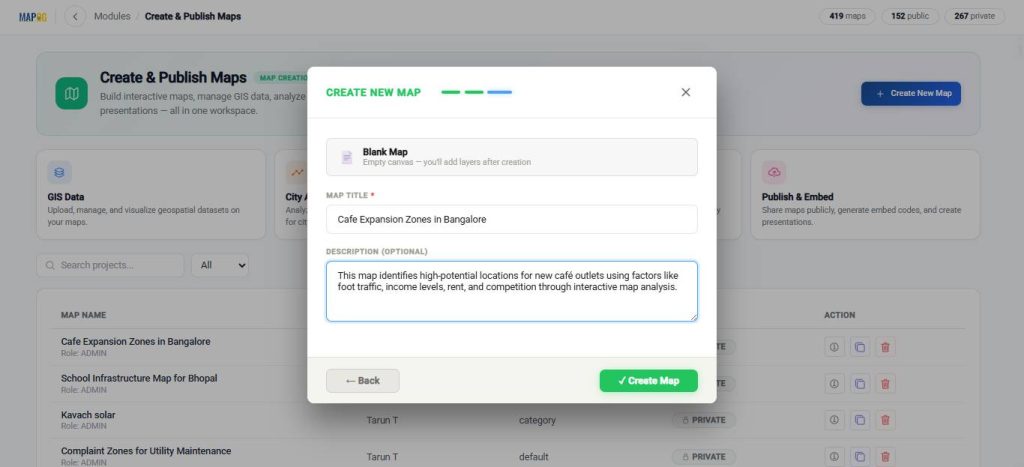
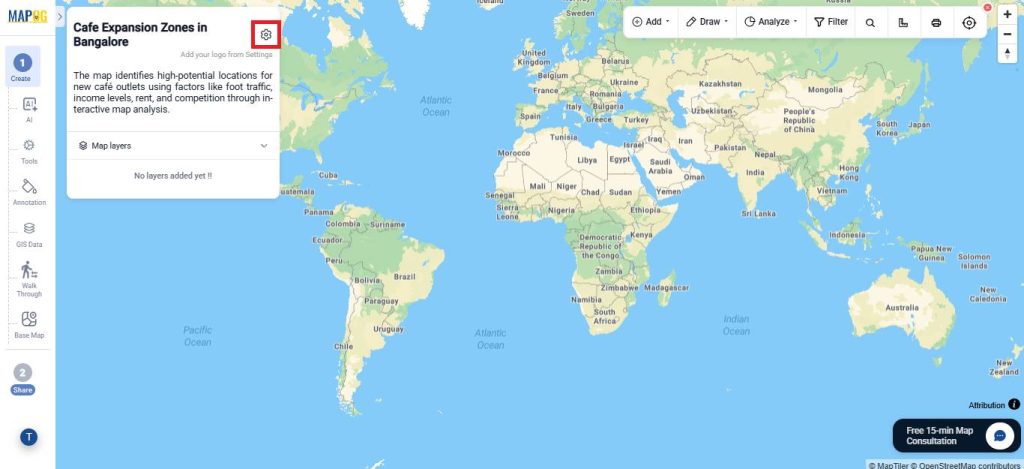
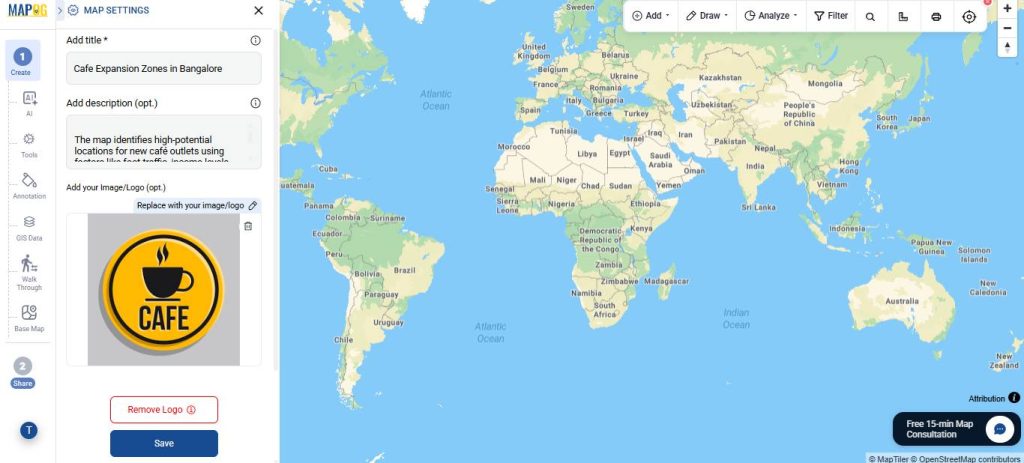
Enter a title and a brief description for your map.
Finally, open the settings, upload your logo, and save your changes.
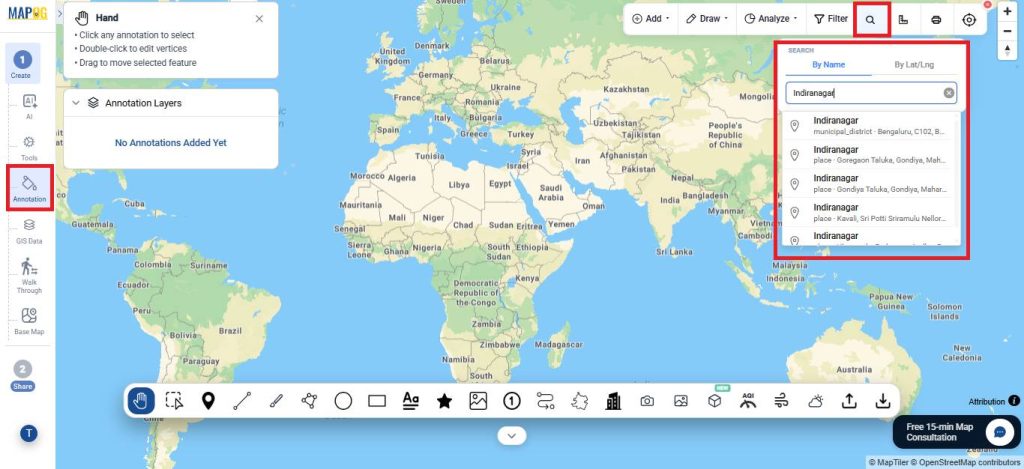
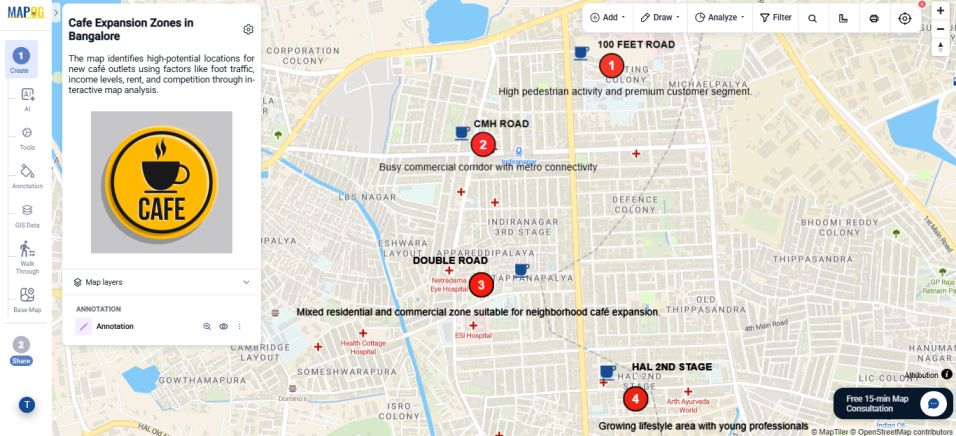
2.Add Locations and Annotated text to Your Map
Go to Annotation, then to the search option. You can find a location either by entering its name or by using latitude and longitude coordinates.
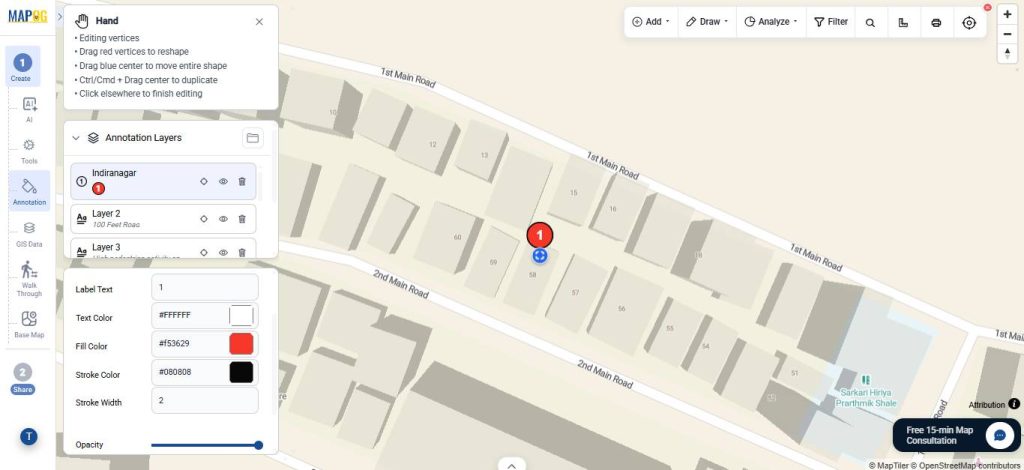
Once you narrow down the location, click on Shapes with Label and choose a suitable shape for the annotation.
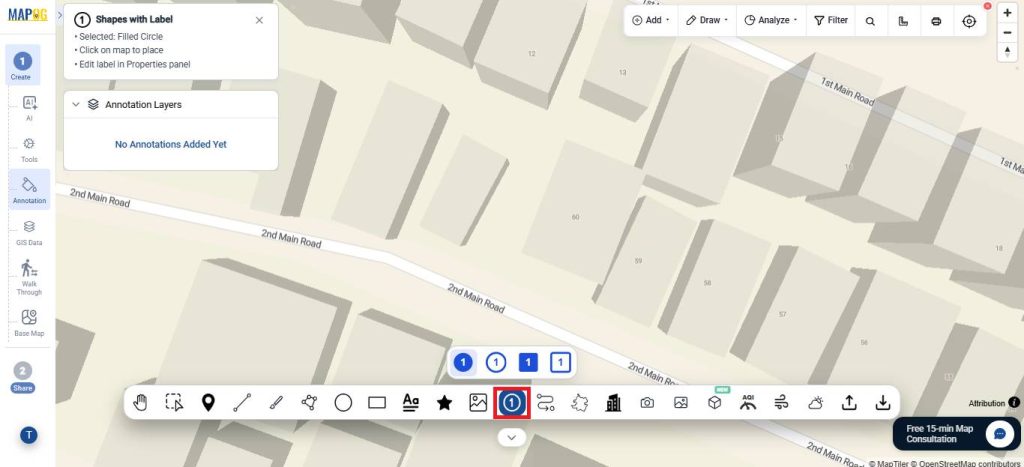
Then, customize the labelled shape by adjusting the colours, stroke style, and other design settings as needed.
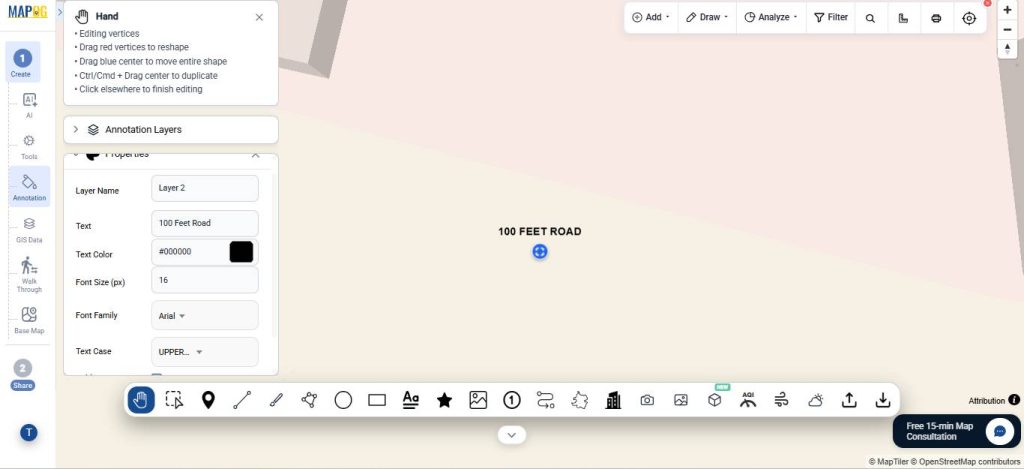
Next, select the Text option and enter the text you want to display on the map.
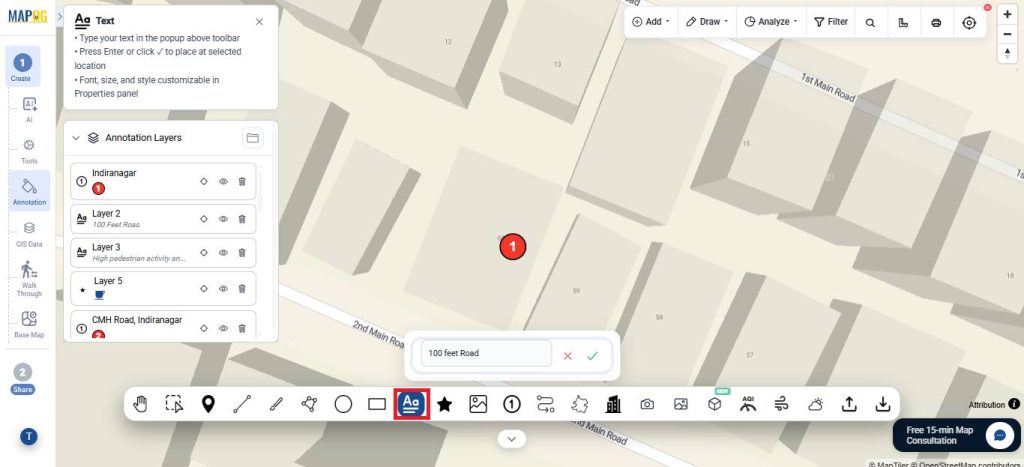
You can also customize the text by adjusting the font style, size, and colour to match your map design.
Then, add an icon to further customize and enhance the visual appearance of the map.
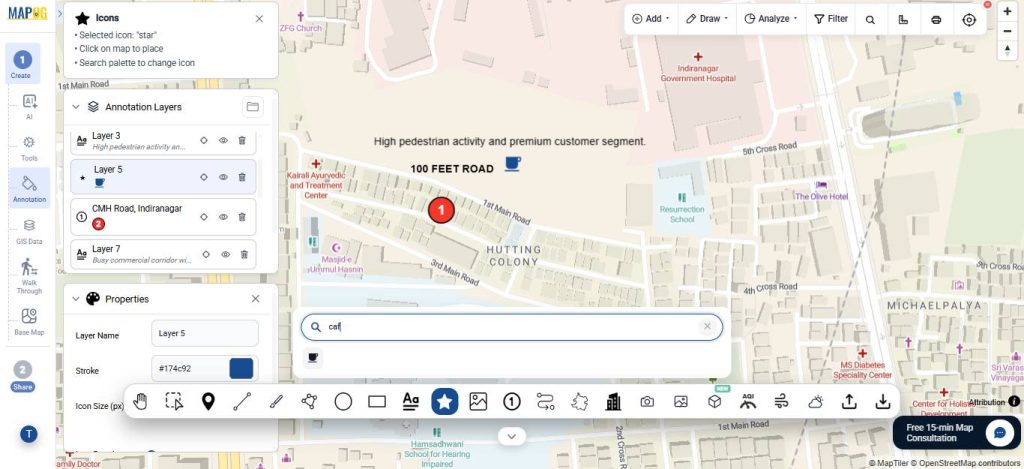
Repeat these steps for all the locations you want to annotate on the map.
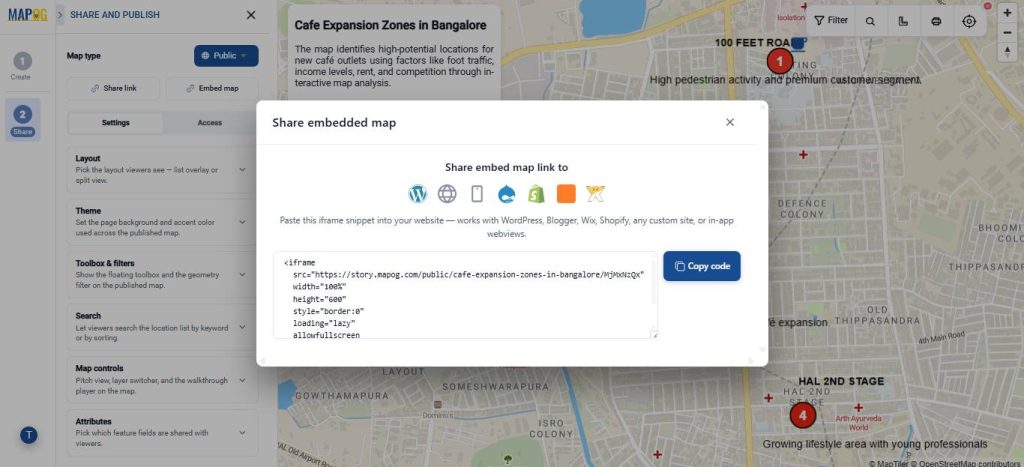
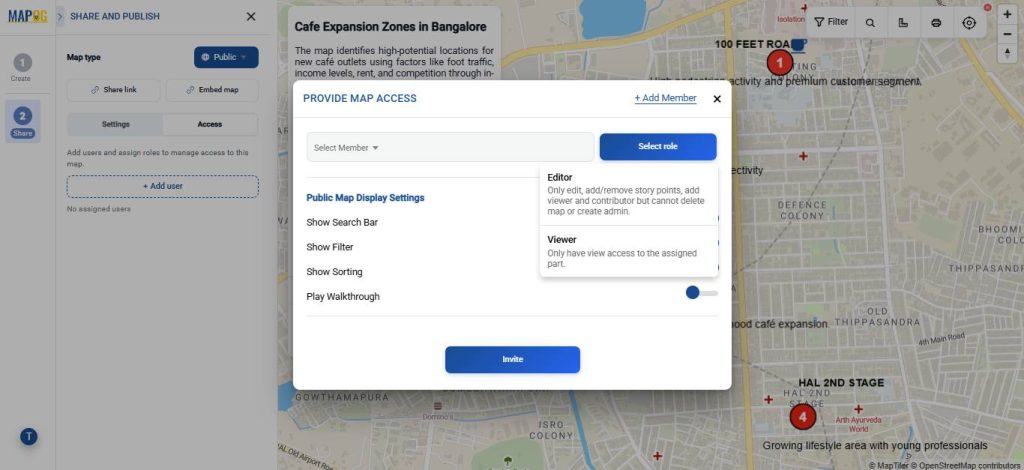
3. Preview and Share
Once everything is ready, open Preview & Share to configure sharing settings. Choose whether the map should remain Private or be accessible publicly. You can share it using a direct link, embed it into a website, or invite collaborators by adding users and assigning different access roles.
Real World Applications
Annotated interactive maps have many real-world applications across different industries. In education, they help explain geographic, scientific, and historical information through visual storytelling. Tourism platforms use annotations to highlight landmarks, routes, and local attractions. In disaster management, interactive maps display flood zones, landslide-prone areas, and emergency information in a more accessible way. Businesses use annotated maps for logistics, delivery tracking, and market analysis, while researchers and environmental organizations use them to visualize climate data, pollution levels, and field observations more effectively.
Conclusion
Annotated text transforms interactive maps from simple location displays into informative and engaging visual tools. By combining geographic data with contextual information such as labels, descriptions, and pop-ups, maps become easier to understand and more useful for communication, analysis, and storytelling. MAPOG further enhances this experience by enabling more interactive and accessible geospatial visualization.