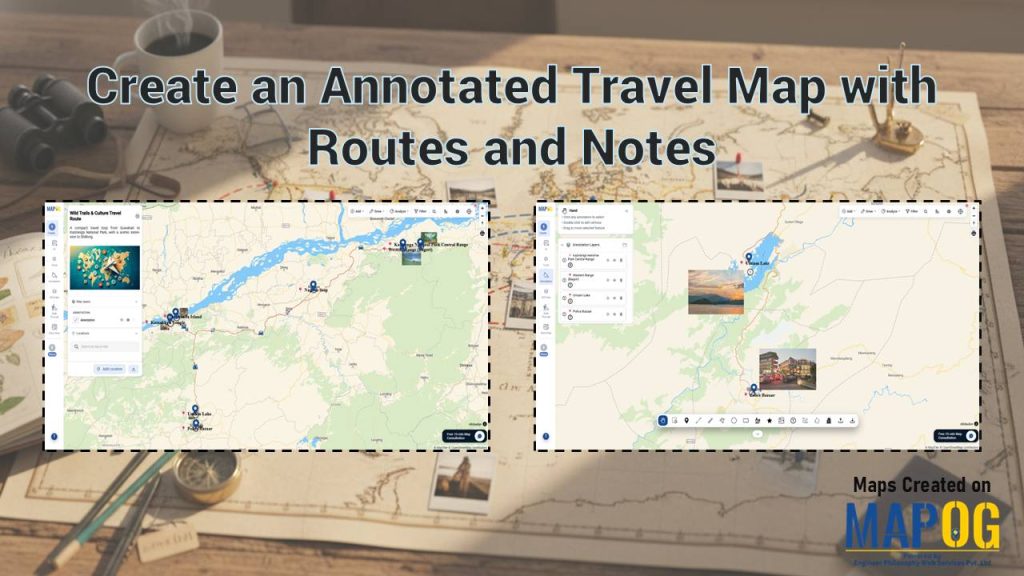
To Create an Annotated Travel Map is to turn movement into meaning. Instead of static directions, you layer routes with insights, context, and memory. MAPOG elevates this workflow through precise annotation capabilities, so every path tells a story, not just a route. As a result, travelers, planners, and analysts move from “where” to “why it matters.”
Key Concept of Creating an Annotated Travel Map
An annotated travel map combines routes with simple notes. You draw a path, then add markers with short descriptions, images, or tips. This way, anyone viewing the map quickly understands where to go and what to expect. When you create an Annotated Travel Map, you make information clear, visual, and easy to use.
Step-by-Step Workflow to Create an Annotated Travel Map with Routes and Notes
1. Create Your Map
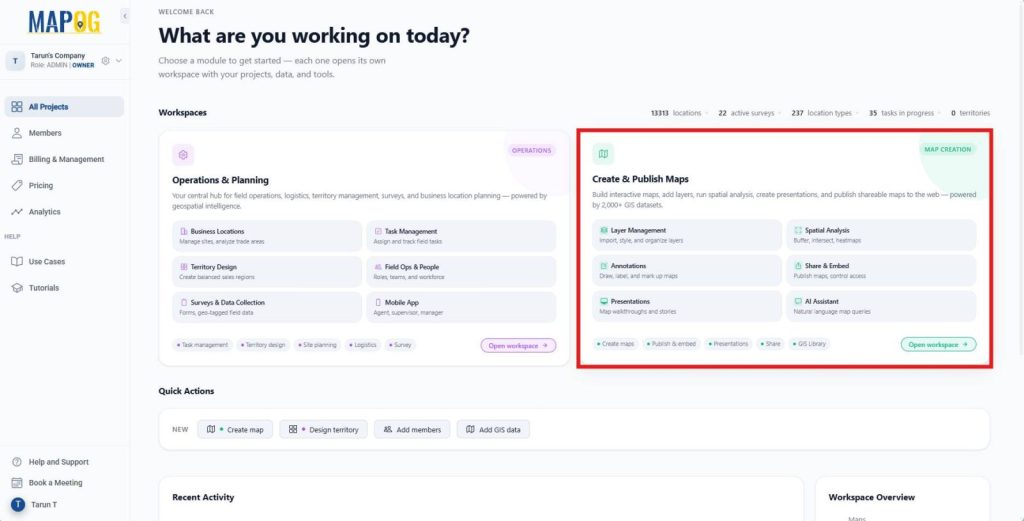
To begin, head to MAPOG and open the Create and Publish Map workspace.
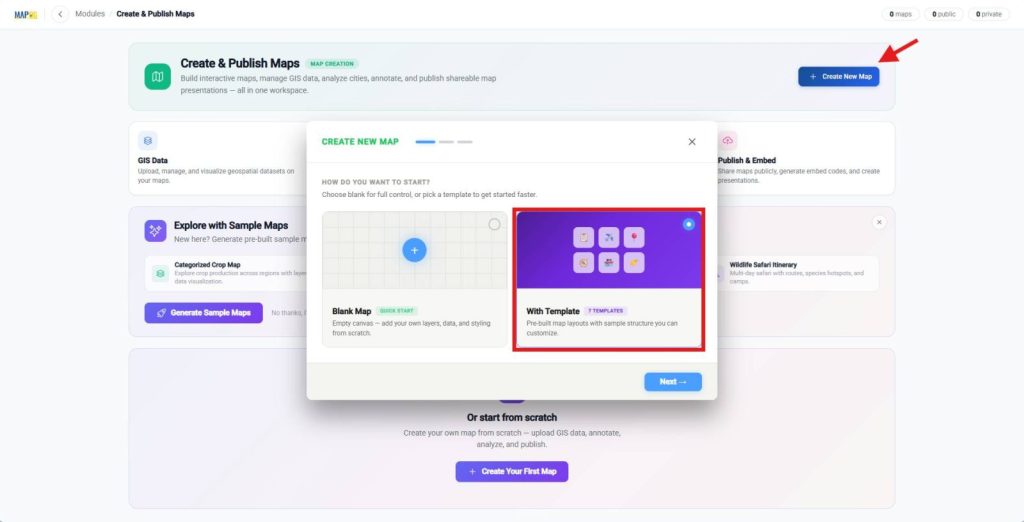
Click Create New Map, then move into the Template section and choose Travel Template.
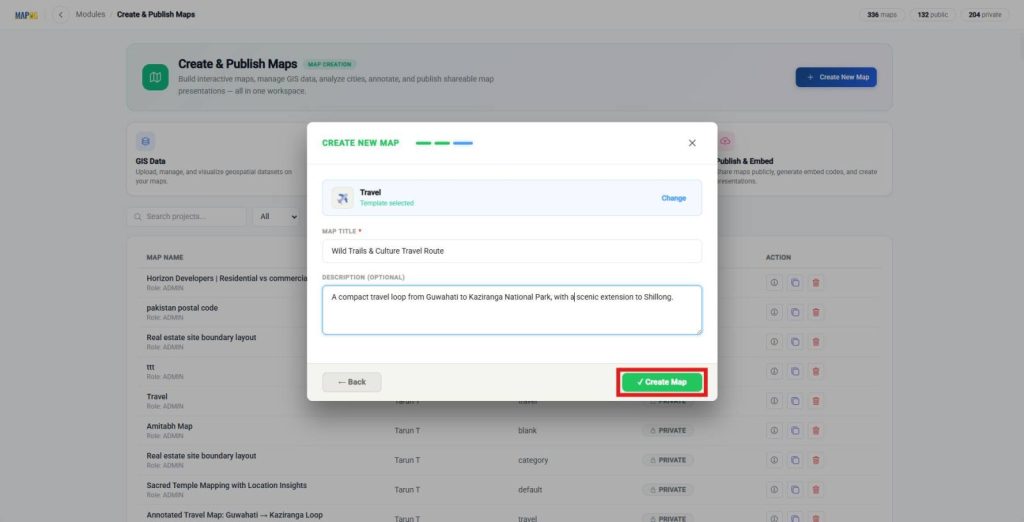
Add a title and description, and finally click Create Map to initialize your annotated travel map.
After that, open map settings and upload a cover image to your map so that your map reflects proper branding and looks credible when shared.
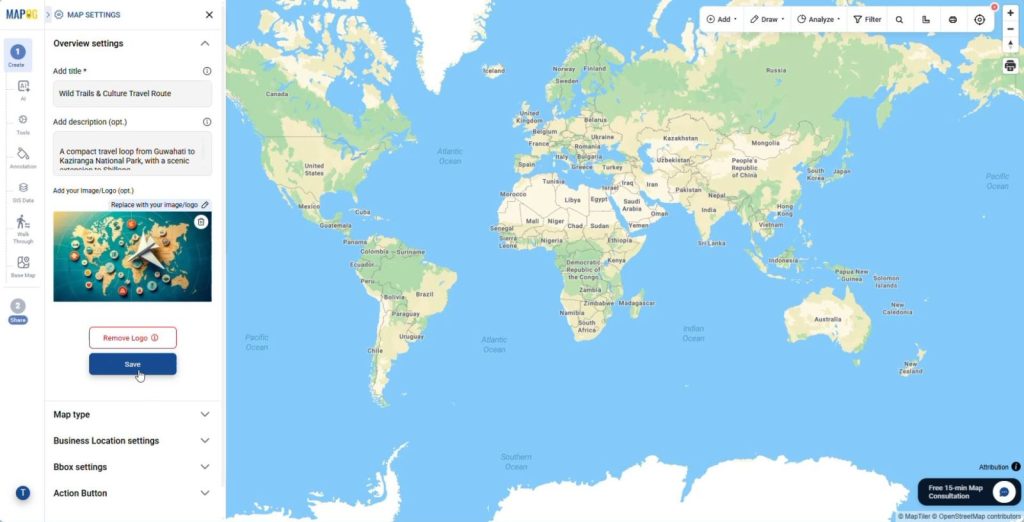
2. Search and Plot Breakpoints
Next, go to the Annotation section, use the toolbox to locate your breakpoints by entering either a place name or coordinates, so you can center the map accurately and align all elements with real-world locations.
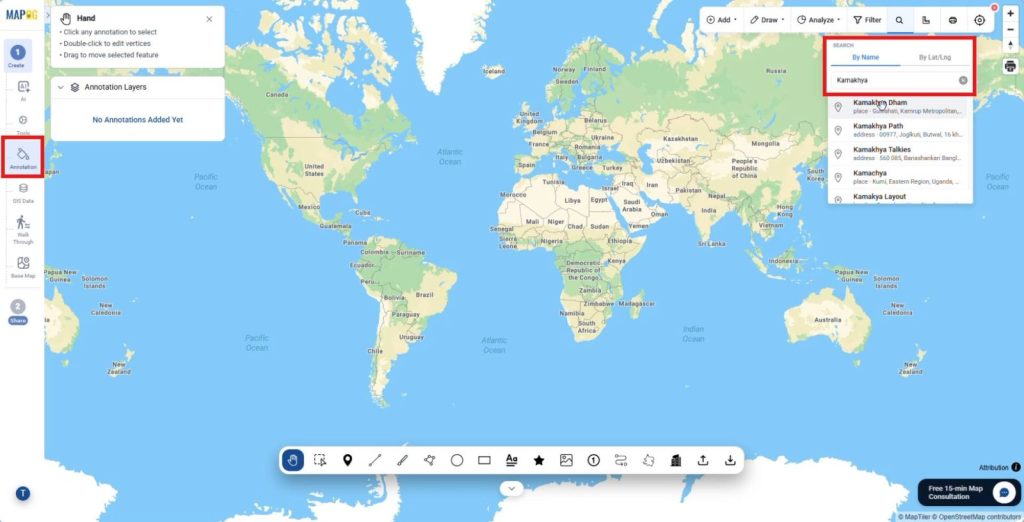
Then, select the shape tool with labeling enabled and plot each breakpoint one by one on the map,
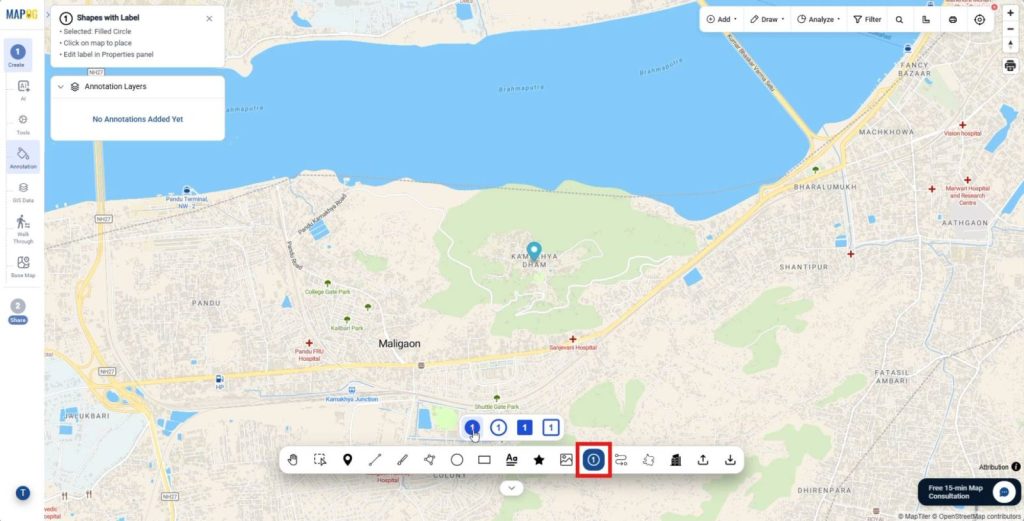
While you assign a proper layer name and enter label text such as serial numbers or day markers; additionally, customize text color, fill color, stroke color, opacity, and size to build a clear and structured set of primary locations.
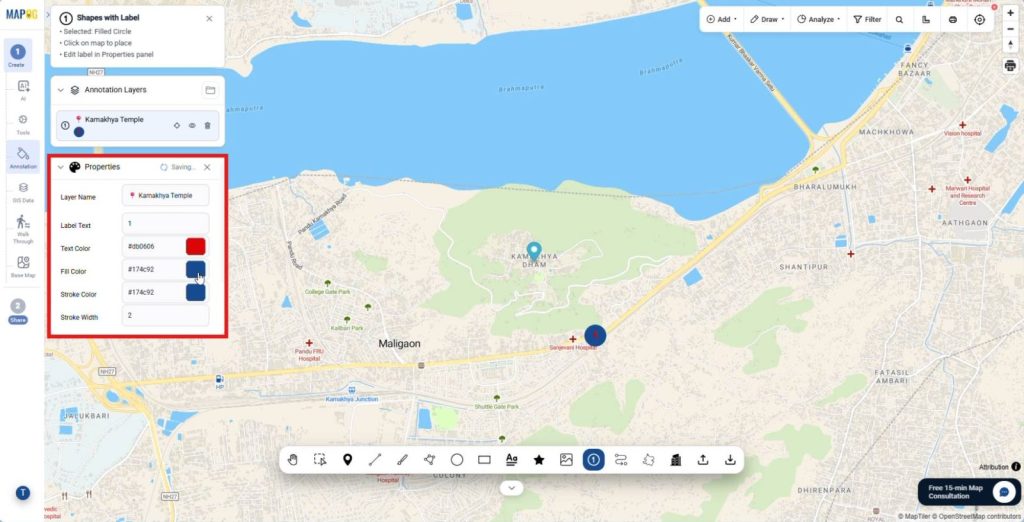
3. Connect Locations with Route Tool
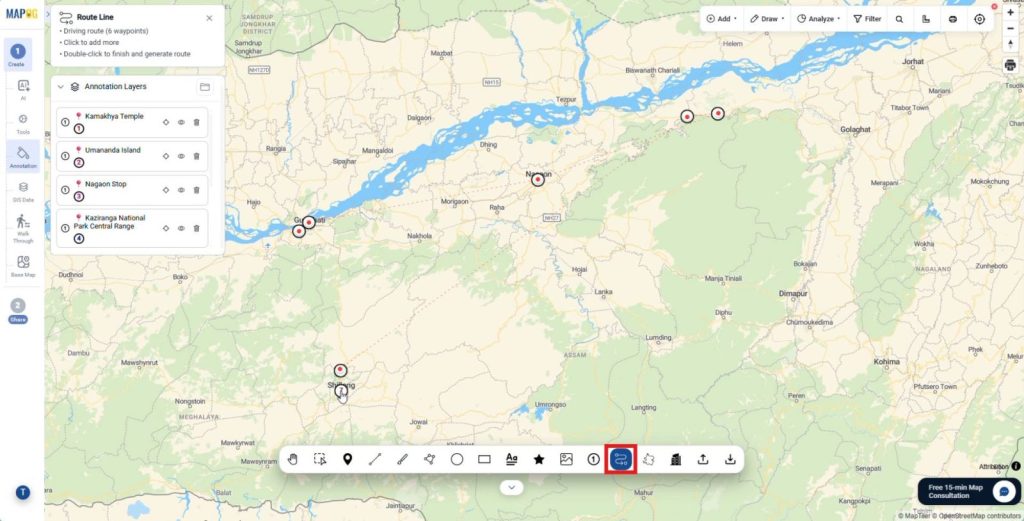
After that, choose the route line tool and connect each plotted location in sequence by clicking them in order, and then double-click to complete the route so the system connects all locations automatically;
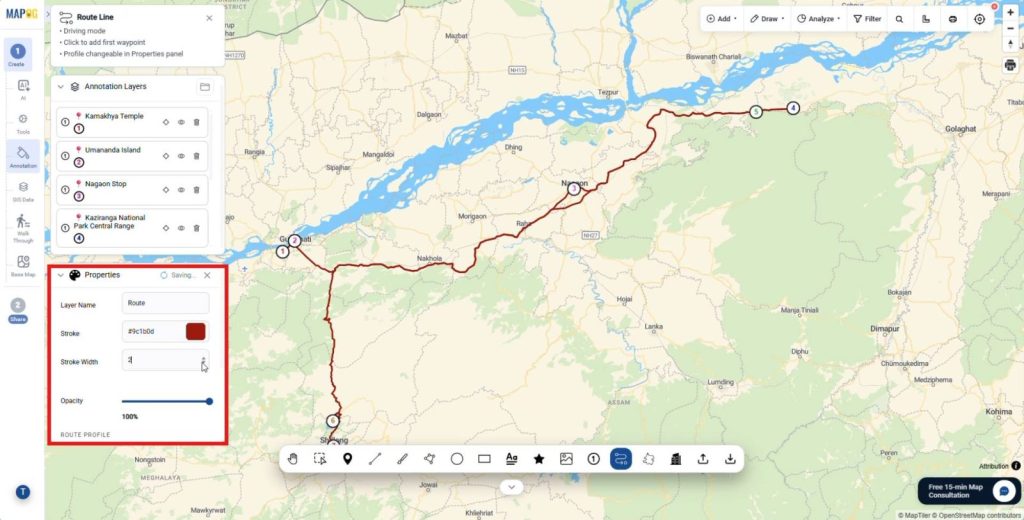
Subsequently, refine the route from the properties section by updating the layer name, adjusting stroke color, width, and opacity,
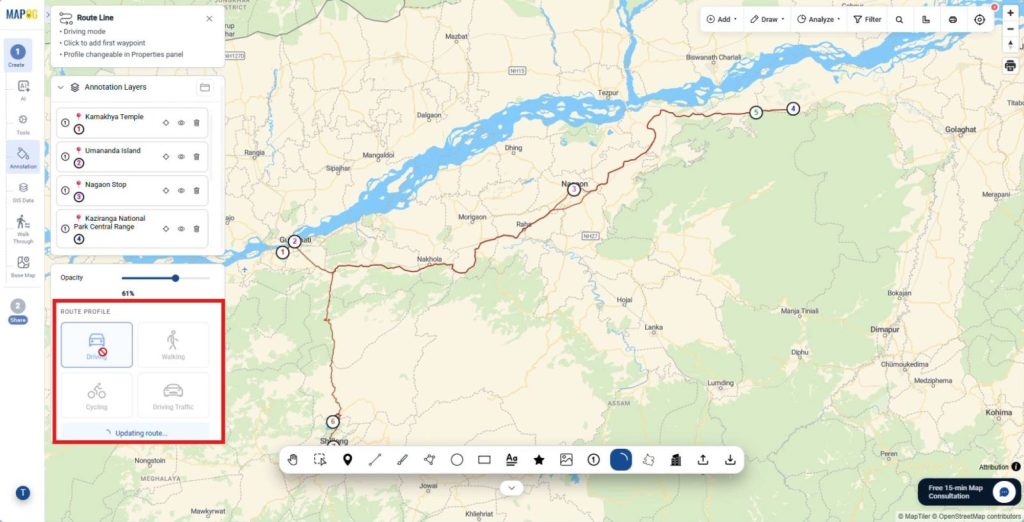
and selecting a suitable route profile such as driving, walking, or cycling to match real-world movement.
4. Mark Exact Locations
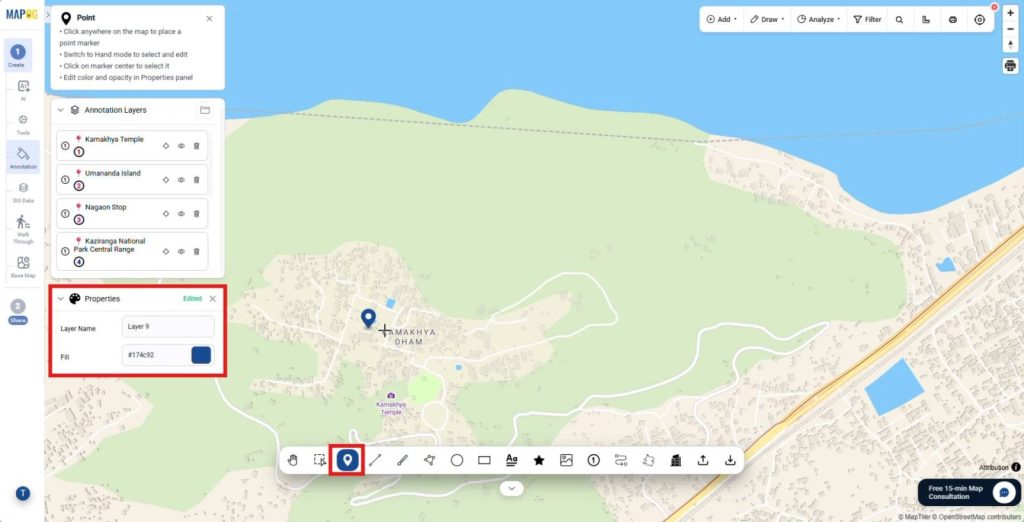
Meanwhile, use the point tool to mark exact or additional locations individually, and customize each point from the properties section, which adds precision and helps you distinguish key points from general breakpoints.
5. Add Text Labels and Notes
In the next step, activate the text tool to add labels or notes for each breakpoint by typing the content and dragging it into position.
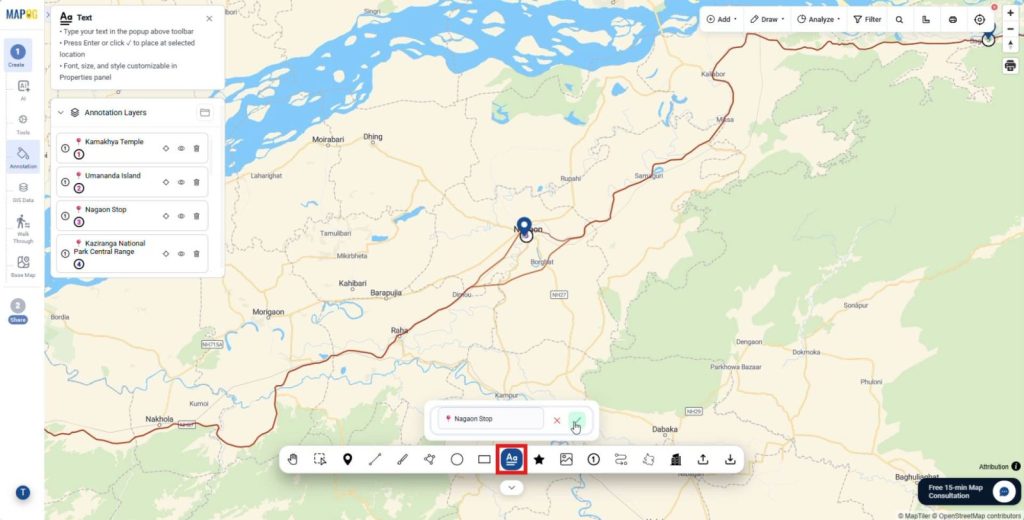
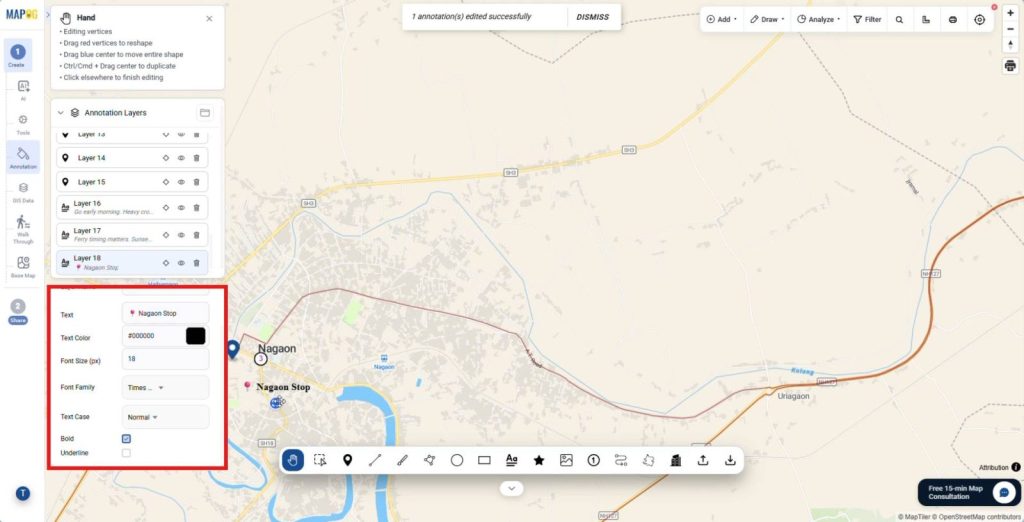
Furthermore, adjust font type, size, color, and case, and apply styles like bold or underline to improve readability and maintain visual hierarchy.
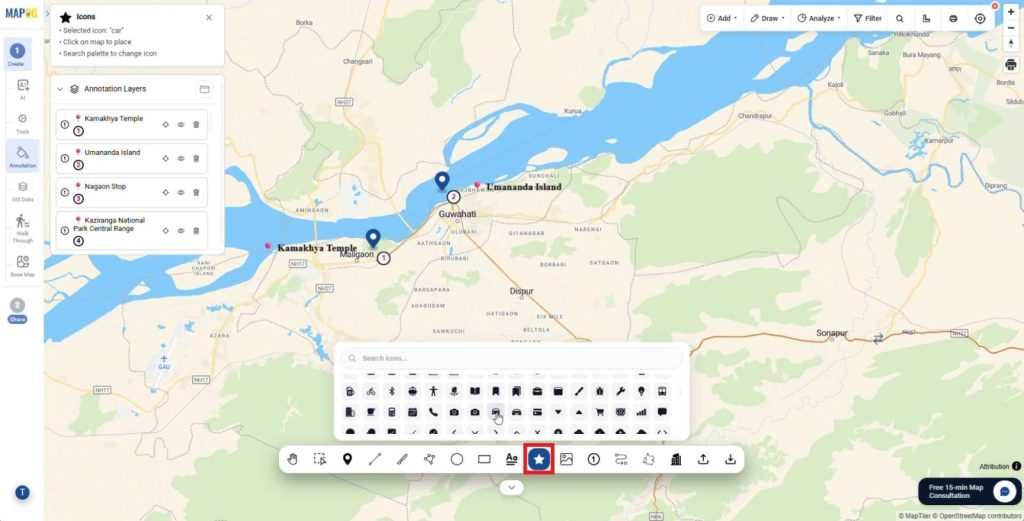
6. Add Icons for Clarity
Similarly, enhance the map’s clarity by using the icons tool to search and place relevant icons such as vehicles, landmarks, or direction indicators,
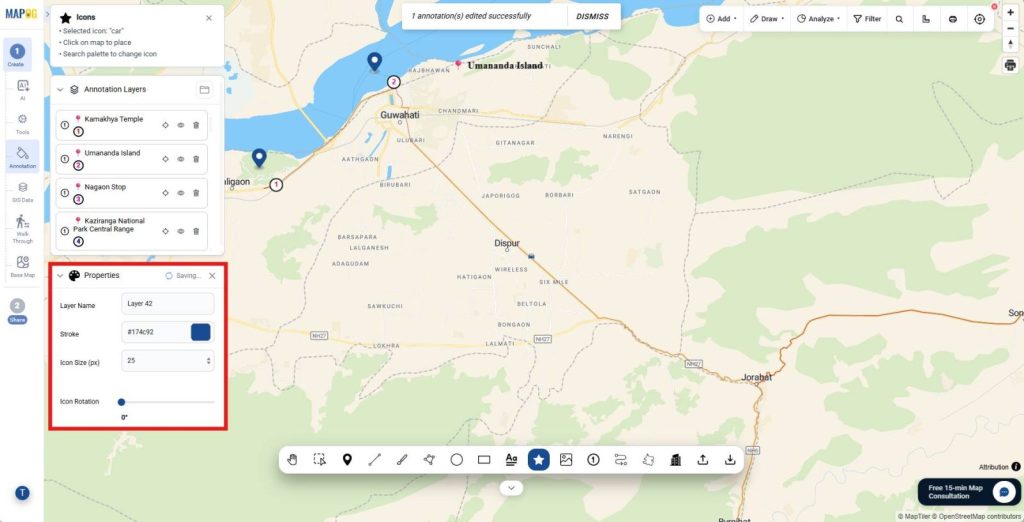
Then adjust their color, size, and rotation from the properties section so users can interpret the map quickly.
7. Add Images to Locations
Afterward, add contextual imagery by selecting the image tool, uploading or dragging your image,
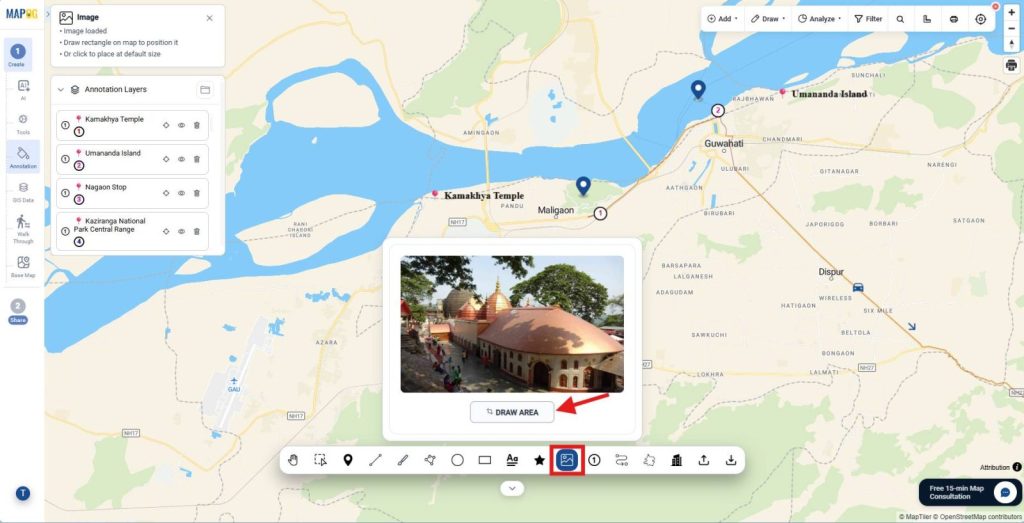
and drawing an area on the map to define placement;
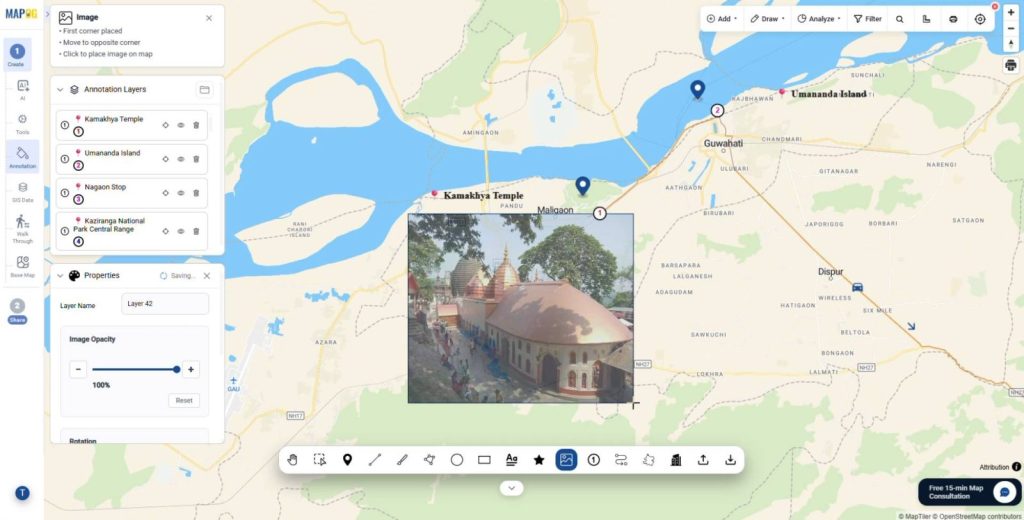
then position it accurately and adjust opacity, rotation, and scale so it integrates smoothly without cluttering the layout.
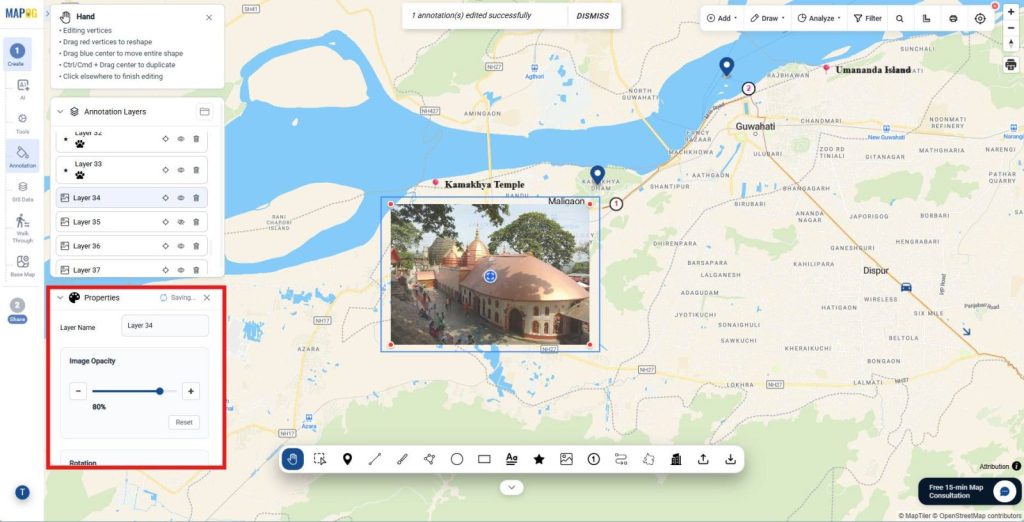
8. Draw Additional Routes or Lines
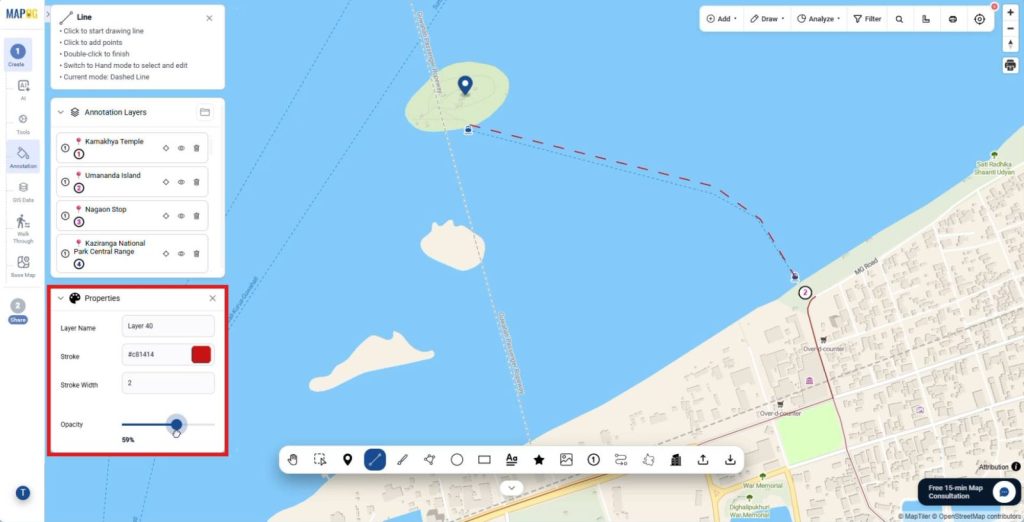
In addition, use the line tool to draw extra route types such as straight lines, curves, dashed paths, or railway-style lines to represent transport modes like ferries or railways,
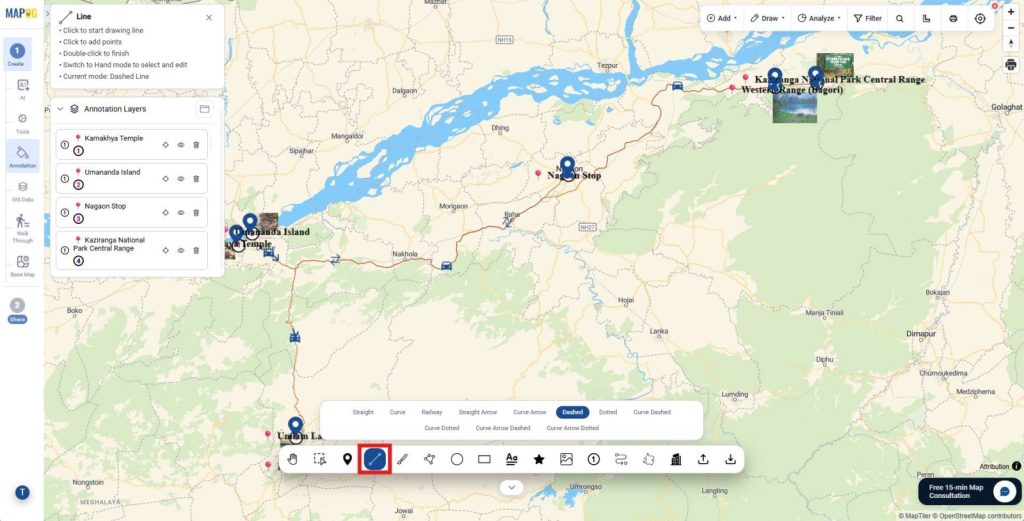
and customize stroke color, width, and opacity to clearly differentiate them from primary routes.
9. Share and Publish Map
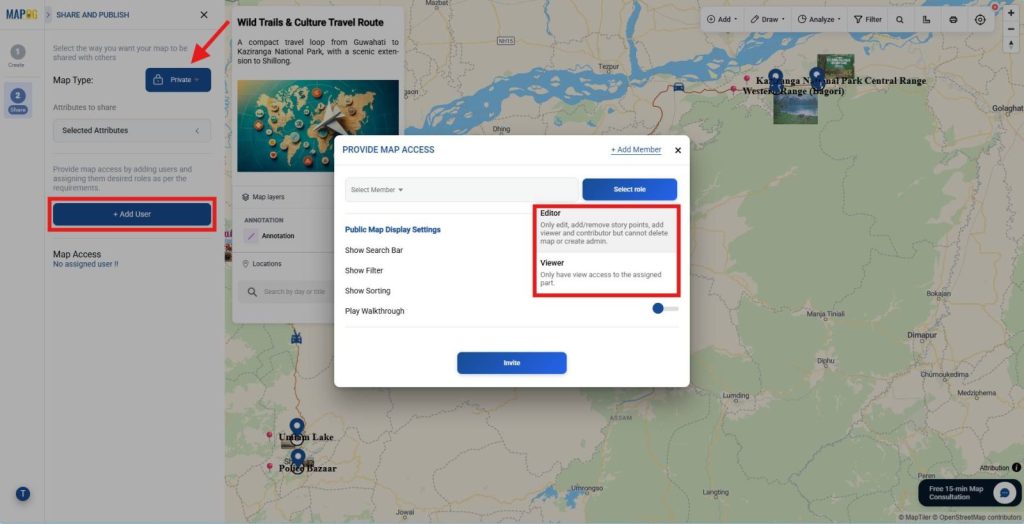
Finally, go to the Share and Publish section, share it privately by adding users and assigning roles like viewer or editor,
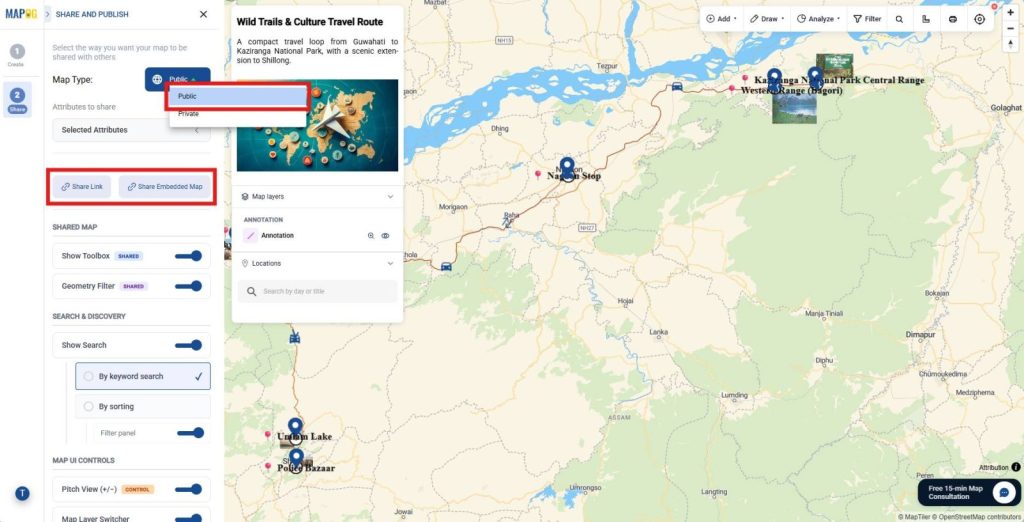
or make it public and share it through a link or embed option, which turns your map into a fully usable output.
Industries and Domains Benefitting
Tourism improves guest experiences with guided routes. Logistics teams plan smarter deliveries. Urban planners spot usage patterns faster. Education and real estate also benefit by presenting clear location insights. In short, when you create an Annotated Travel Map, communication becomes sharper and decisions get easier.
Conclusion
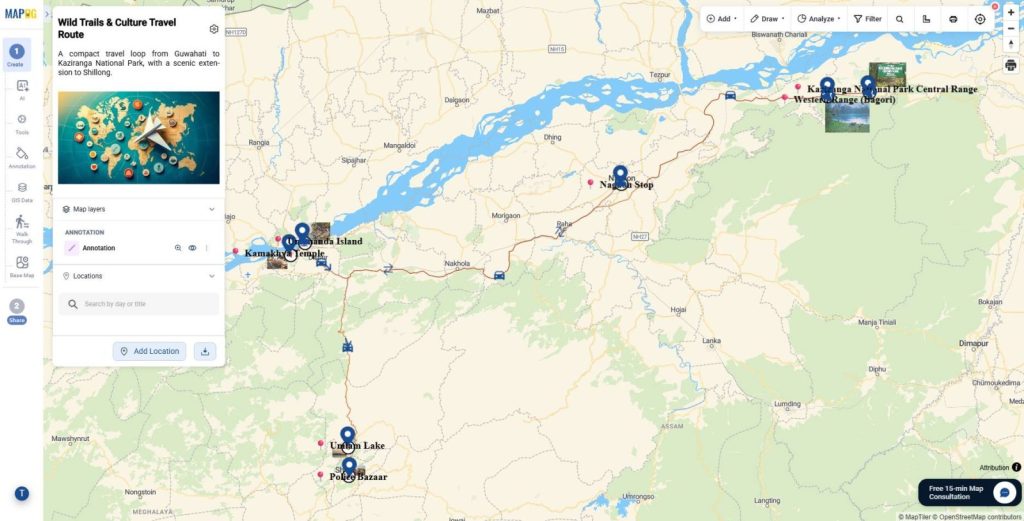
In a world flooded with raw location data, clarity wins. When you create an Annotated Travel Map, you convert data into direction and insight into action. MAPOG’s annotation capability closes the loop by making maps interactive, structured, and scalable. Build once, refine continuously, and let every route speak with purpose.