In population studies and urban planning projects, demographic data often stays limited to spreadsheets or reports, making it difficult to understand regional patterns and trends. Consequently, users struggle to identify population density, growth areas, or demographic distribution visually. MAPOG Visualize Population Data using interactive GIS maps.
Key Concept: Why Use Interactive GIS Maps for Population Data
Because interactive GIS maps provide spatial context by showing population distribution across regions, districts, or neighborhoods. Thus, demographic data becomes easier to analyze, compare, and present for planning and decision-making.
What Is Visualizing Population Data Using Interactive GIS Maps?
Visualizing population data using interactive GIS maps is a GIS-based approach where demographic information is displayed geographically with layers, symbols, and interactive tools. It helps users analyze density, growth, and regional patterns while improving planning, reporting, and decision-making.
Methodology: Visualize Population Data Using Interactive GIS Maps
Organizing population datasets on interactive GIS maps improves demographic analysis, spatial understanding, and stakeholder communication.
1. Configure the Population Mapping Project
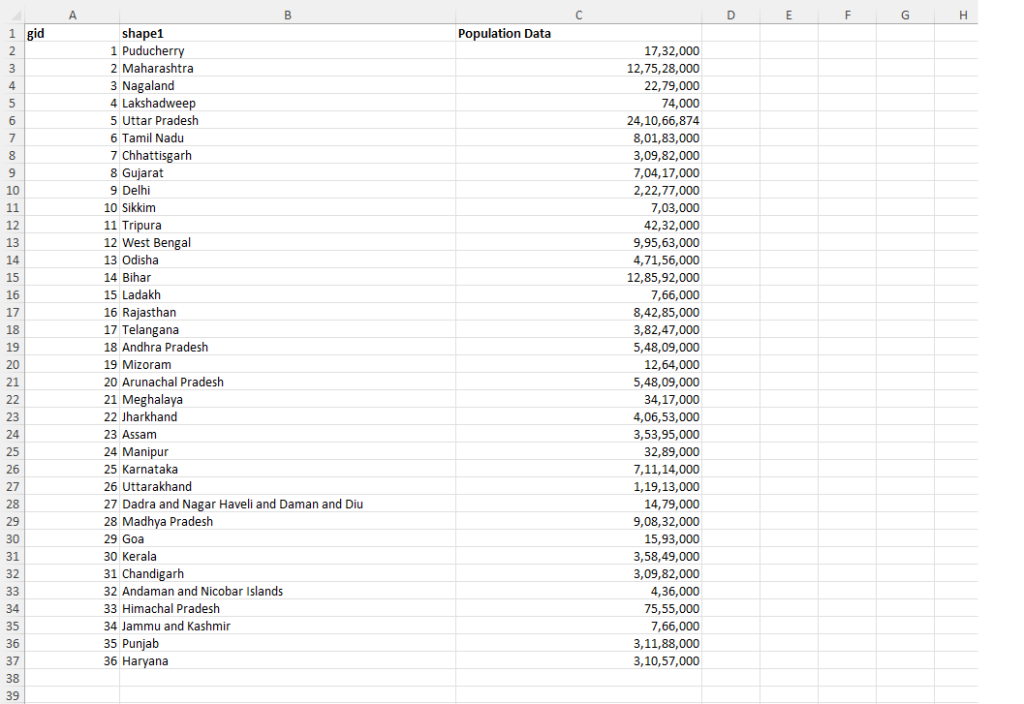
First, collect all population data demographic details in one master spreadsheet.
2. Choosing Your Map Type
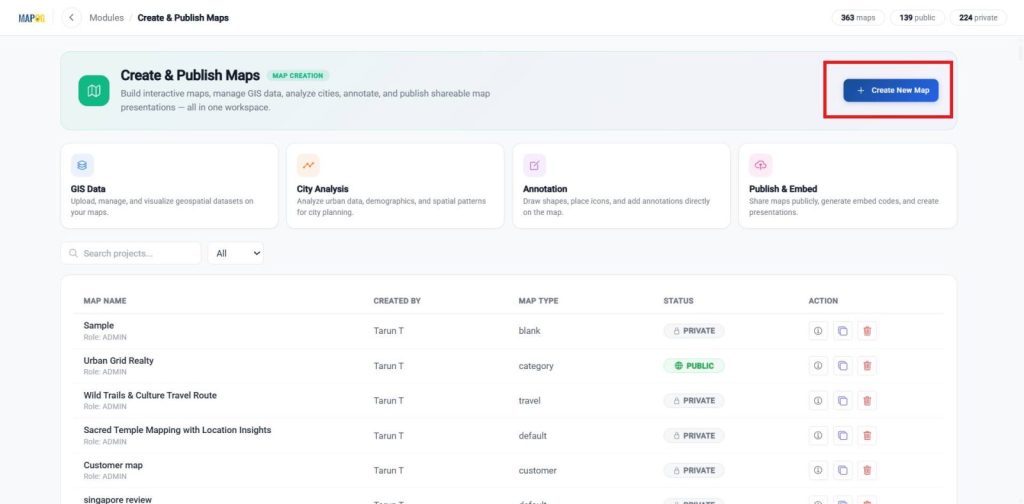
Launch MAPOG, navigate to Create and Publish Maps, and then select Open Workplace.

Start by opening MAPOG and clicking + Create New Map.
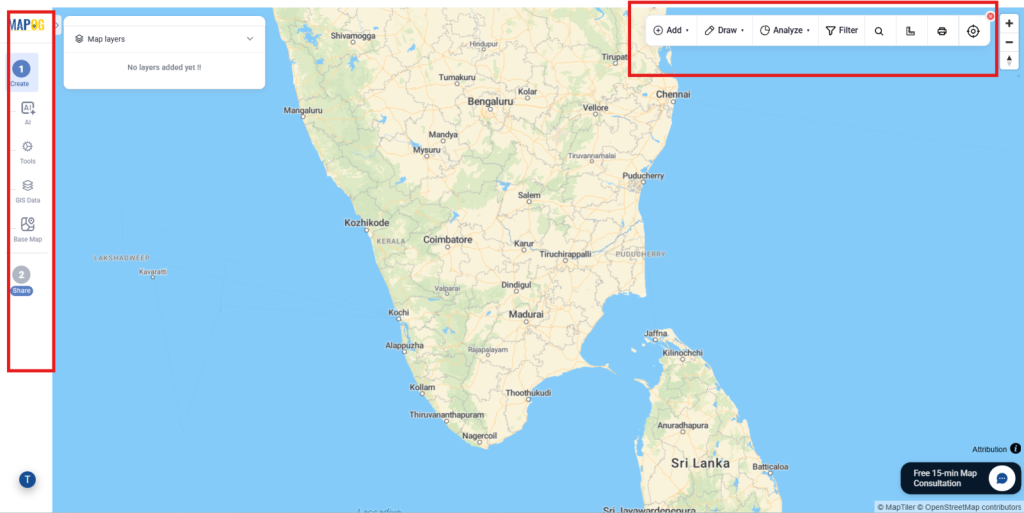
This step is important because it defines your entire workflow. If your goal is to analyze geographic data, build layers, or run spatial tools, choose a Blank Map.

A Blank Map is designed for full GIS control. It gives you a flexible environment where you can build everything from scratch and perform detailed spatial analysis.
3. Uploading data from GIS Library
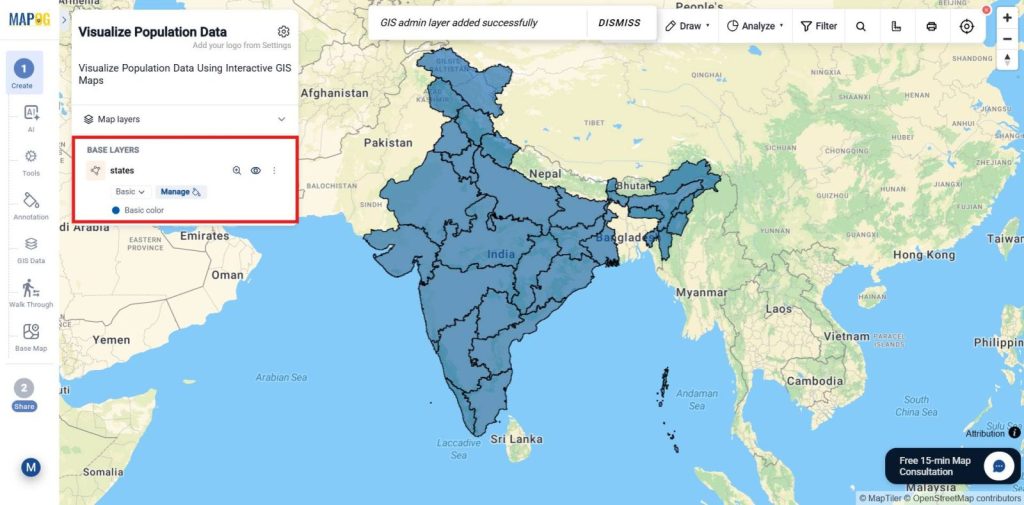
Next, open the GIS data library, choose the required country & search for the layer you want to add, then click “Add to Map” to load the data into your map.
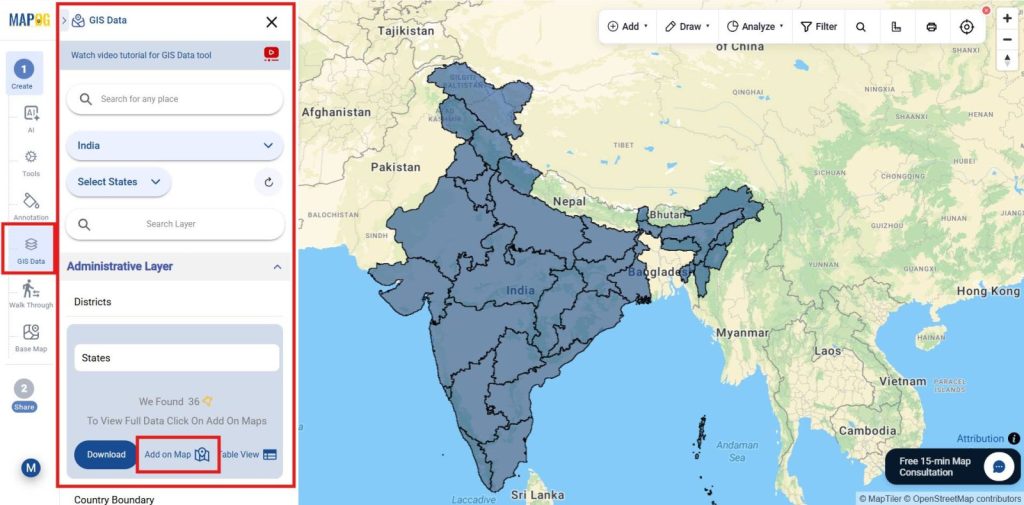
You will then visually see that the dataset has been successfully added to your base map.
4. Update data with Excel Attributes
Next, go to the Excel Attributes option from the tools section.
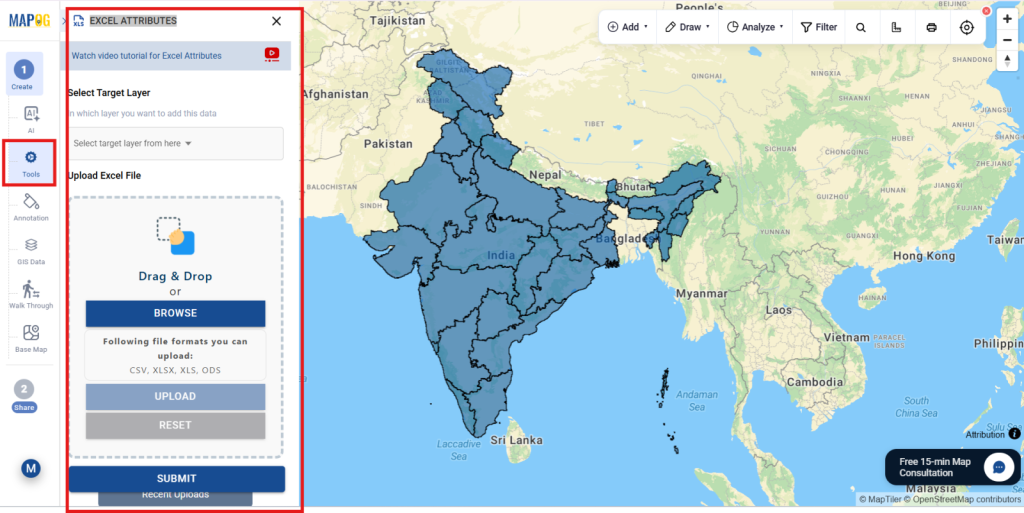
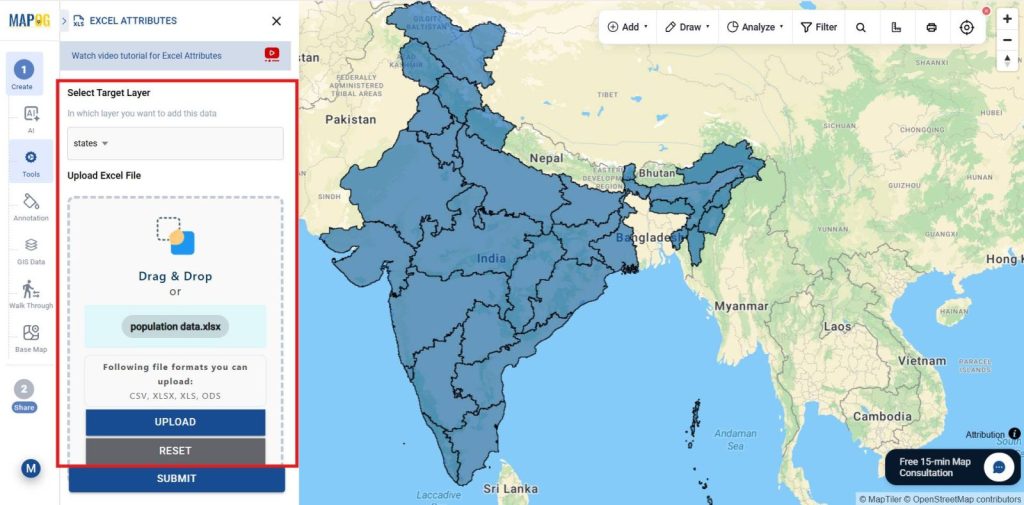
Then, select the target layer as the base map you added from the library, and browse to upload the Excel population dataset you prepared.
Next, select the joining attribute and choose how you want to join the data. Then, select the Excel join attribute and target join attribute. After that, choose whether to save it as a new layer or update the existing layer. Finally, select the map features you want to display and apply the required merge rule.
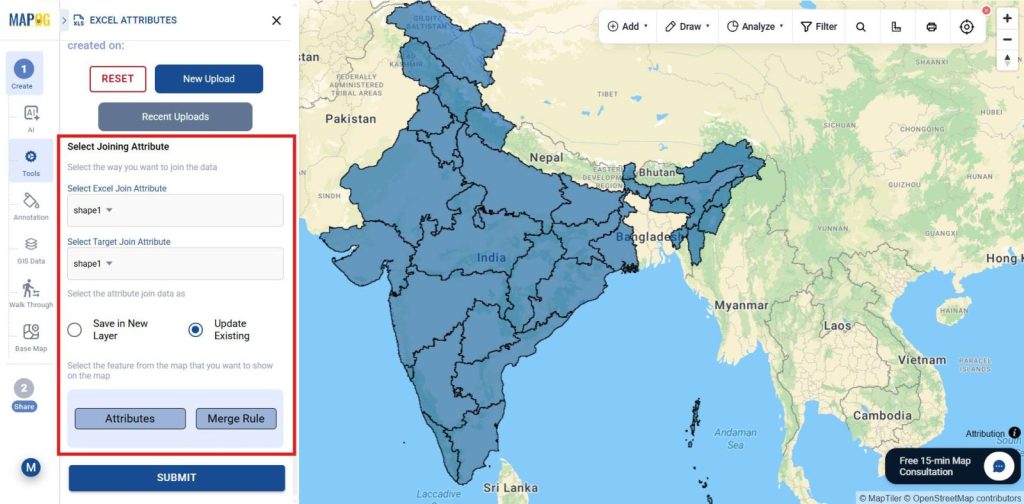
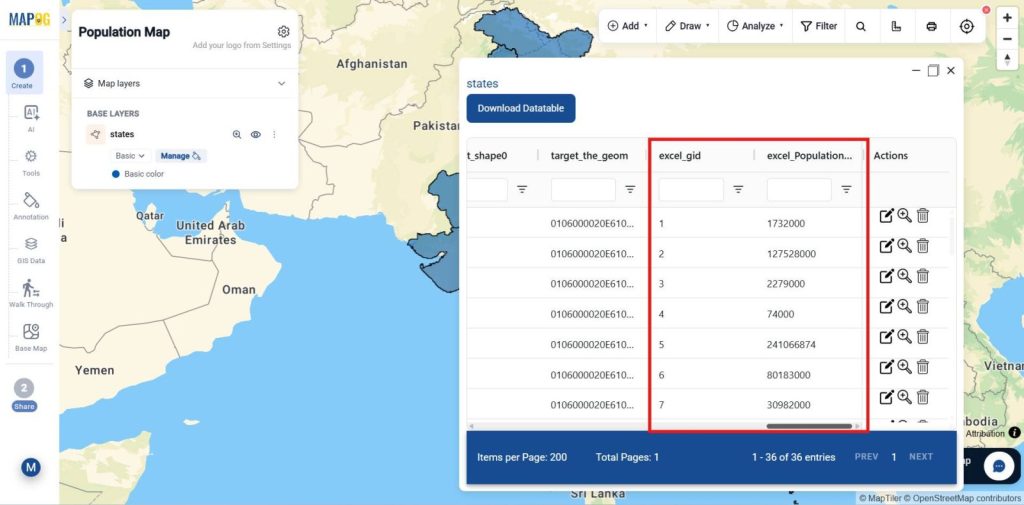
Finally, all the data will be merged and can be viewed through the “Show Data” option in the layer.
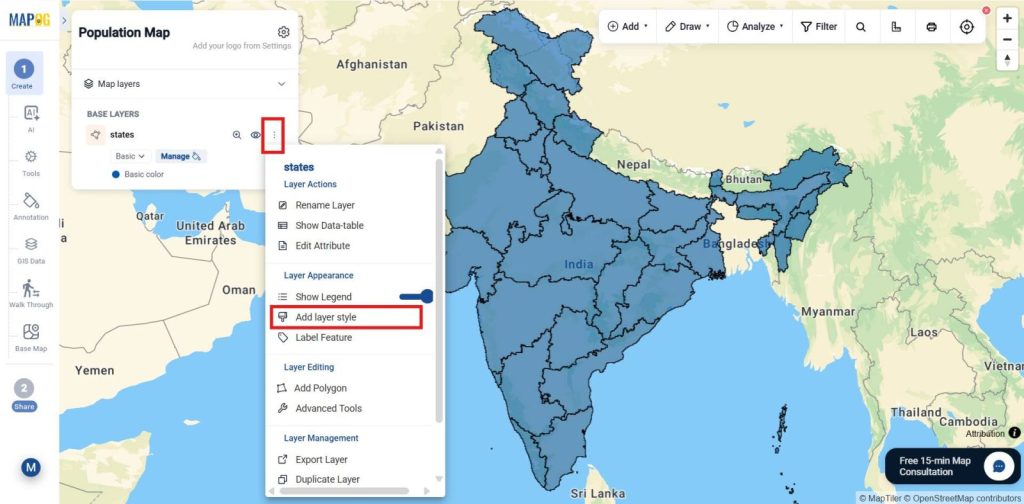
5. Style Layer
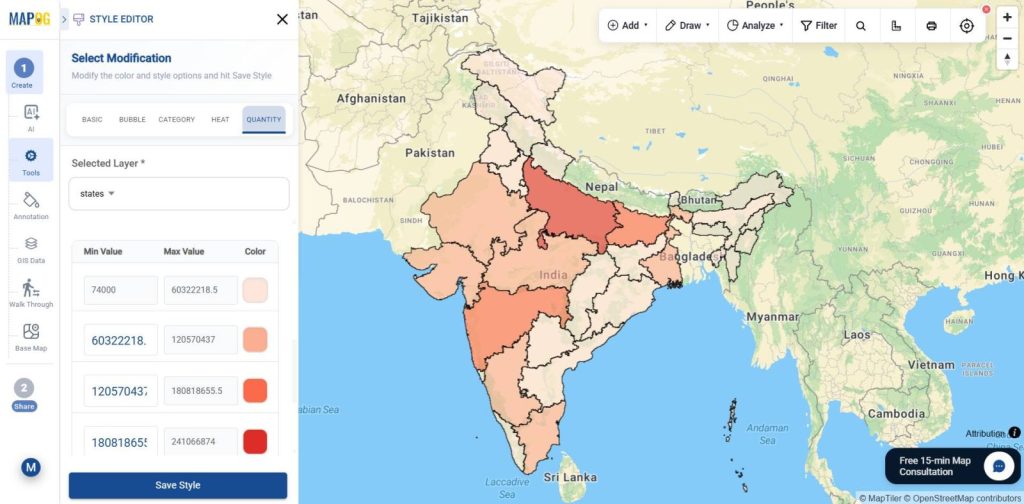
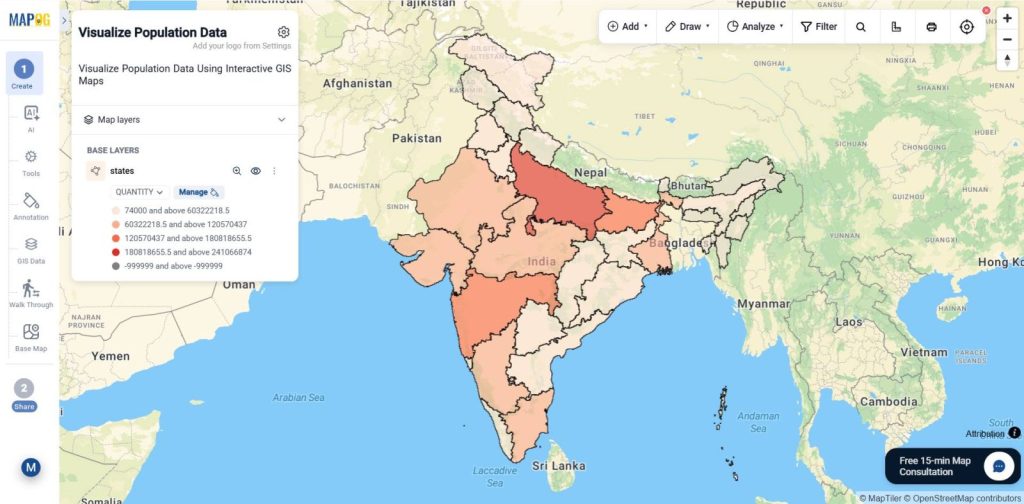
Go to Settings under Map Layers, select Add Layer Style, set the category to Quantity Style, and choose the uploaded population layer.
Then, select the population attribute, set the Number of Parts to 4, choose the red color scheme, apply different quantity ranges, adjust the layer style settings, and click Save to clearly visualize population distribution on the map.
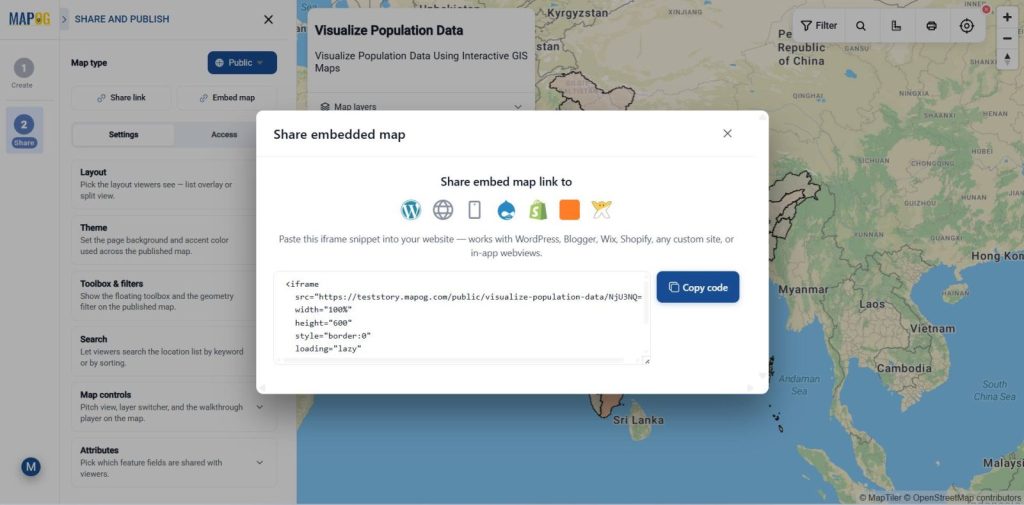
6. Publish and Share Your Map
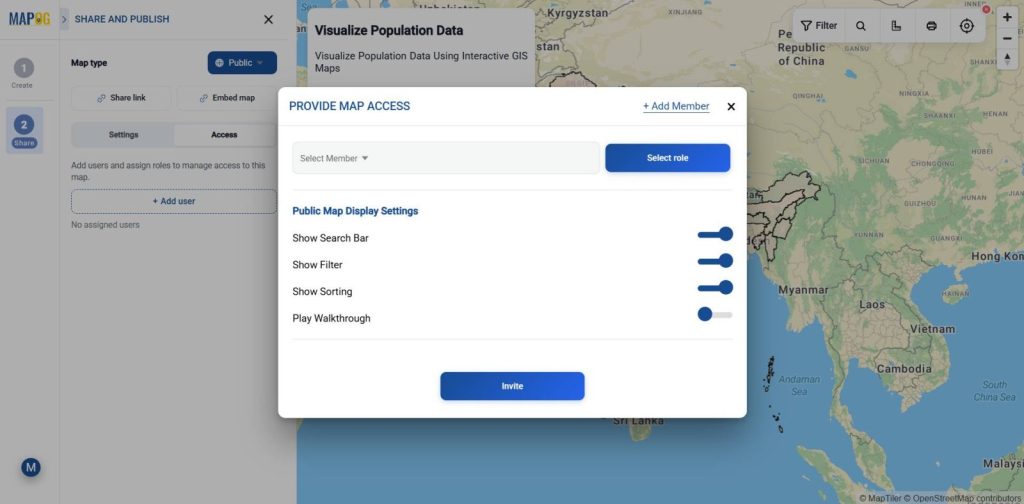
Once setup is complete, use Preview & Share to publish your map and generate a shareable or embeddable link, letting users explore properties by all or selected attributes.
Provide map access by adding users, assigning roles, and enabling shared tools like geometry filters, search, and map controls. Use +Add Users to invite members, assign view/edit permissions, and enable public map features like search, filters, sorting, and shared tools.
Industry Use Cases and Benefits
Visualize population distribution through interactive GIS maps to better understand demographic patterns, density, and growth trends across different regions. Interactive maps make complex population datasets easier to explore and analyze visually. They help planners identify high-density areas, underserved regions, and infrastructure needs more efficiently. Population mapping also improves resource allocation, public service management, and urban development planning. By converting demographic data into location-based insights, GIS supports faster and smarter decision-making.
Conclusion
In conclusion, MAPOG simplifies population data mapping by combining demographic datasets, GIS layers, and interactive visualization tools within a single platform. It helps users analyze population distribution, identify regional patterns, and improve planning efficiency through location-based insights. By making demographic data easier to visualize and understand, MAPOG supports smarter decision-making for urban planning, public services, infrastructure development, and resource management.
Explore helpful blogs