How to Visualize Population Data Using Interactive GIS Maps
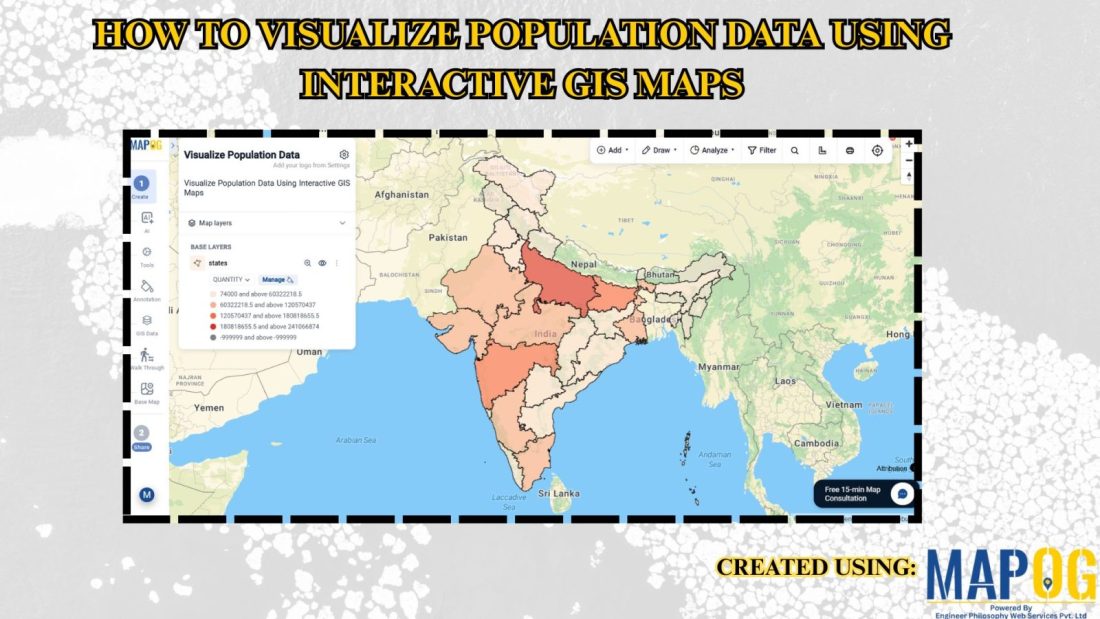
In population studies and urban planning projects, demographic data often stays limited to spreadsheets or reports, making it difficult to understand regional patterns and trends. Consequently, users struggle to identify population density, growth areas, or demographic distribution visually. MAPOG Visualize Population Data using interactive GIS maps. Key Concept: Why Use Interactive GIS Maps for Population … Read more