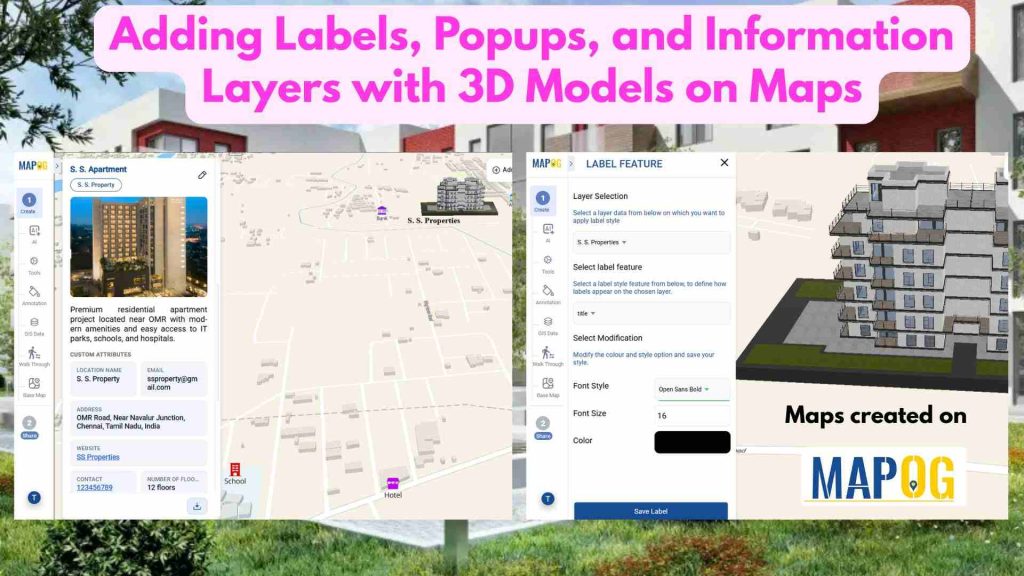
In real estate, property data is often scattered across multiple platforms, making it hard to compare options and gain clear insights. This lack of visibility slows decision-making. Today, clear and precise data visualization is essential for smarter property decisions. With MAPOG, developers can layer filters onto a property map and enhance listings using Information Layers with 3D Models, allowing users to compare properties, identify trends, and access key information instantly. This focused visualization enables faster decision-making, cleaner user experiences, and more efficient property discovery-ensuring every search feels intuitive, dynamic, and data-driven.
Key concept
Showing a property with nearby amenities on a map adds context beyond a simple pin. Instead of separate searches, users can view schools, hospitals, transport, and shops in one place. With MAPOG, locations are linked to nearby amenities for quick neighborhood insights. Each location can include details, categories, and quick access to nearby facilities, making the map a powerful tool for visualization, exploring convenience, accessibility, and lifestyle benefits tied to the property location.
Steps to Information Layers with 3D Models
Step 1 :Create and Upload Locations
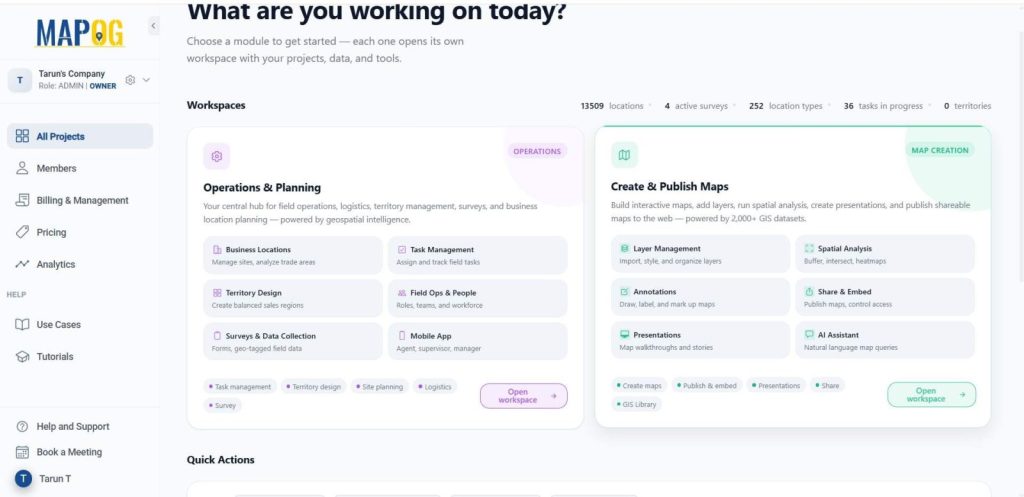
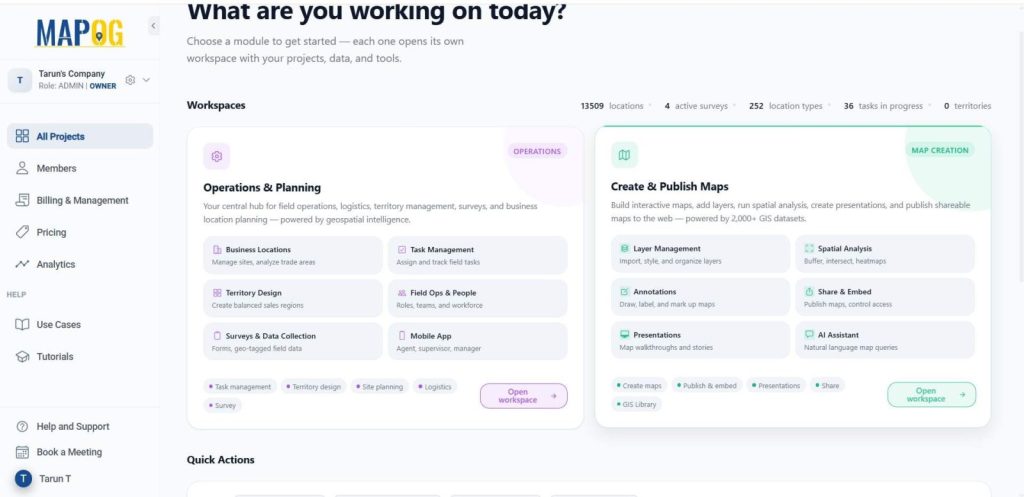
Open MAPOG, and click on Open Workspace in the Operations & Planning section — your central hub to manage field operations, logistics, surveys, and location planning in one place.
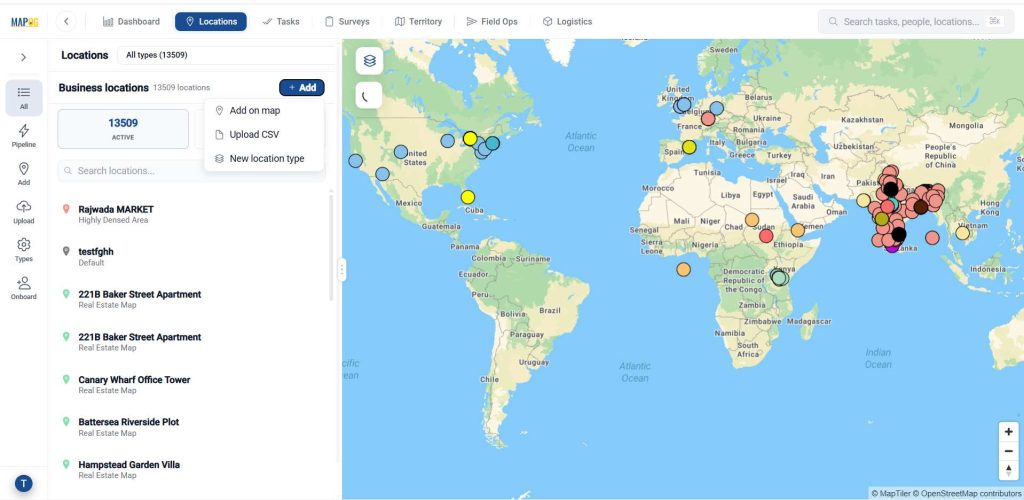
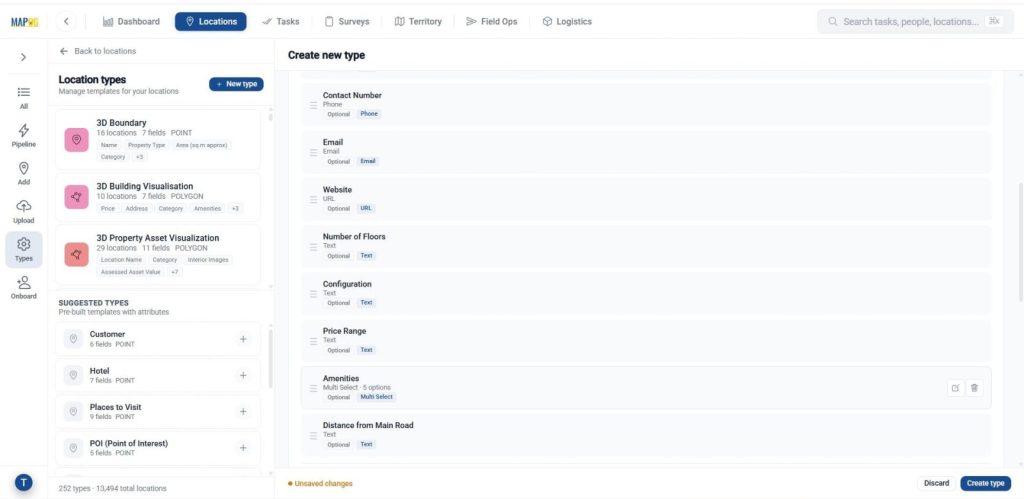
Then, Go to Locations, and click on Add, then select New Location Type to create a new Business Location Template. This ensures consistency and reusability.
Give a name, assign a suitable colour and select the geometry type as polygon.
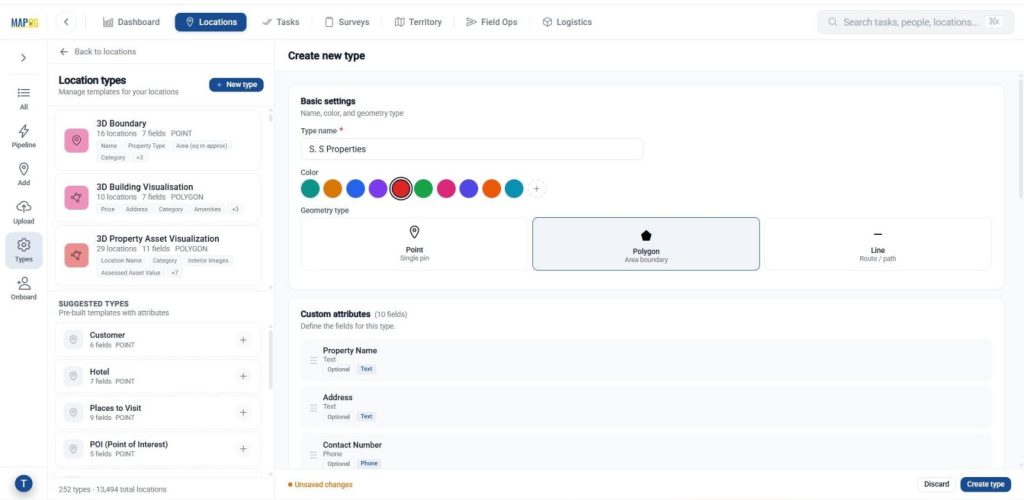
Add attributes that define your location such as name, Contact number, Email, Configurations and floors, using text, number, dropdown, or multi-select fields based on the information you want to capture. Once configured, then click create type to save the template.
Step 2 : Create a New Map
Come to the dashboard then, Click on Open Workspace in the Create & Publish section — where you can build interactive maps, add layers, run spatial analysis, and publish shareable maps using rich GIS datasets.
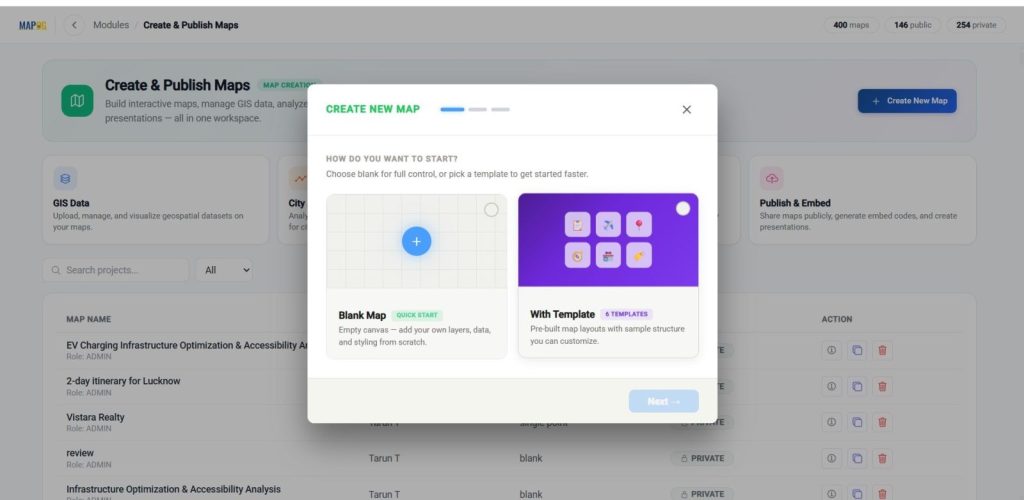
Then, click on Create New Map — choose Blank Map to start from scratch with your own data and styling, or With Template to use a pre-built layout you can quickly customize. Now click on the “with template” option.
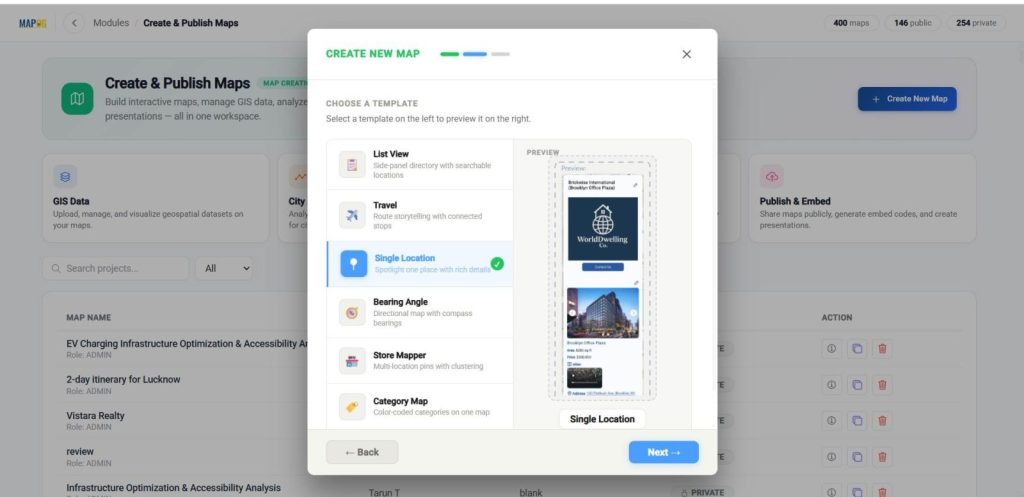
Then select with template options like single location, and click next.
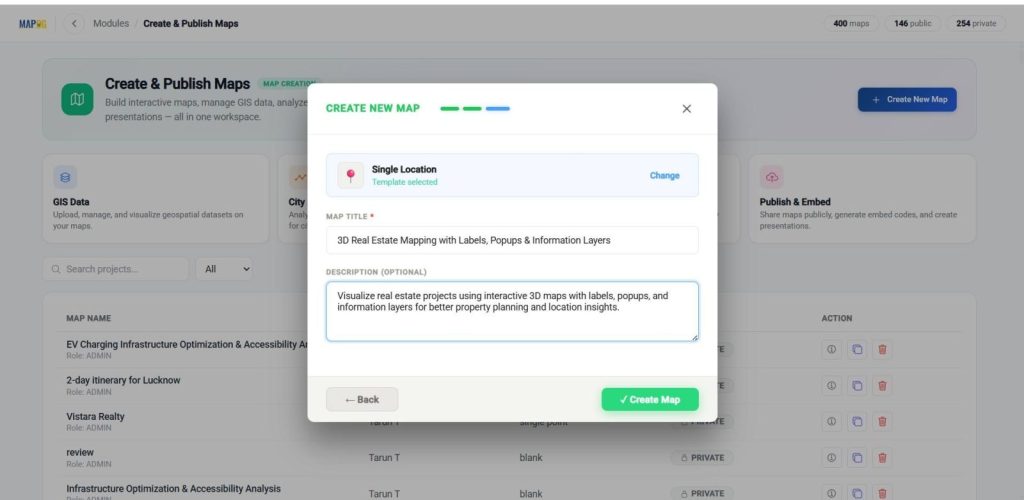
Then provide a title, description, then click create to initialize your project.
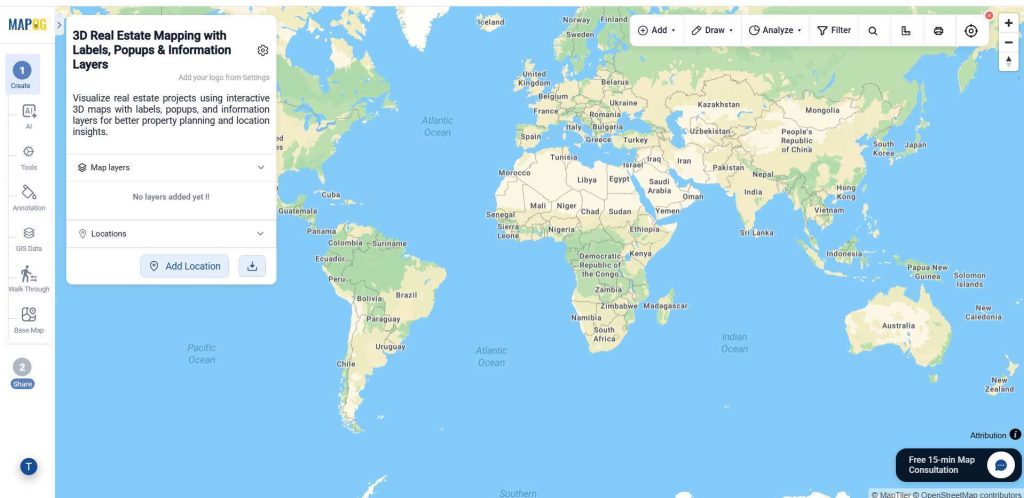
Finally, after coming to the interface, open the map settings.
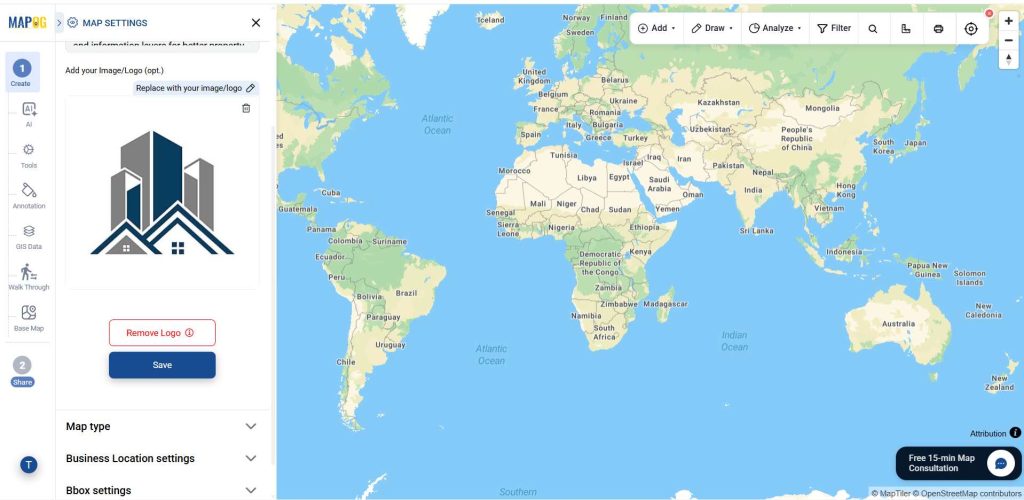
Browse & upload your logo, and save your changes.
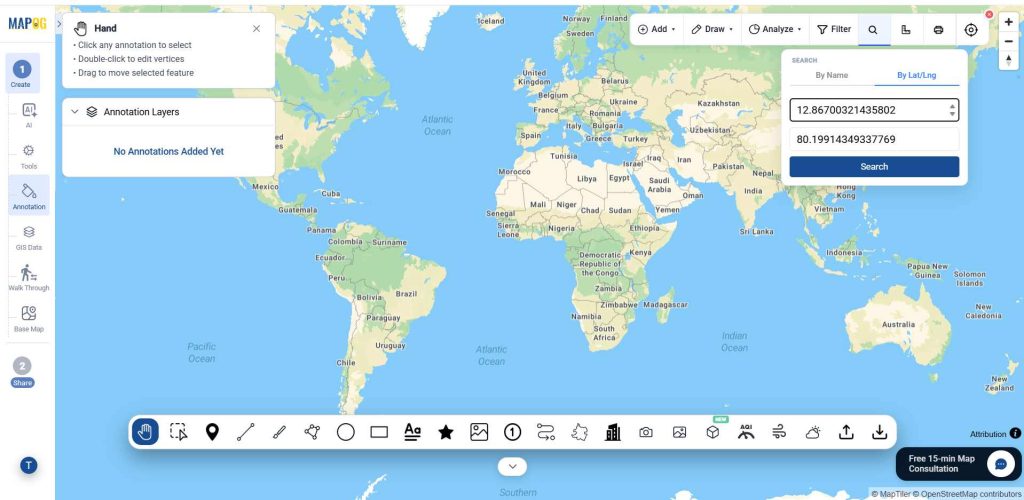
Step 3. Starting with the Annotation
After that, navigate to the annotation section and search for the exact location using a place name or coordinates to anchor the map with geographic accuracy.
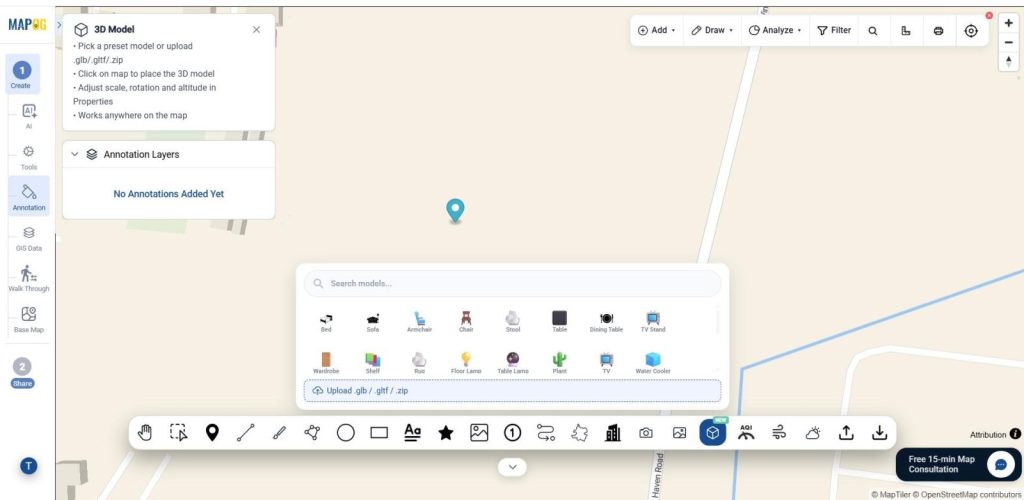
Subsequently, open the 3D model tool and upload the structure in GLB, GLTF, or ZIP format to integrate realistic building data into the map.
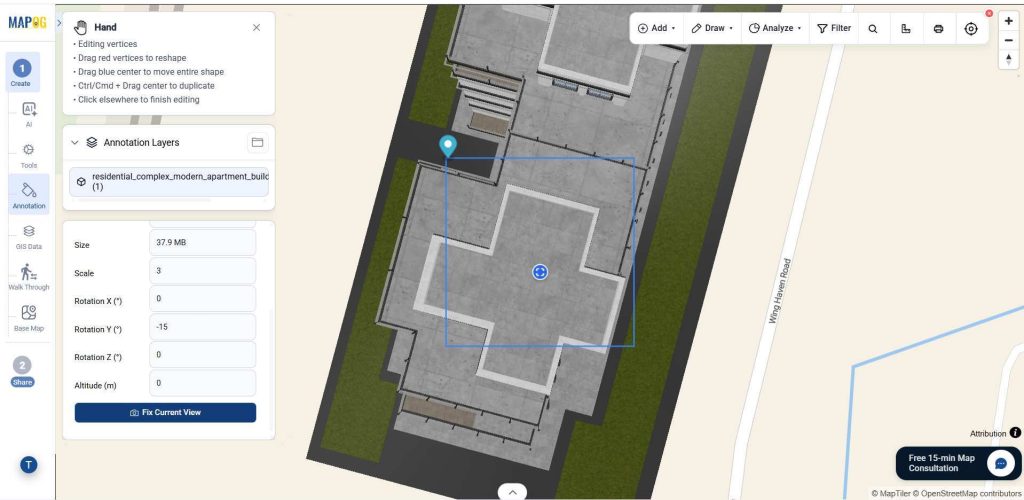
Moreover, the edit panel helps adjust the model’s name, opacity, scale, and altitude. Meanwhile, the X, Y, and Z rotation tools improve positioning so the object matches the actual landscape view. Once the adjustments are complete, click Fix View to lock the model onto the map.
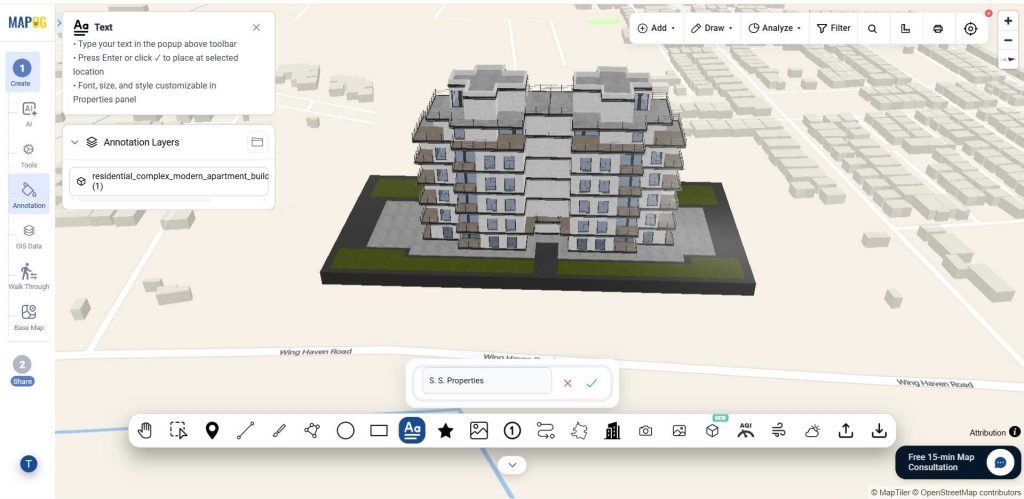
Then, select the text option and type the name of your 3D model in the text box.
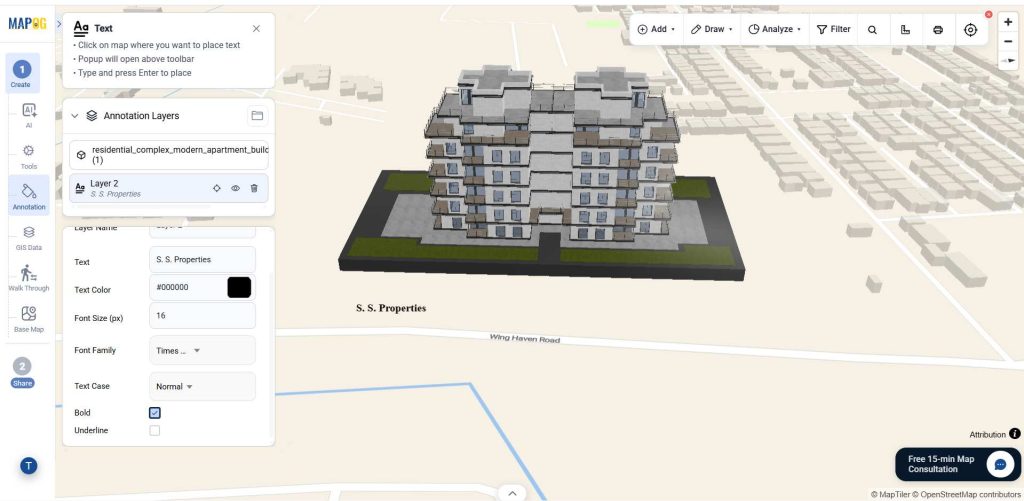
Then select the suitable font and color to your label.
Now, click the Add location, then select the Add manually option.
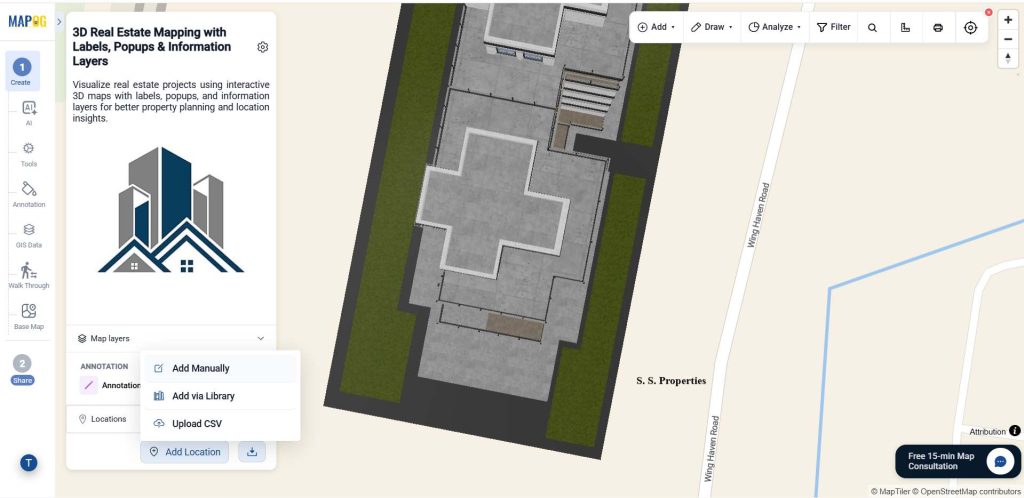
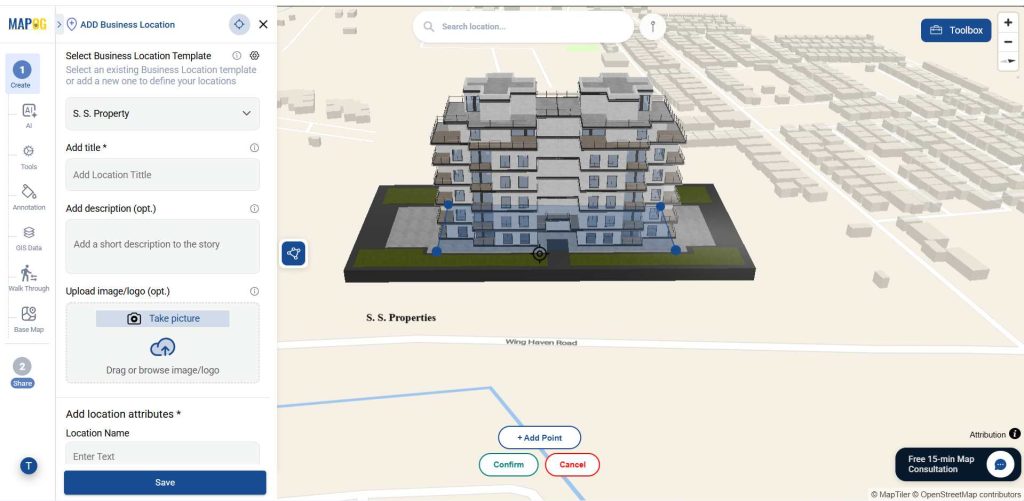
Select the created template from the dropdown and use the polygon draw tool to outline the building corners accurately using the add point option. Once the polygon is completed, confirm it.
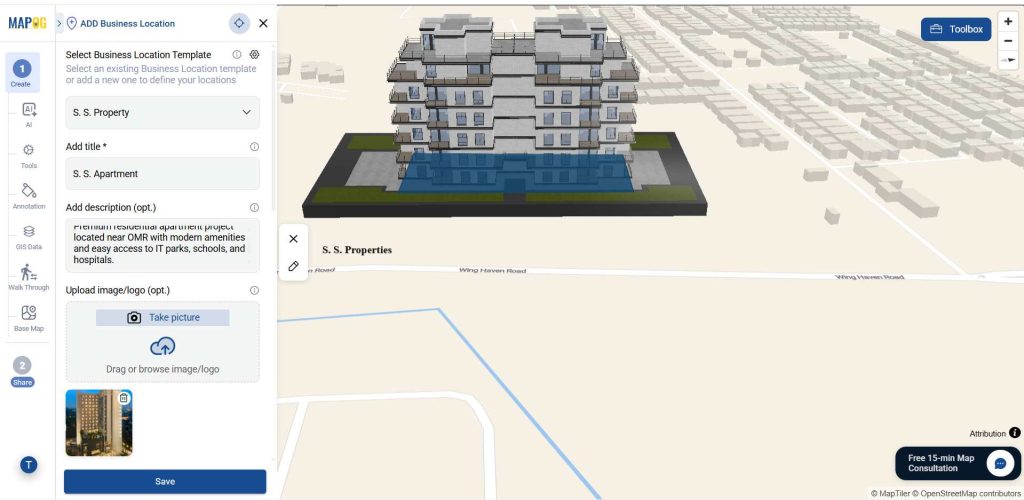
After that, save the location details with images, descriptions, and attributes.
Step 4: Add nearby point
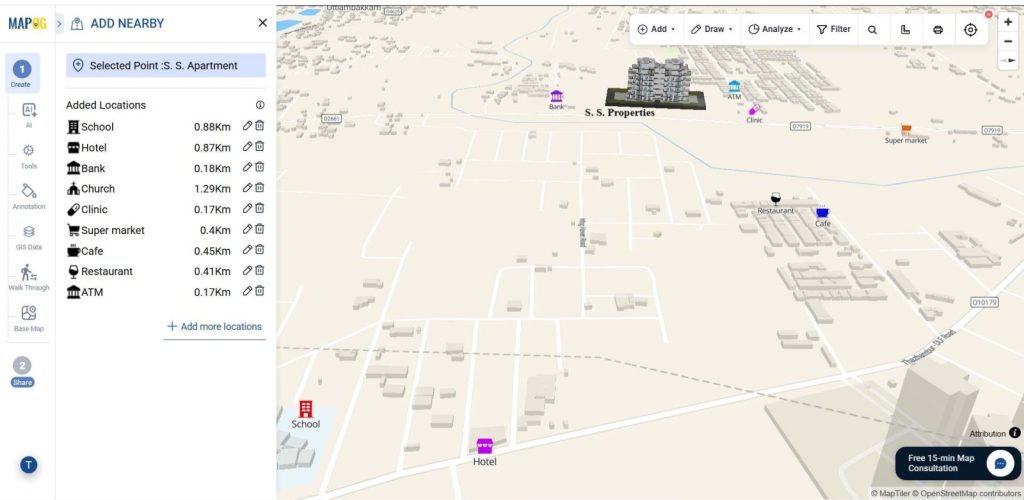
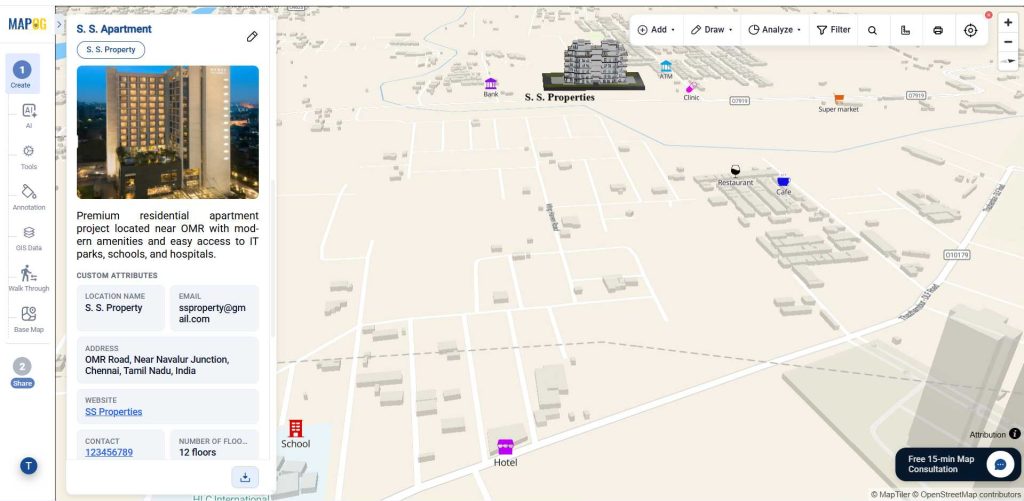
Go to the Add nearby points option, there you can add nearby amenities such as schools, cafes, parks, hospitals, and transit stations.
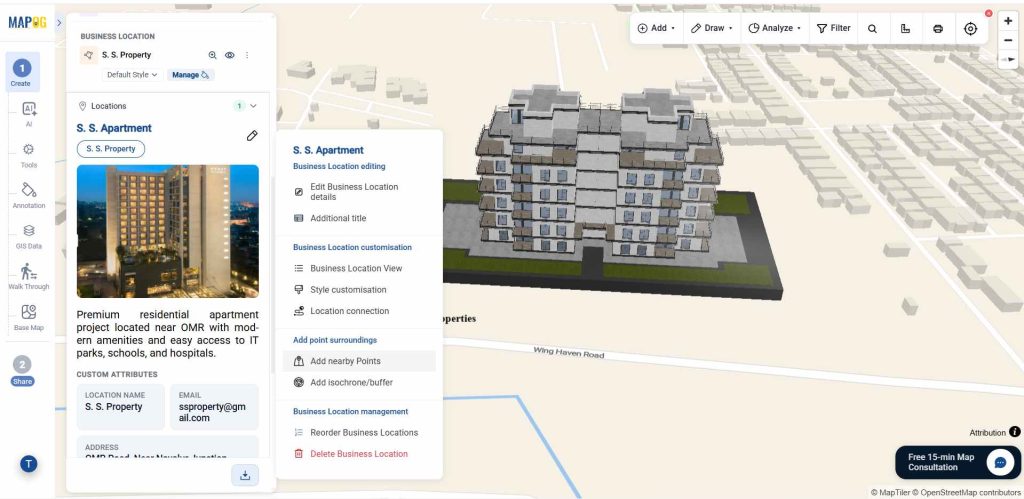
To plot nearby amenities, identify nearby places manually or for precise location use coordinates, confirm their locations, add a name and use the edit icon to update details like icon, color.
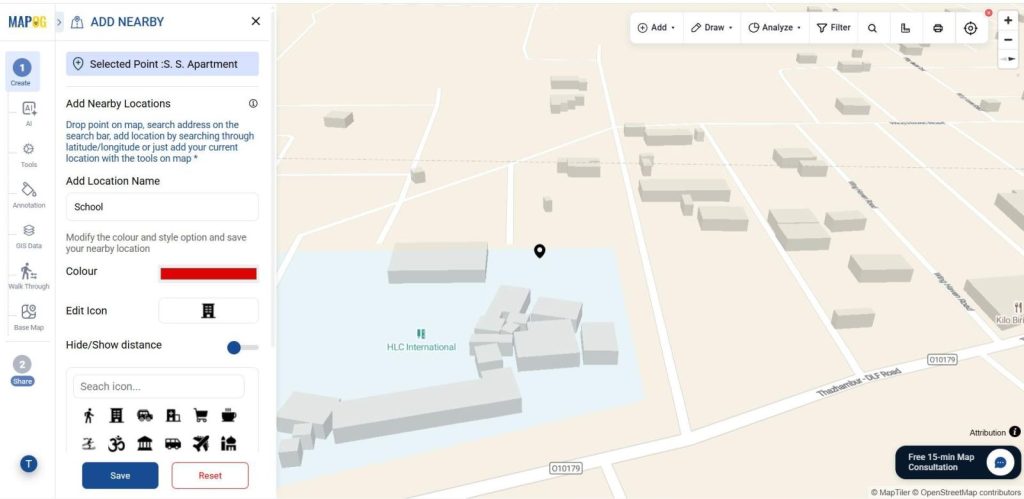
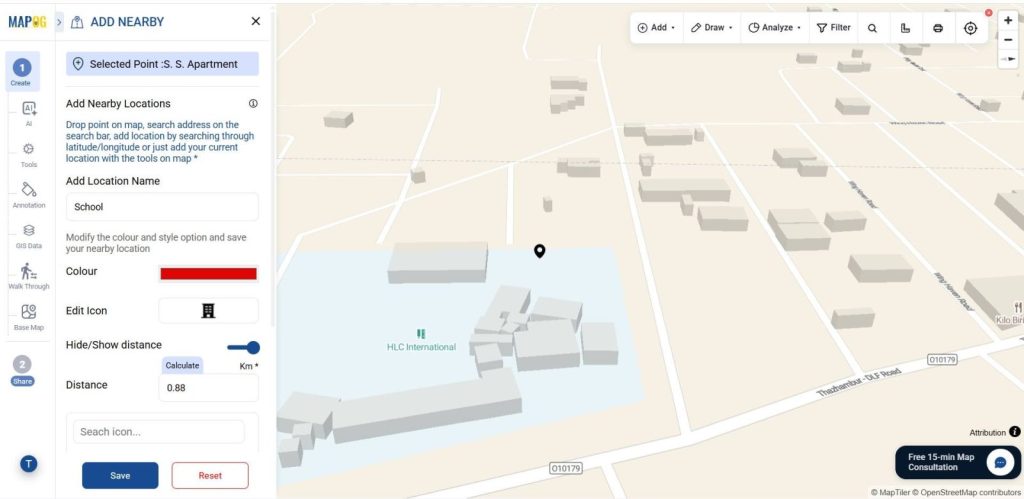
To display distance, enable the “Hide/Show Distance” option. Click “Calculate” to automatically show the distance in kilometers from your selected location.
This way you can add several amenities with icons & distance from your desired location.
Step 5: Preview & share option
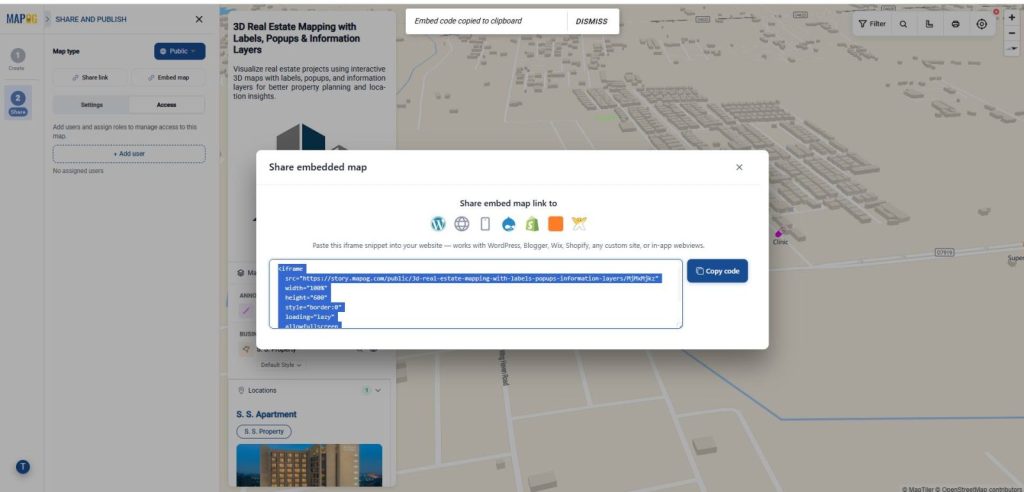
Then, go to Preview & Share. Use Add User to invite collaborators and assign roles—Editors can manage content and points (no admin/delete rights), while Viewers have view-only access.
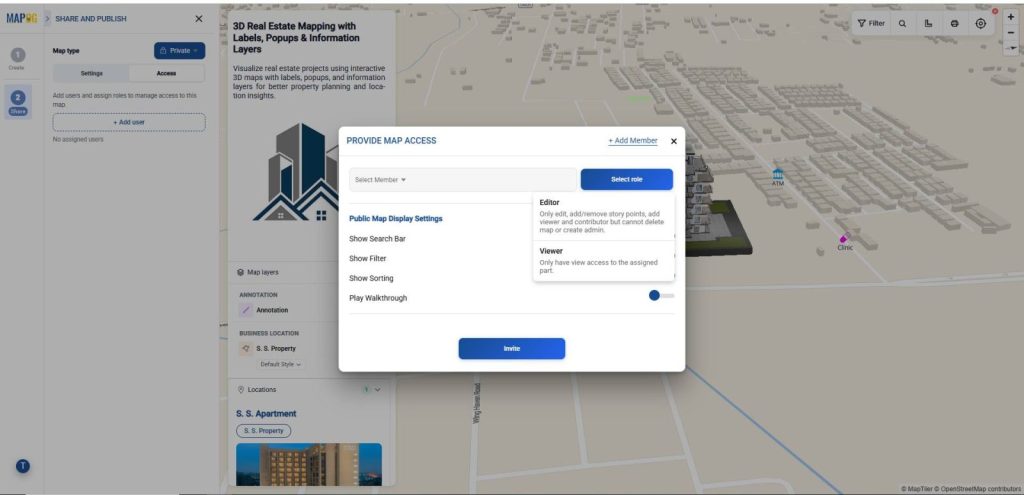
Switch the map from Private to Public to enable sharing. Use the Share Link for quick sharing via email, chat, or social media. To display your map on a website, select Share Embed Link and use the Embed Map option.
Applications of Information Layers with 3D Models
Real estate developers highlight nearby amenities to enhance listings. Buyers and investors assess proximity to key places. Agents share interactive maps for clarity, and marketing teams showcase neighborhood advantages visually.
Conclusion
Displaying property locations alongside nearby amenities on a shareable map transforms property browsing into a richer and more informed experience. With MAPOG, these interactive maps can be easily shared with clients, teams, or potential buyers, ensuring everyone views the same location insights in real time.