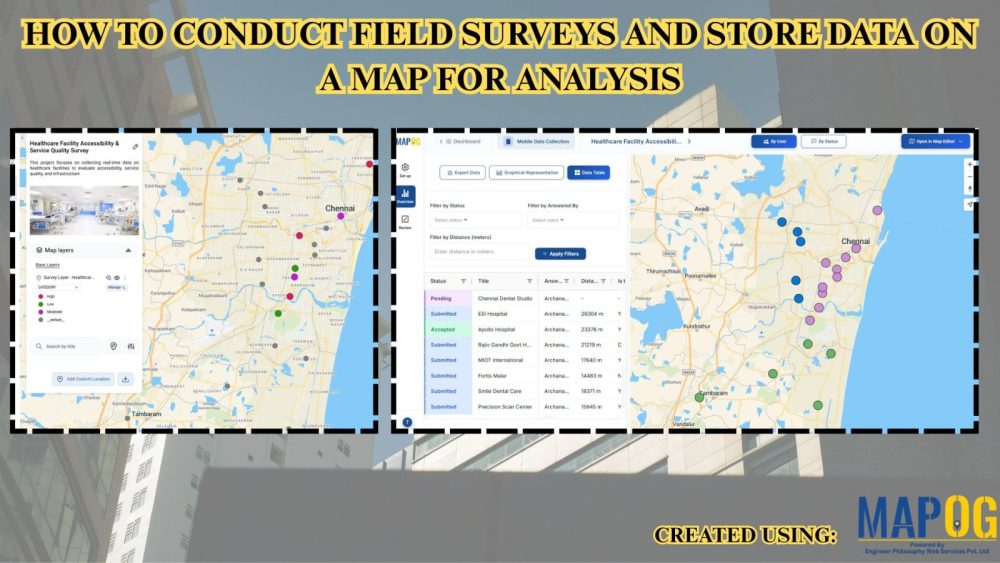
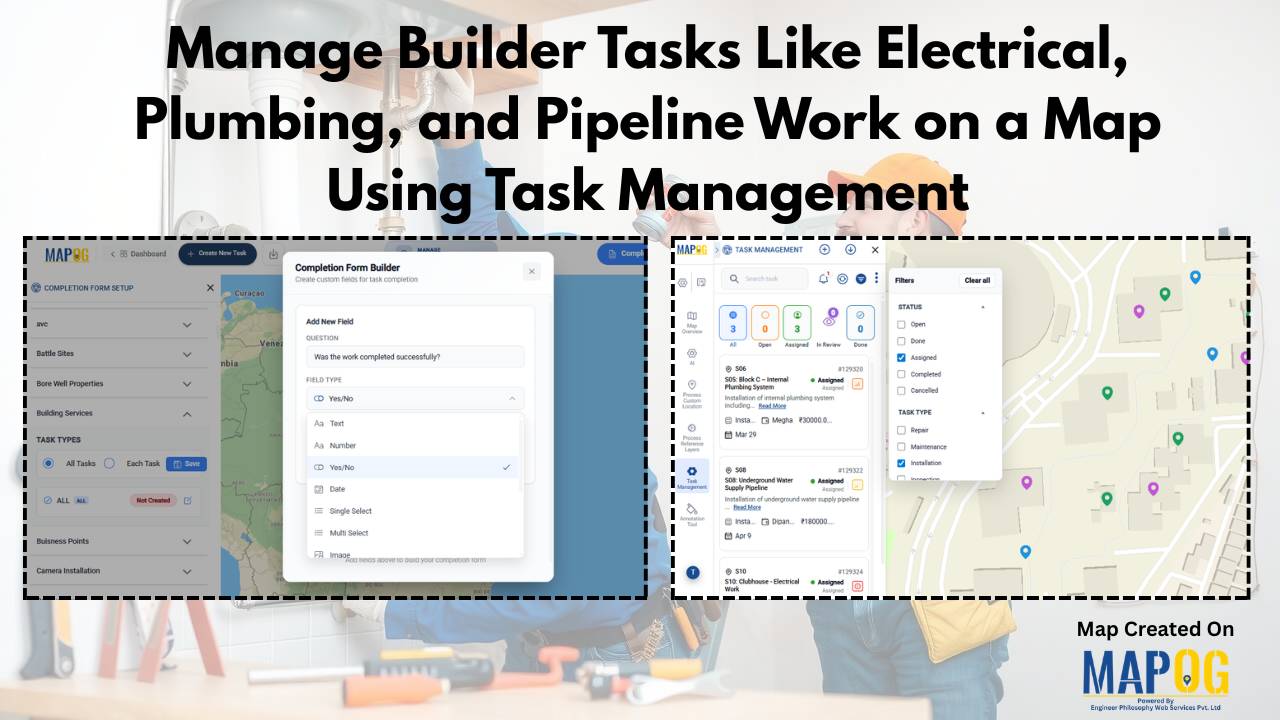
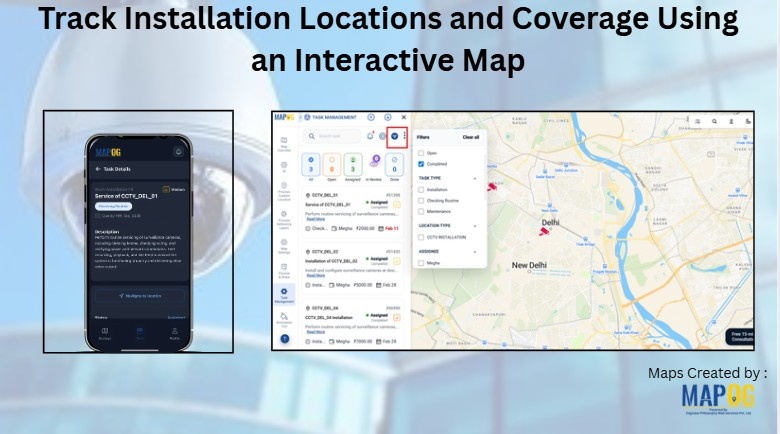
Online Mapping

Cover image Location-based dashboard to manage housekeeping tasks across hotel rooms.

How to Manage Housekeeping Tasks Using Location-Based Maps

Facility managers often struggle with paper checklists and delayed updates when tracking cleaning staff. Modern teams use visual dashboards to see which rooms need attention. This article shows how to manage housekeeping tasks using location-based maps with MAPOG. Key Concept: Manage Housekeeping Tasks Using Location-Based Maps A location-based map system digitally marks and color-codes each … Read more

Conduct Builder Field Surveys

Conduct Builder Field Surveys for Site Development and Pipeline Layout Using Mobile Data Collection

In construction and infrastructure projects, issues like inaccurate site notes and delayed updates hinder execution, leading to rework and cost overruns. To address these challenges, companies are turning to Conduct Builder Field Surveys utilizing digital mapping and structured mobile forms. This method, particularly through structured GIS workflows, enables real-time capture of pipeline alignments, soil types, … Read more

How to Track & Manage Interior Design Site Visits on a Map

How to Track & Manage  Interior Design Site Visits on a Map

Interior design teams often struggle with multiple site visits, scattered updates, delayed follow-ups, and low project visibility. When data is spread across tools, coordination slows and decisions take longer. Manage Interior Design Site Visits with MAPOG by bringing all locations, visit status, tasks, timelines, and teams into one clear, interactive map with real-time data, improving … Read more

Visualize Property Assets Using 3D Building Mapping

Visualize Property Assets Using 3D Building Mapping

Traditional spreadsheets and flat property listings hide high-value real estate assets to flat rows of data, critical spatial context making it hard to understand location impact, building scale, and asset relationships slowing decisions and increasing guesswork. MAPOG changes this by transforming real estate data into interactive 3D building maps, allowing teams to Visualize Property Assets … Read more

Plan multi day travel routes

Plan Multi-Day Travel Routes Using Interactive Maps

Having to plan multi-day travel routes can quickly become overwhelming when destinations, routes, and travel times aren’t clearly visualized. Traditional itineraries often fail to show how places connect across days, as a result, leading to inefficient routes, rushed schedules, and missed experiences. For travel agencies, and destination management companies, this lack of clarity complicates planning … Read more

Cover image showing annotated travel routes.

How to Explain Travel Routes Using Map Annotations

Travel agencies struggle to present complex itineraries because raw GPS tracks and scattered notes often confuse tourists. Consequently, travelers lose context, and memories fade into fragmented data. However, businesses now Explain Travel Routes Using these Travel Maps to transform these fragments into interactive experiences. By using the MAPOG’s Map annotation tool, travel professionals weave routes, … Read more

Dashboard view demonstrating how to Filter Only the Locations That Need Action within a 5 km radius on a map using proximity and status-based filters.

How to Filter Only the Locations That Need Action Within a 5 km Radius

Managing multiple locations efficiently becomes challenging when you need to identify which sites require immediate attention. MAPOG‘s dynamic filtering system helps businesses streamline operations by pinpointing critical locations within specific geographic boundaries. Learning how to filter only the locations that need action within a 5 km radius transforms scattered data into actionable insights. Key Concept: … Read more

Filter Properties for Insights

How Developers Use Filters to Visualize Properties by Price, Type & Status

In today’s real estate tech landscape, clarity and precision in data visualization are essential for smarter property decisions. Simply listing properties isn’t enough-you need a way to slice, sort, and understand them instantly. That’s where Interactive filters come in. By Filter Properties for Insights based on price range, property type, and availability status, maps become … Read more

Capture Drug Inspection Data

Capture Drug Inspection Data and Photos from the Field

Capture Drug Inspection Data efficiently is no longer optional—especially when inspections happen across multiple locations and teams. Today, field teams need a reliable way to collect store details, verify compliance, and upload photos in real time. With MAPOG’s Mobile Data Collection and the MAPOG Contributor App, we can plan drug inspections, assigned, captured, and reviewed … Read more

Analyze Village Healthcare

How to Analyze Village Healthcare Coverage Using Maps

To analyze village healthcare coverage, planners increasingly use maps because they turn scattered health data into clear, visual insights. In rural planning, decision-makers often delay actions due to poor visibility. However, when analysts map villages and healthcare facilities together, they identify coverage gaps faster. As a result, MAPOG make village healthcare coverage analysis not only … Read more