Healthcare systems often face fragmented data and limited visibility, therefore planning and service delivery become challenging. However, MAPOG mobile data collection capability helps teams conduct Healthcare Facility Surveys and analyze accessibility by capturing accurate field surveys and store data in real time, ensuring consistency and enabling faster, data-driven decisions.
Key Concepts: Field Surveys and Store Data
The key concept focuses on integrating field observations with map-based insights. Teams capture healthcare facility details on-site and convert them into visual layers. Then, simple styling enables quick comparison, so they can analyze accessibility, service gaps, and performance with clarity and consistency.
Step-by-Step Workflow: Field Surveys and Store Data
Simple steps to collect, map, and analyze data
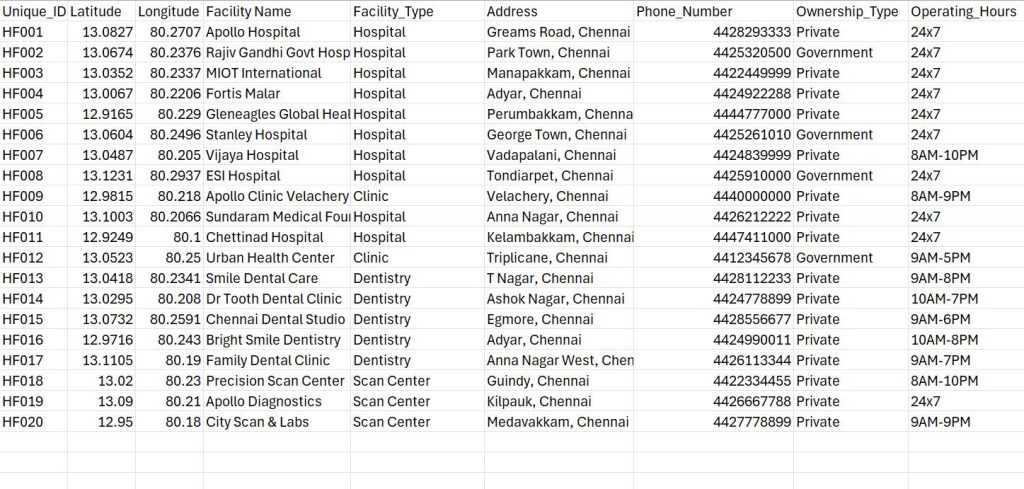
1. Healthcare Locations Master Dataset
First, collect all healthcare facility coordinates and details in one master spreadsheet.
2. Configure the Survey Project
Log in to your MAPOG account and open the Survey Dashboard to get started.
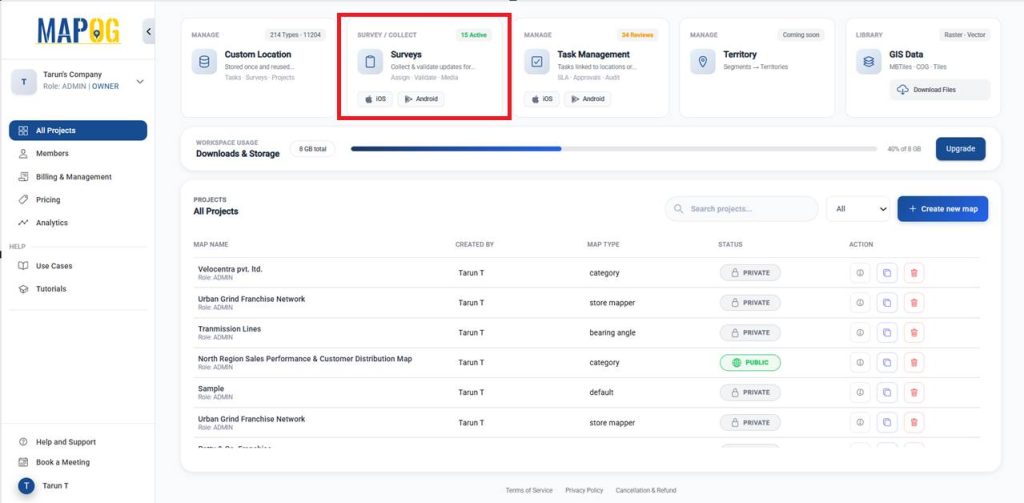
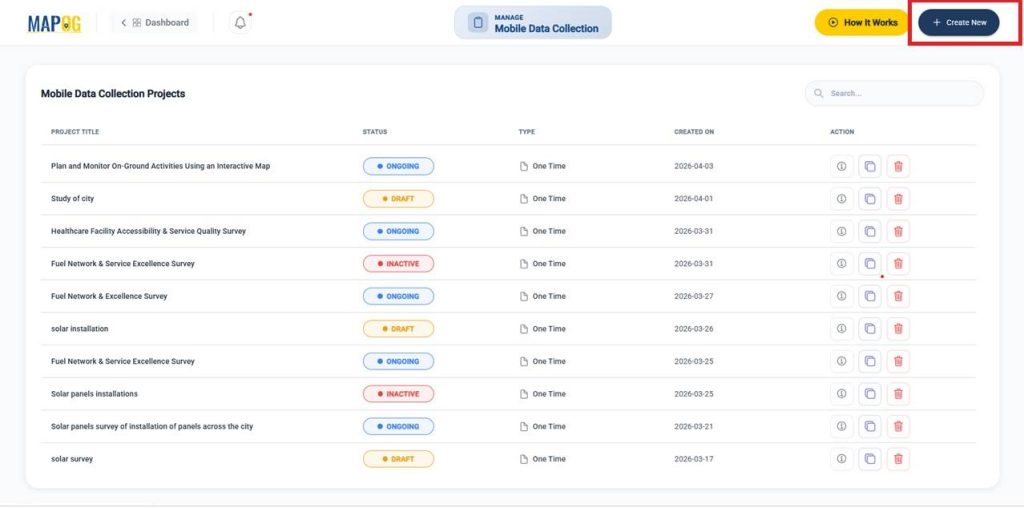
Then, select + Create New in the Mobile Data Collection section to begin a new survey project.
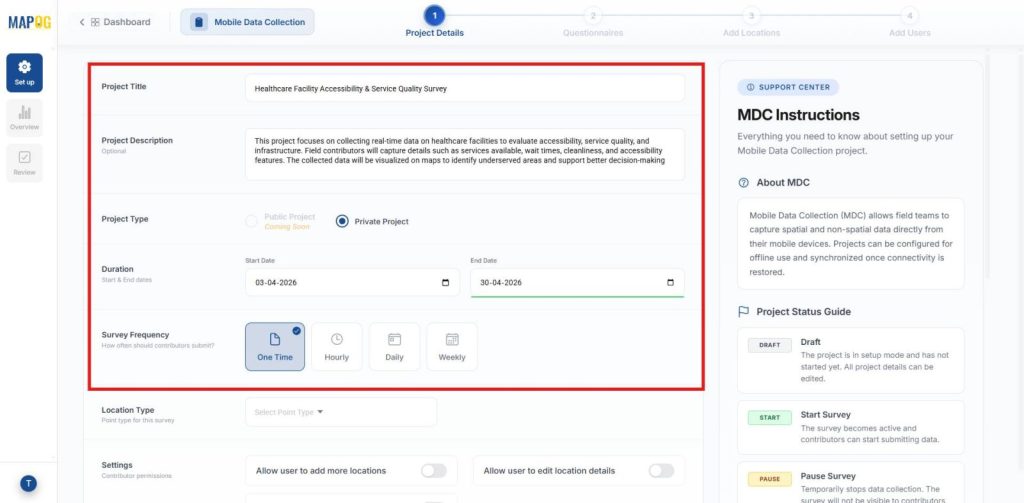
Define project details – title, description, type, duration, and survey frequency for structured data collection.
Next, go to Location Type to + Create New custom location template for accurate and structured location data collection.
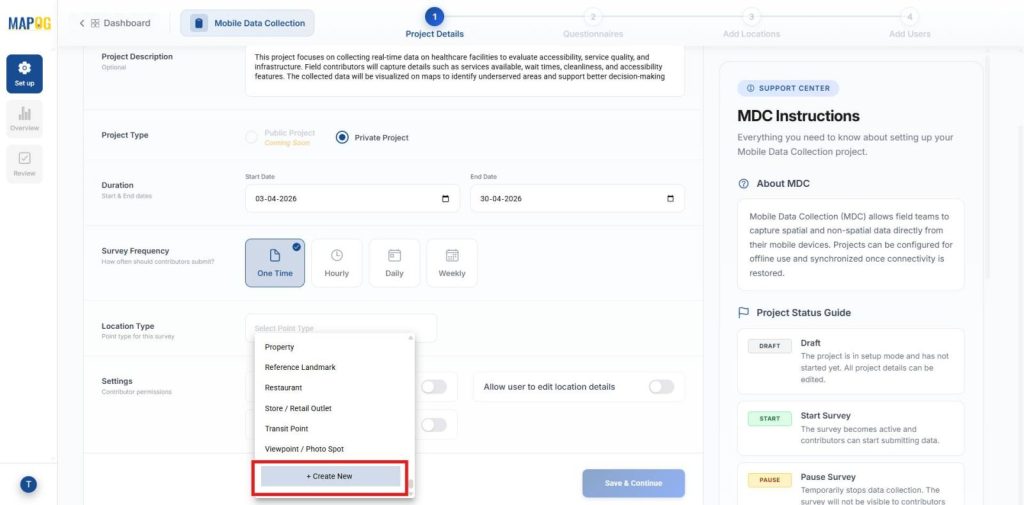
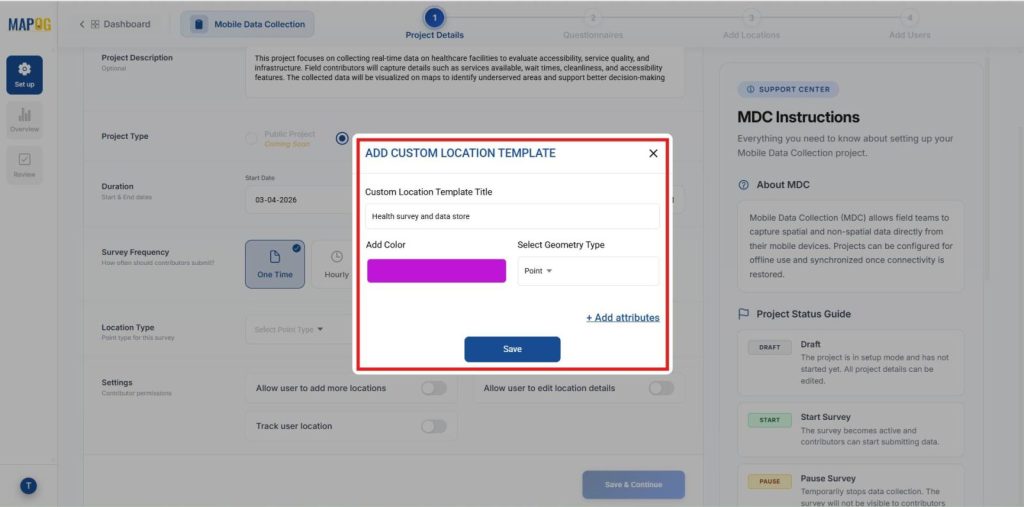
Create a custom template via + Create new, name it, choose Point geometry, assign a color, and save for consistent data collection.
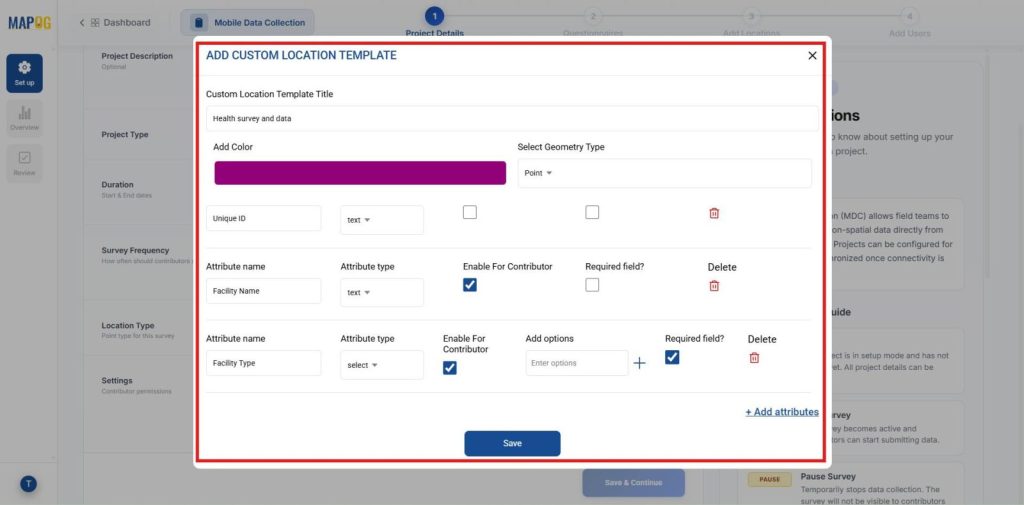
Add attributes (Address, Status), set types (Text, Select, Image, Multiselect), enable Allow for Contributor so that contributors can update data from site, mark important fields required, then save the template.
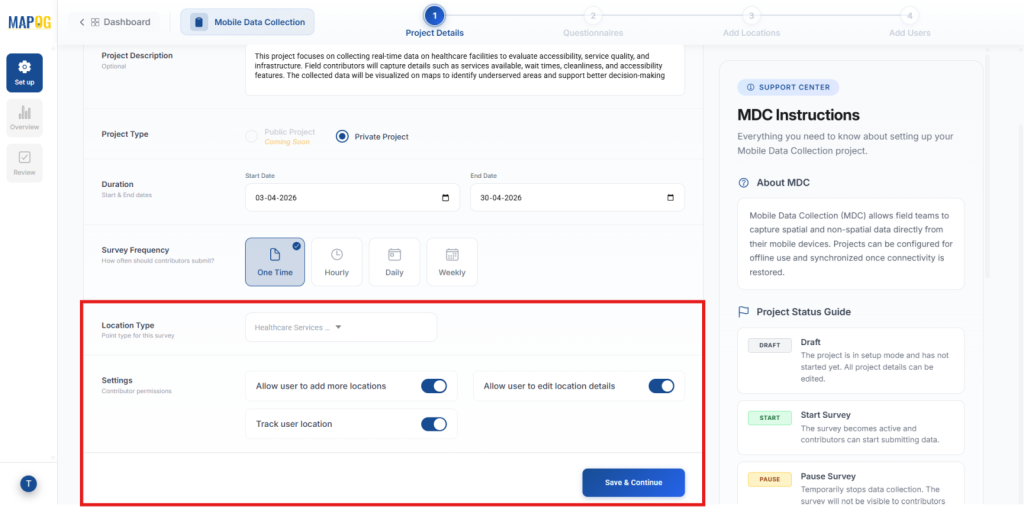
Select from the dropdown, set Contributor Permissions (add/edit locations, track users), then click Save & Continue.
3. Create a Structured Questionnaire
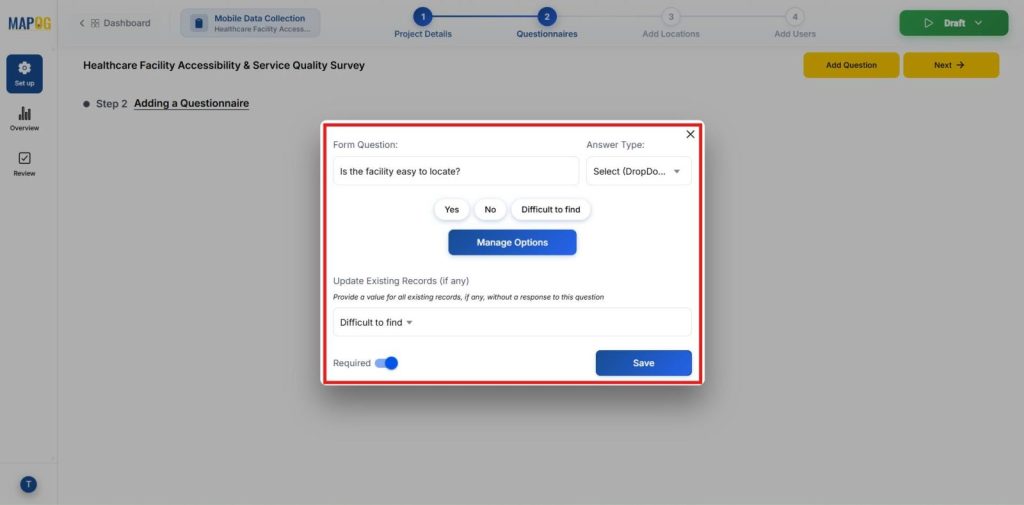
After completing the setup, go to the Add Question section to create your questionnaire.
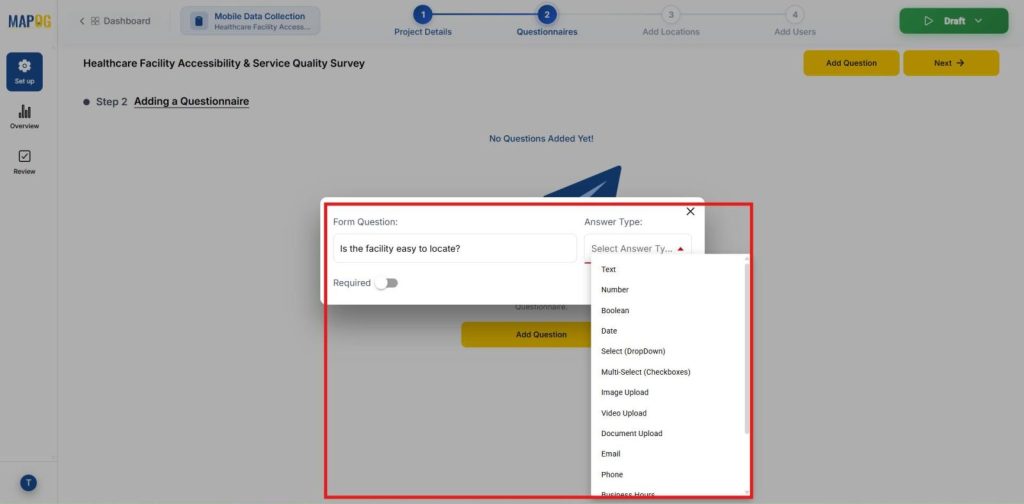
Create clear, topic-based questions to capture specific information. Choose suitable input types—Text for names, Select/Multiselect for options, and Image for verification—then mark required fields to ensure complete and accurate data collection.
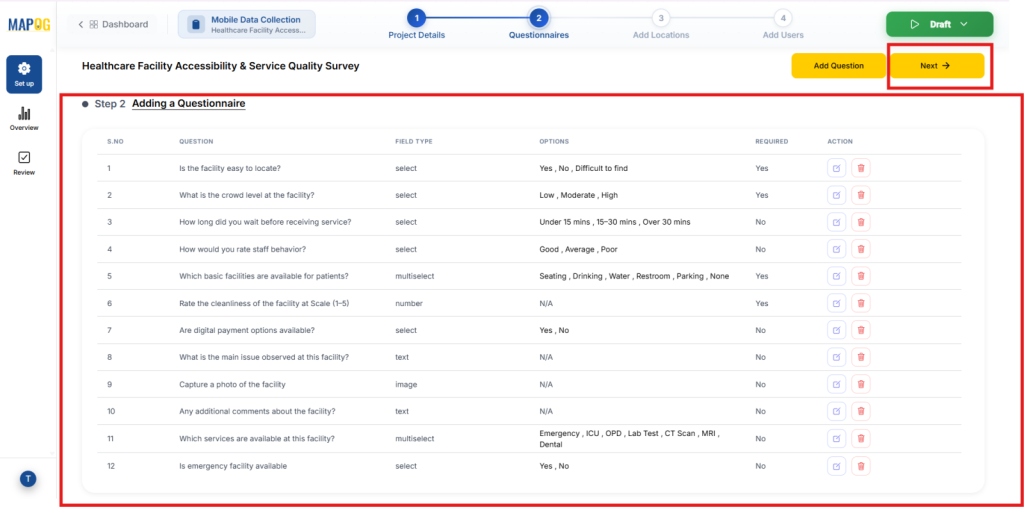
After adding questions, review for accuracy and completeness, then proceed to the next step.
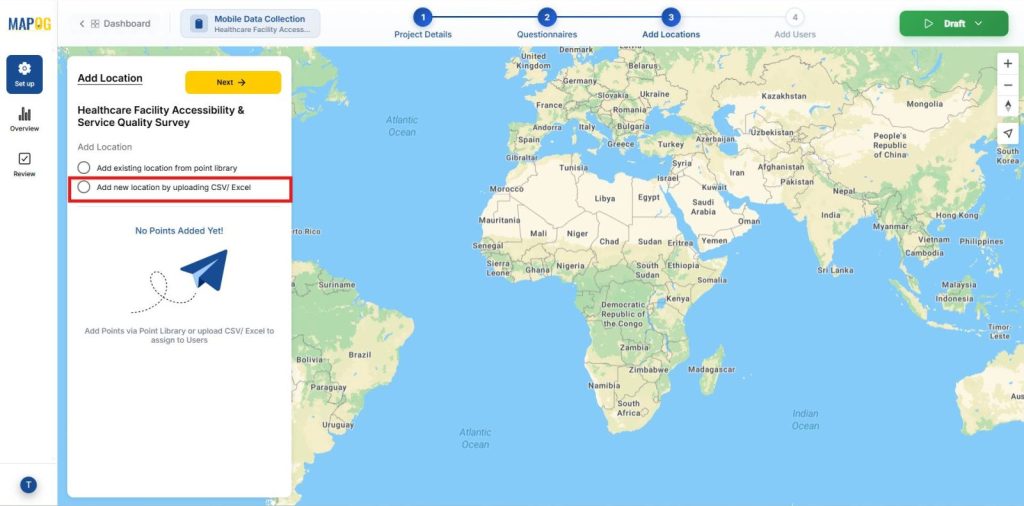
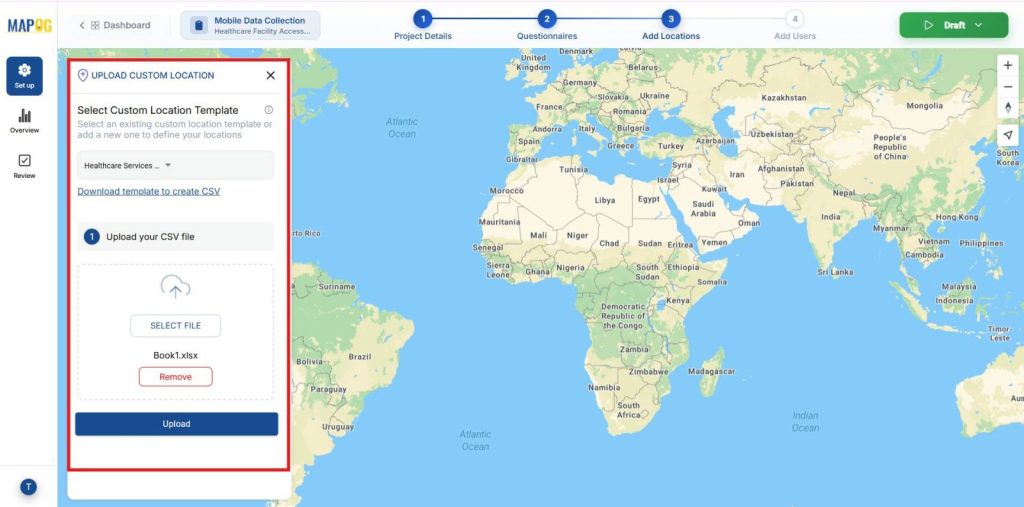
4. Import locations using Excel
With your questionnaire ready, use Add new location by uploading CSV/Excel to import and map multiple locations at once.
Then, upload the Excel file to import locations, and the system will automatically apply your created template.
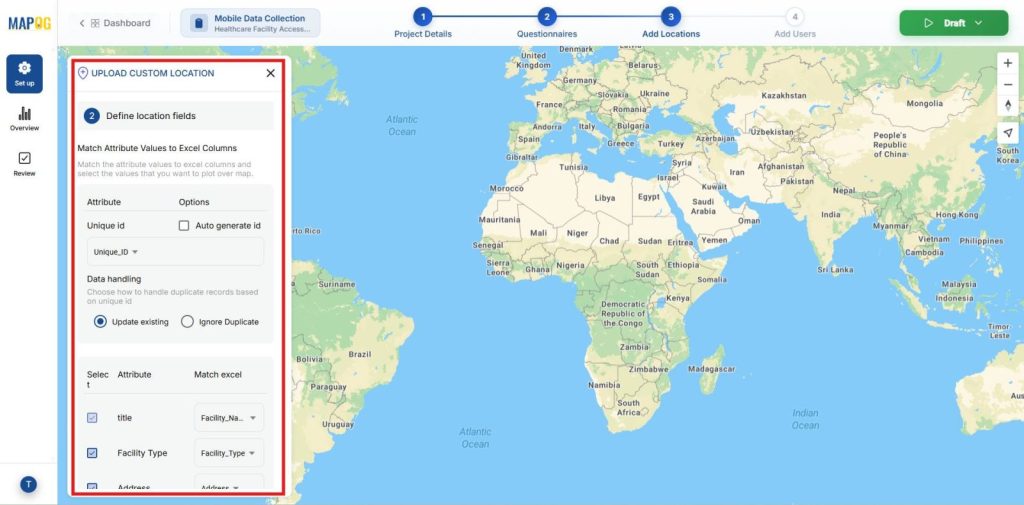
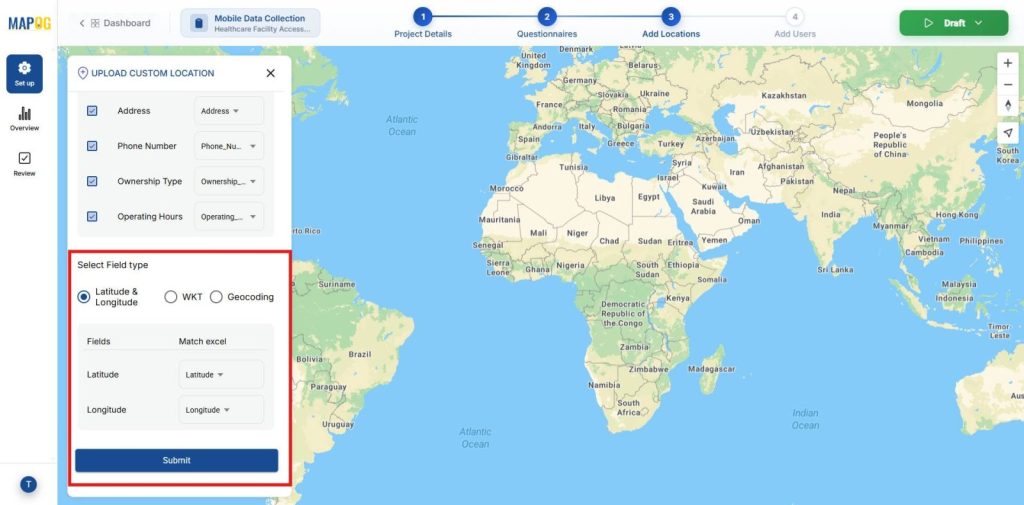
Similarly in Define Location Fields, set a Unique ID or Auto Generate, map attributes to Excel columns, choose display fields, and select Update or Ignore Duplicates.
Assign Latitude and Longitude correctly under Select Field Type, then click Submit to complete the import.
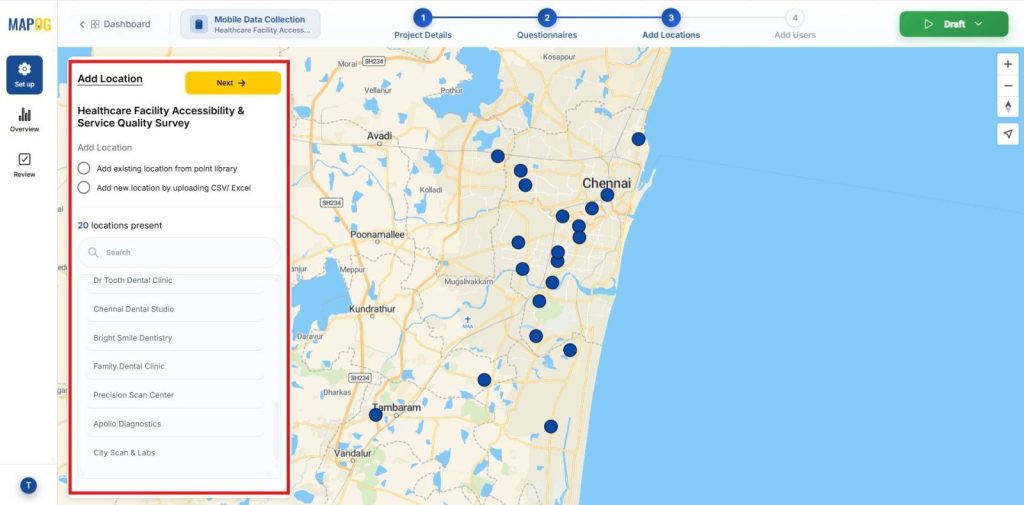
All store locations will now be displayed as points on the map automatically and move to next.
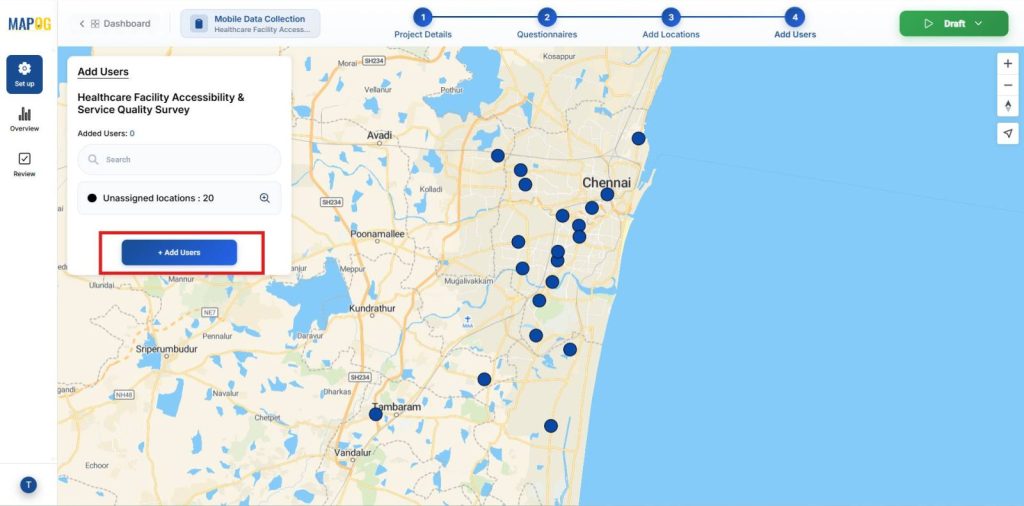
5. Add Contributors and Assign Zones
After importing the data, go to the Add User section to manage your survey team and click Add Member to include new contributors.
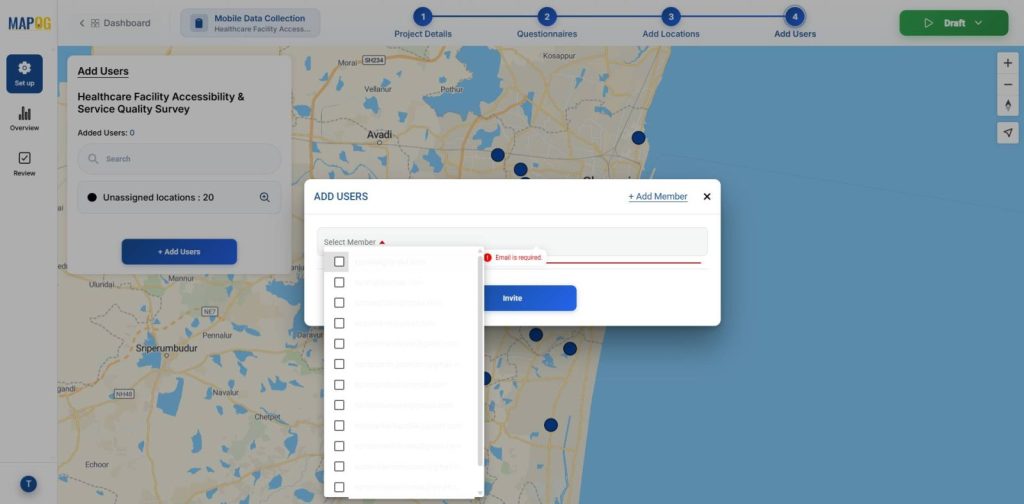
In Add Users, choose from existing users and assign them as members.
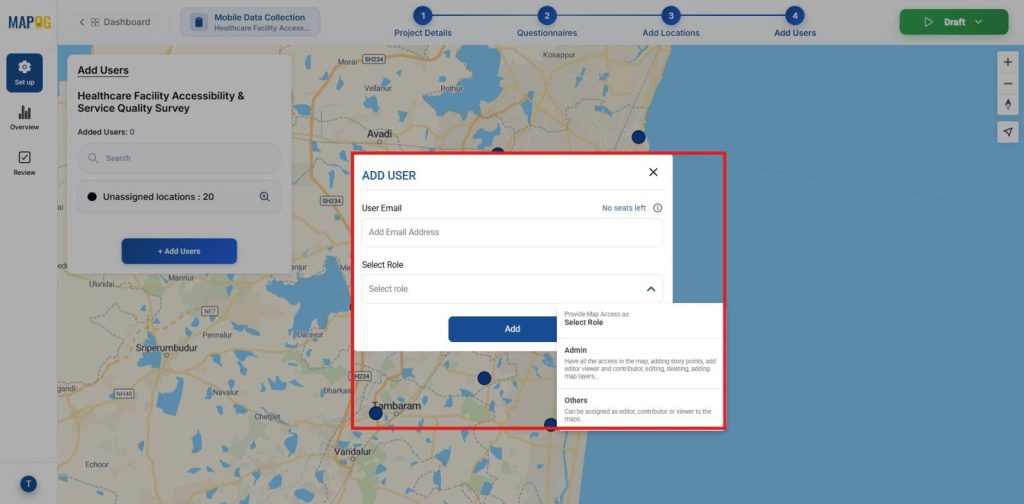
To include new users, enter their email ID, assign a role, and click Save.
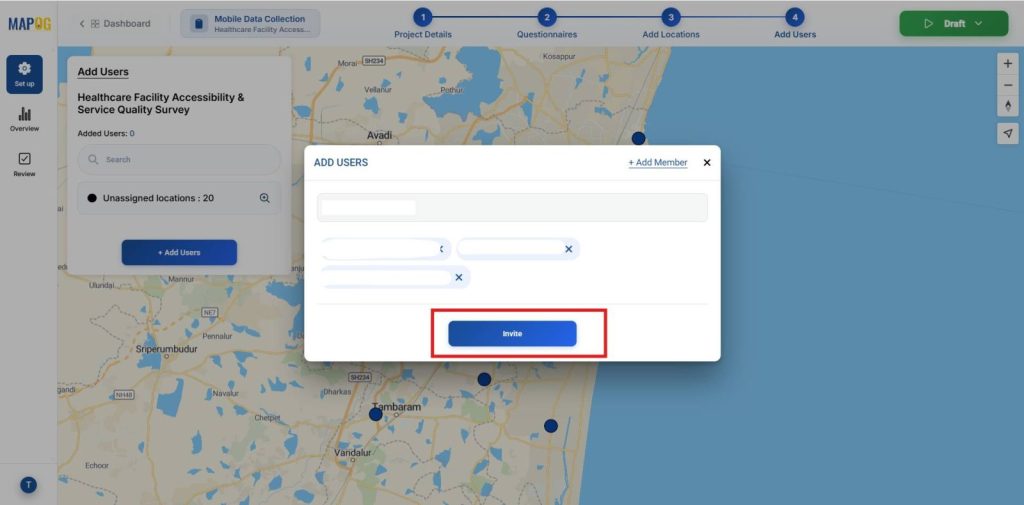
Next, choose the added members from the list and click Invite to assign them as contributors.
Select a contributor and use the map tool to draw assigned areas, helping you divide regions and allocate specific locations to each team member.
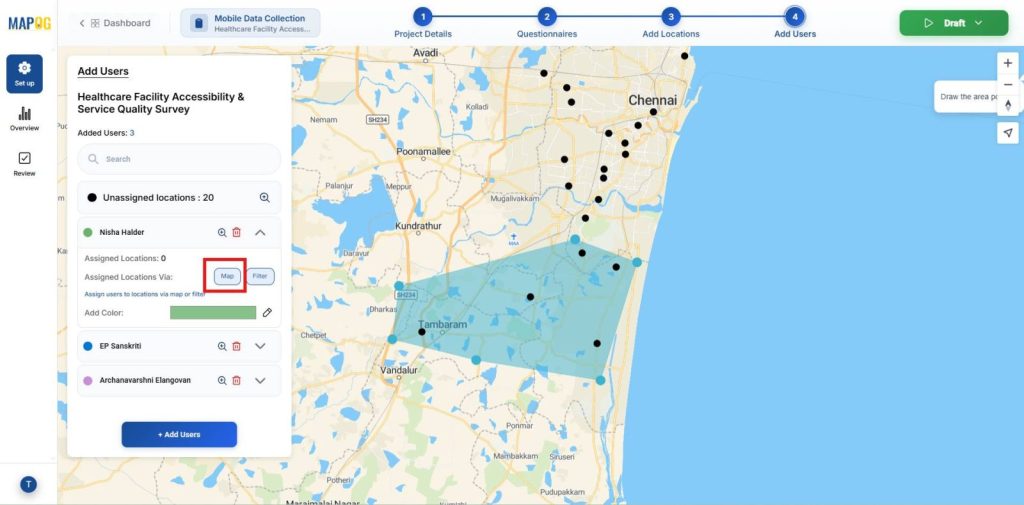
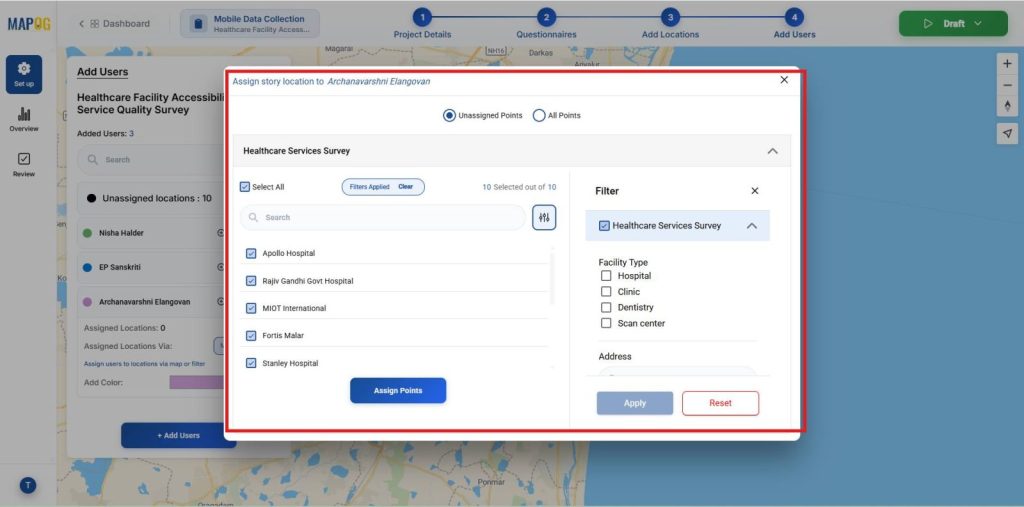
Use the filter tool to sort map points by assigned or unassigned status, making it easy to quickly allocate remaining locations to available team members.
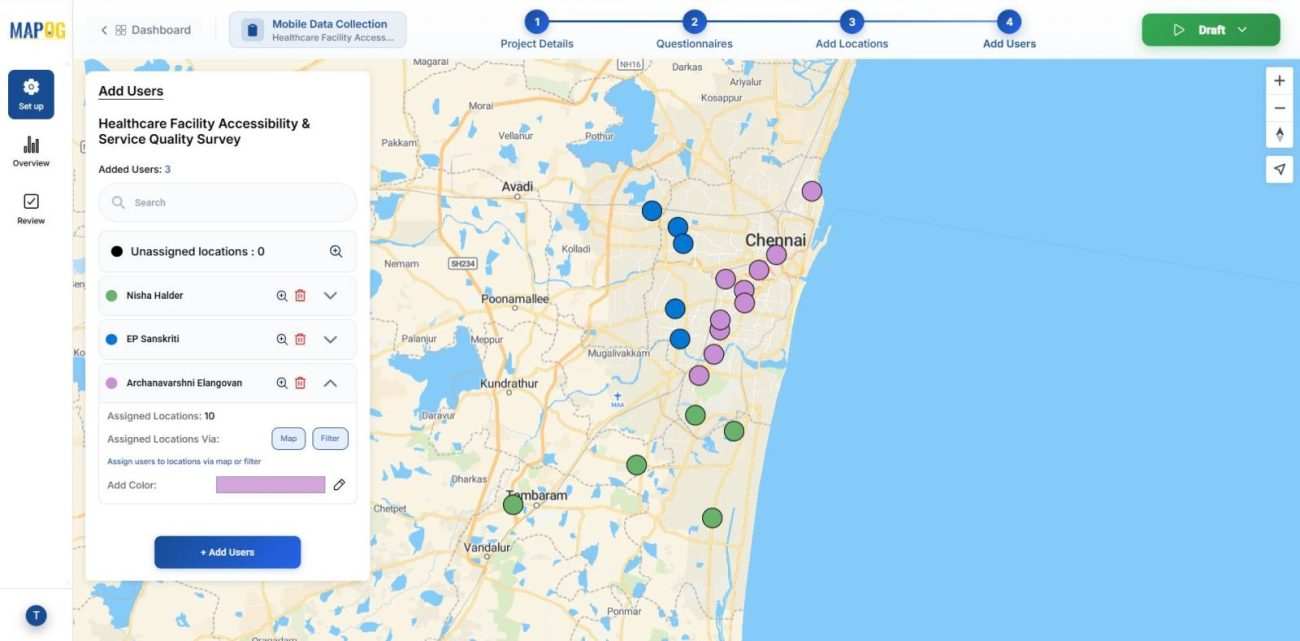
Assign distinct colors to each contributor’s area for clear and quick visual identification.
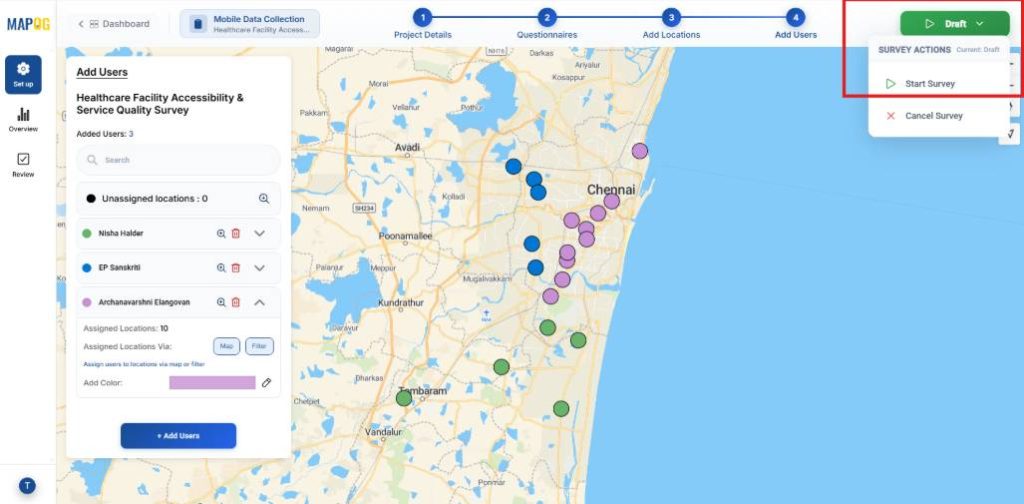
6. Launch Survey & Analysis
With setup complete, go to Survey and click Start Survey to begin real-time data collection.
Assignees open the MAPOG Contributor app, go to assigned areas, add locations, record new sites, enter details, and submit for mapping.
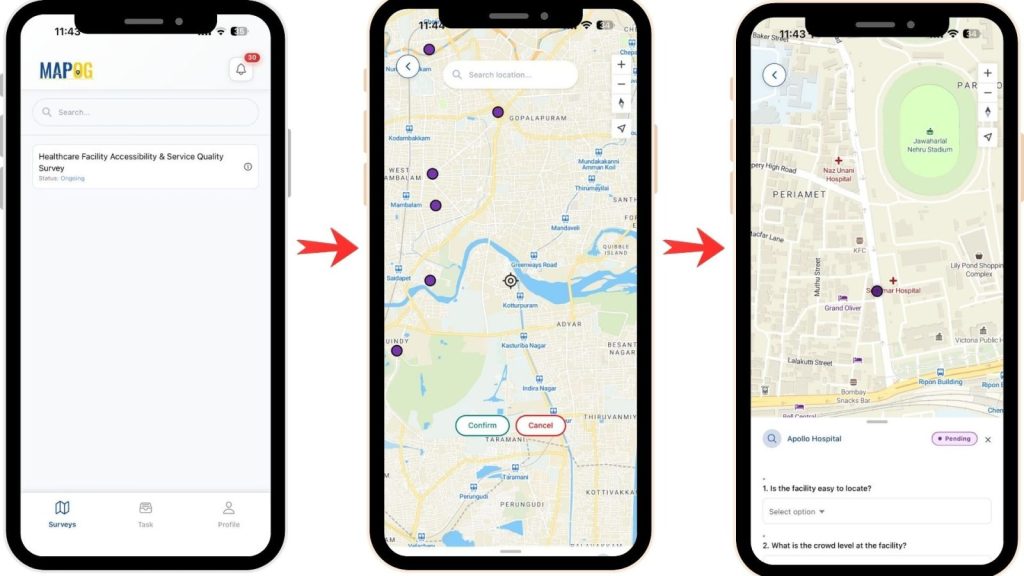
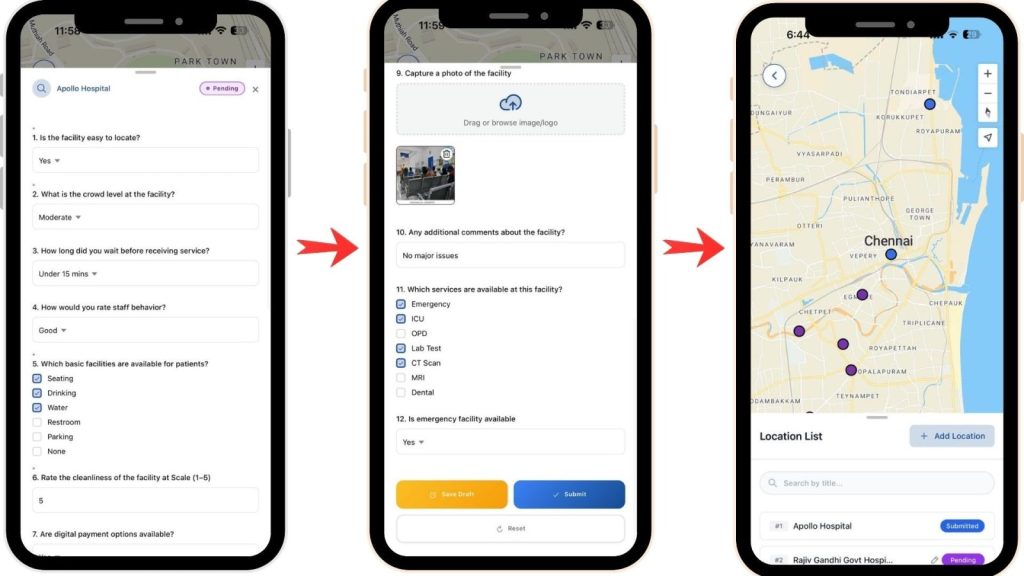
Users can open the questionnaire, enter responses, upload images, and then submit it or save it as a draft for later.
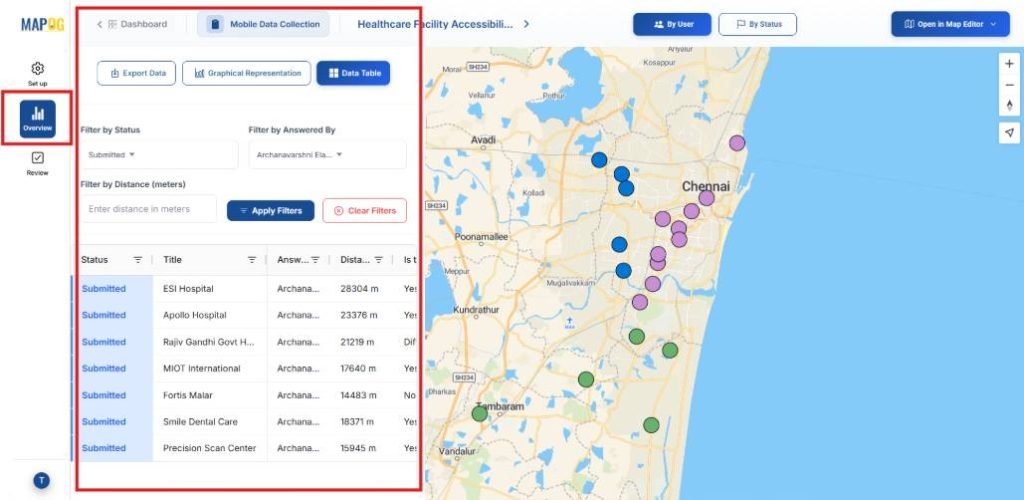
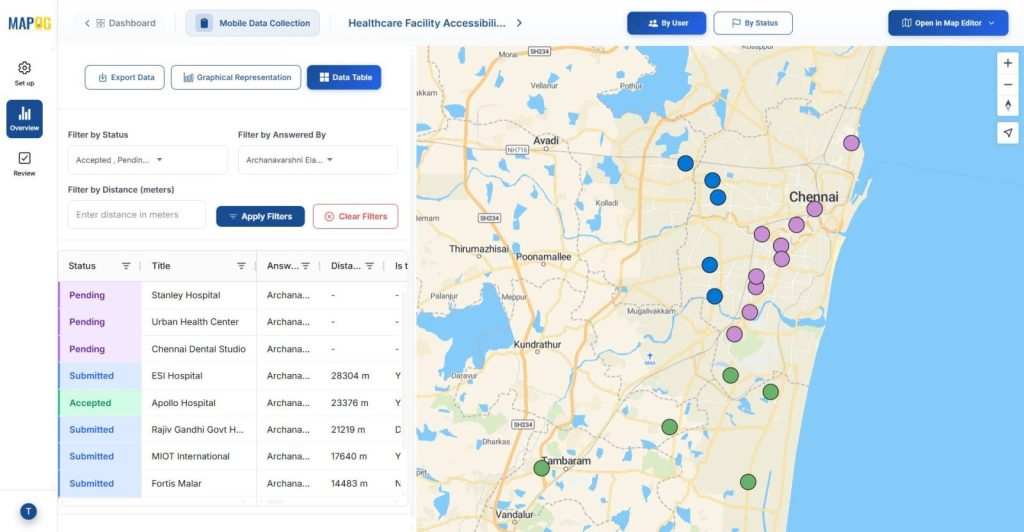
Furthermore, Use the Overview dashboard and apply filters to track progress and view real-time updates in a data table.
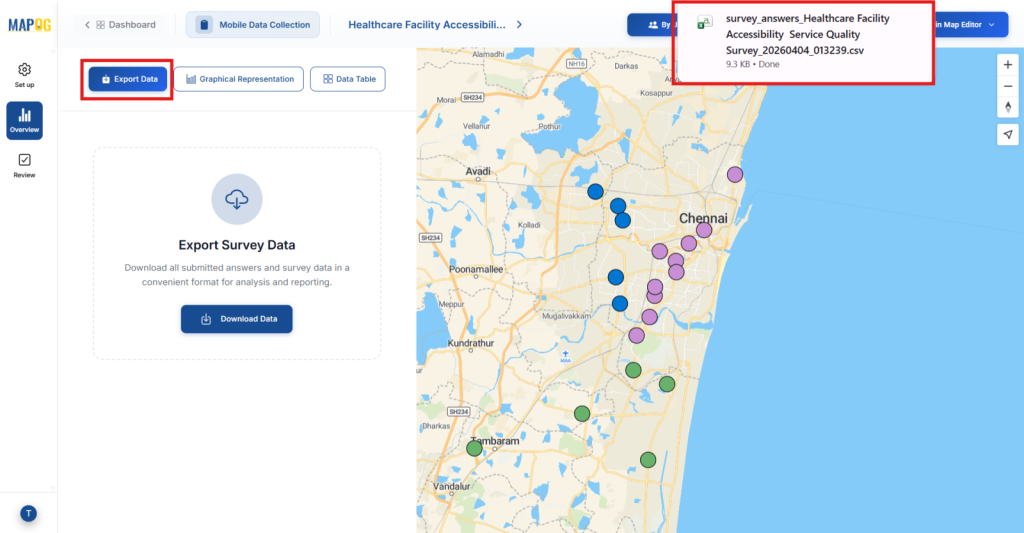
In addition , Go to the Export Data option to download all collected survey data as a CSV file.
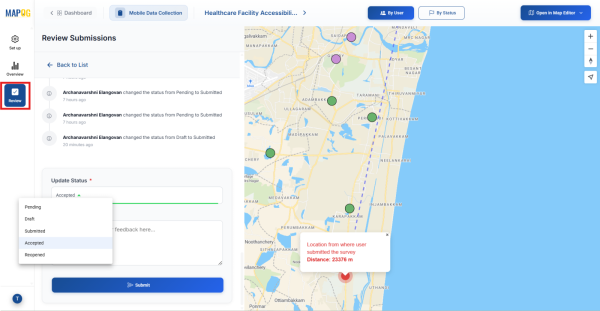
As project manager, review field updates, verify data accuracy, and mark status as Accepted.
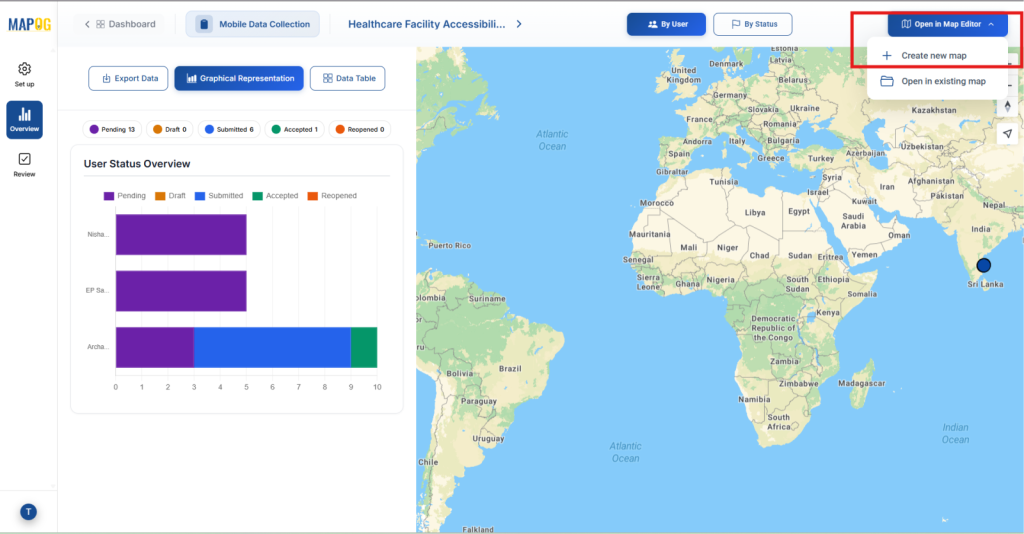
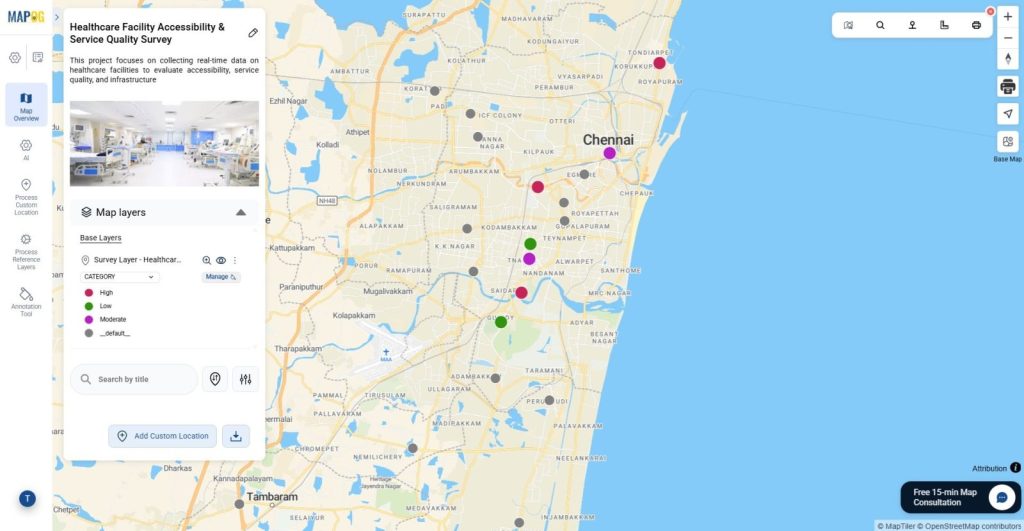
Similarly, to begin analysis, select Open in Map Editor to visualize the survey layer on a new or existing map.
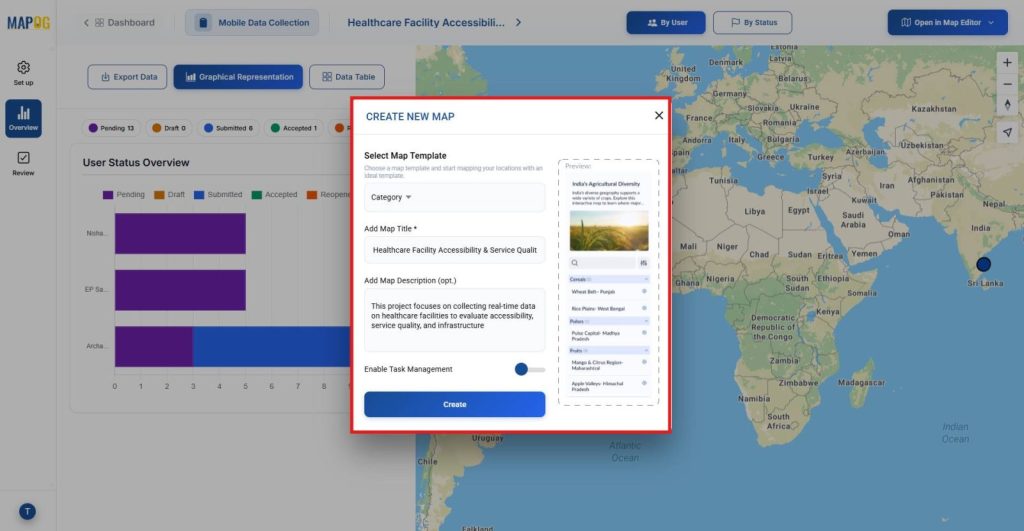
Choose to create a new map using the Category template, then add a suitable title and description to clearly define your map.
Go to Add Style Layer, choose Category, select an attribute (e.g., average wait time), apply colors, and save.
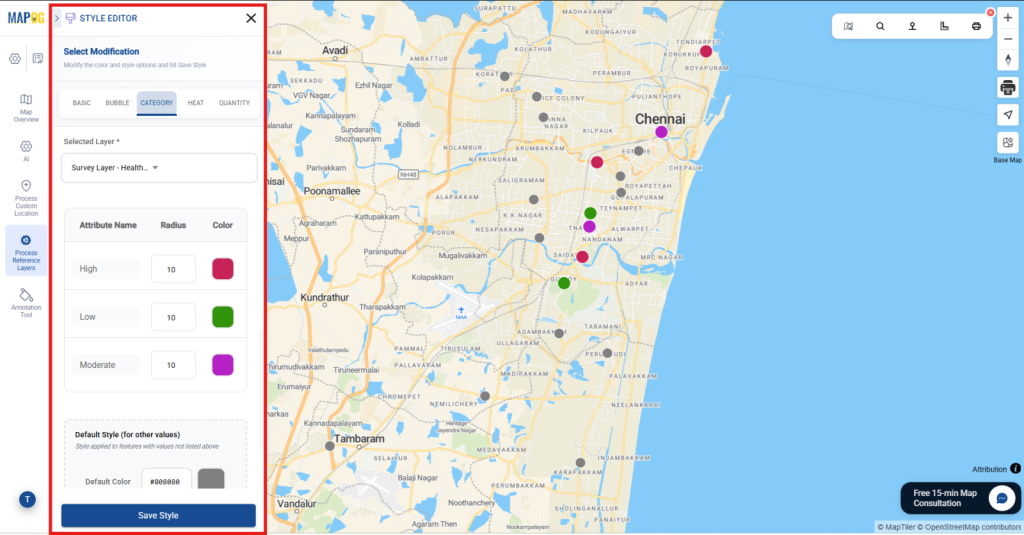
With this visual categorization, users can evaluate hospitals based on crowd levels for example:
- Green: Low
- Red: High
- Violet: Moderate
Industries and Domains Benefitting
Healthcare providers improve facility monitoring and service quality, while administrators optimize patient flow; additionally, planners assess healthcare coverage. Therefore, sectors can conduct hospital surveys and analyze locations to support better, data-driven decisions.
Conclusion
Furthermore, In a data-driven environment, clear visibility leads to better healthcare outcomes. Consequently ,MAPOG’s mobile data collection capability helps organizations capture Field Surveys and Store Data and map hospital data efficiently, enabling insights.
MAPOG Mobile App: Android (Play Store) and iOS (App Store)
Other blogs you might be interested in: