Camera installation service checks are often managed through spreadsheets, calls, and scattered messages, which leads to confusion about exact track installation locations, delayed updates, and poor visibility into task progress. As a result, technicians may miss follow-ups or revisit sites due to unclear information. However, by using map-based task management in the MAPOG platform, every camera installation site can be linked to a precise location on an interactive map. Consequently, this improves coordination, ensures accountability, and enables faster, more efficient service management in locations from a single platform.
Key Concepts for Track Installation Locations
Map-based task management focuses on connecting every task to a precise geographic location so it can be visualized directly on an interactive map. Additionally, structured workflows help track each task from creation to completion, maintaining clarity at every stage. Real-time updates from field teams further improve transparency, enable accurate completion verification. Ultimately, centralized data tracking and collaboration tools enhance coordination data-driven decision-making.
Steps to track installation locations
1. Create a new map
Open MAPOG Dashboard and click Create New Map. Select the template as category, provide a project title and a brief description, enable Task Management, and then click Save to create the project map.

2. Add coordinates using an Excel or CSV file
Go to Process Custom Location and then select “Add by uploading CSV/Excel”

Afterwards, go to the select custom location template settings option.

Create a new template by clicking on add more custom location template .

Create a new template, name it and select its geometry either point or polygon or line and then add different attributes like CCTV name , service area , owner department etc to match with your data and choose different attribute type whether text , multiselect or select.

Select the custom location template you created earlier from the dropdown. And upload your desired file.

Choose your unique id to select the attribute which you want points to be differentiate by.

Match the attributes with excel and field type to latitude and longitude then submit.

Your points will appear on the map .

Click on any point and click on pencil icon and choose edit custom location details.

Add images to each point , you can also add or edit details of the point from here .

To style the icons, click Add Layer Style,

Choose Category style and select the attribute which you want to style,

You can choose any attribute to style on its categories . Select an icon and colour, and save the style.

3. Group, Filter and Sort the points
Select Group by Attributes to categorise the points based on one particular attribute.

select the attribute you want to group & save changes.

filter the points by clicking filter icon. Select specific attribute & apply & it’ll appear on map.

sort locations by sorting out them either from location or live location .

4. Assigning Tasks
Click on any point and and click on Add Task.

write task name and its description and select a due date and deal value .

Select a task type or create a new one by clicking on Manage .

then click add more task type

Name the task type and save it

A task completion form opens automatically, where you can add required questions. You can also select different field types, such as question–answer, multi-select, and more.

Next, select the task status—Assigned, Open, or Cancelled—and set the priority from urgent to low.

Finally, add members through Add New Team Member, enter their email, and assign appropriate roles such as Admin or others.

Assign task to members by clicking on assign team members and then save task.

5. Task Execution and Completion
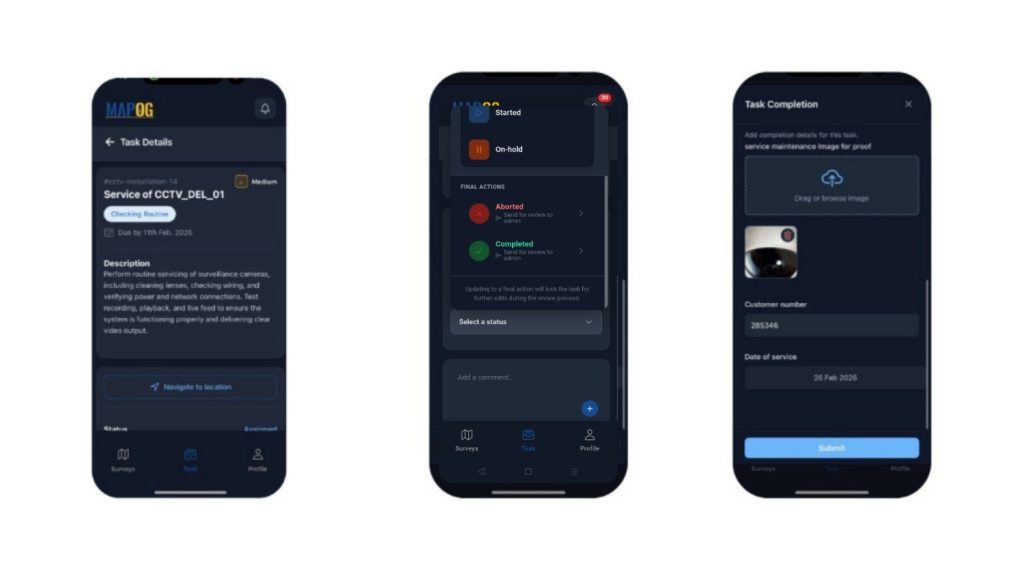
After task builder you can do survey by using the MAPOG Contributor App, you can view tasks which are assigned to you , update stages, add comments, upload images, and mark tasks complete by submitting the Form.
Finally go to Task Management to monitor the progress using filters.

6. Preview and share
To share your map, click Preview and Share. This allows teams, managers, or stakeholders to explore the data interactively without needing access to raw files. Moreover, you can share links of the map , or share embed map, also add user so you can work together and make maps collaboration far more effective.

Industry Benefits:
- Improves operational efficiency and field team coordination
- Enables quick filtering and sorting of locations for better analysis
- Reduces reporting delays and data duplication

Conclusion:
Tracking and managing field installations through structured, map-based systems significantly improves visibility and accountability. Moreover, by organizing location data with smart grouping and filtering, teams can monitor progress in real time. As a result, manual errors decrease and scattered records are eliminated. Ultimately, this enables faster, data-driven operational decisions.