In solar infrastructure projects, inaccurate site observations and delayed updates often slow down execution, leading to redesign and cost overruns. Traditionally, teams rely on manual notes, scattered spreadsheets, or calls, which reduces accuracy and visibility.
To address this, companies are now conduct solar site surveys using mobile data collection and digital mapping workflows. This approach allows real-time capture of rooftop conditions, shading levels, land locations , and installation feasibility. Transforming fragmented inputs into a structured and review-ready system platforms like MAPOG can be used.
Key Concept: Digital Mapping for Solar Site Assessment
Before you conduct solar site surveys, organize site data in an Excel or CSV file. Typically, this includes attributes such as Site id , address , building type etc all can be visualized.
Additionally, include accurate coordinates and assign a Unique ID to each location. As a result, data remains consistent and can be auto-plotted on maps.
Step-by-Step Guide to Conduct Solar Site Surveys
Step 1: Create a Solar Site Survey Project
To begin with, store all site data in an Excel sheet. This file becomes the base for managing surveys without duplication.

Next, log into MAPOG and open the Survey dashboard.

Then, under Mobile Data Collection, click on Create New.

Afterward, define details such as title, description, duration, project type and frequency whether it’s one time or weekly etc.

Then, create a custom location type named “Solar Site Assessment”, by clicking create new in location type to add attributes to your map.

and then choose point geometry, and assign a color. Add attributes like address and building type using select or multiselect formats. Importantly, enable contributor access so field teams can update data directly. Finally save.

Now add the template from the list and select it , Now allow settings for adding locations & edit them, then save and continue.

Step 2: Add Structured Questions
Now, move to the Add Question section.

Here, clicking on add question, include questions like “Installation Site Type” or “Shading Condition” using formats such as text, select, multiselect, and image upload. These questions will be used during survey by the team members for technical data and proof identity of the sites .

Furthermore, predefined options can be added for select fields just click on the select in answer type and then write the options by clicking on manage options when done click save. As a result, field teams can submit both technical details and visual proof, improving data accuracy. When done with the question form click next .

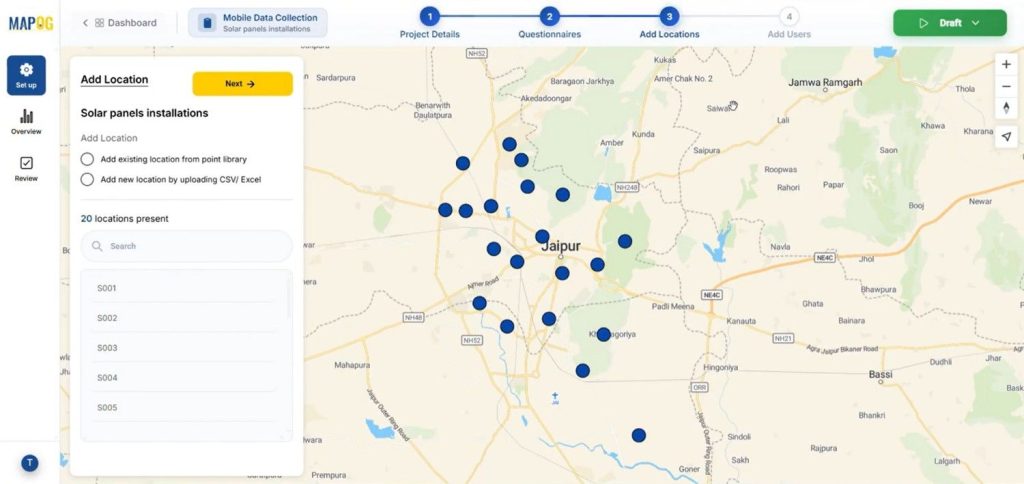
Step 3: Upload Survey Locations
Subsequently, browse & upload your prepared Excel or CSV file using the Add New Location by Uploading CSV/Excel option.

During upload, ensure each point has a Unique ID to avoid duplication.

Then, match columns with attributes and assign coordinates correctly.

Once uploaded, locations will automatically appear on the map, enabling quick visualization.
Step 4: Assign Teams and Areas
Next, go to the Add User section.
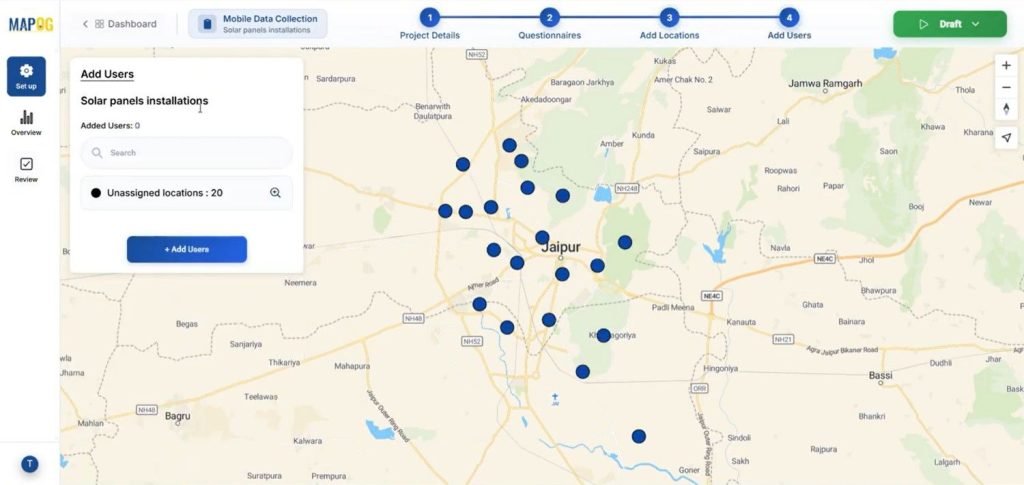
and then click add member and add new user, write the email address and select their role whether admin or other.

Now select the members from the dropdown and add them by clicking invite.

After that, assign locations to users. Using the map option, draw boundaries to allocate survey zones to specific engineers.

Additionally, apply color coding for clarity.

Click on the filter option to assign unassigned points & filter points according to the attributes, whether assigned or unassigned this helps to find data when there are large data sets.

Step 5: Launch and Monitor Surveys
Once setup is complete, Go to the draft section and click Start Survey.

Field teams will receive assigned locations in the MAPOG Contributor App, where they can add new locations for the survey, by searching locations they can confirm sites and add details of the sites.

After saving, survey form will open and now they can provide all gathered details like roof area , sunlight exposure etc, upload site images, and then submit or save drafts .

Meanwhile, managers can track statuses like submitted, pending, or draft from the overview dashboard. Use filter option to filter out the points either by status or whom it answered by.

In addition, admins can review submissions in review section.

You can check status pending , draft submitted or you can reopen the task again and also add comments, and finalize records.

Data can also be exported as CSV for further analysis.

You can also add the survey data to a new map or existing map by clicking open map editor .

Industry Applications & Benefits
In solar projects, poor coordination often leads to delays and inefficiencies. However, digital solar site surveys improve accuracy and planning.
For example, teams can assess shading, rooftop conditions, and orientation before installation, reducing risks. Similarly, developers can evaluate multiple sites simultaneously, improving decision-making.
Furthermore, centralized dashboards and real-time updates enhance collaboration and ensure faster project execution.

Conclusion
Modern solar projects require efficient and accurate survey methods. By using mobile data collection and digital mapping, companies can improve visibility, reduce delays, and streamline workflows.
Ultimately, MAPOG tools enable seamless coordination from site assessment to approval, making solar installation planning more efficient and scalable.
Check out MAPOG contributor app, Here’s the links below
Exploring Our Previous Blogs
- GIS in Infrastructure Development and Road Network Analysis
- Role of GIS In Irrigation Planning and Water Resource Management
- How GIS and Smart Mapping Reduce Urban Heat Islands