Real estate brokers often struggle to Manage Scattered Property Listings spread across multiple neighborhoods. As portfolios grow, spreadsheets become fragmented, updates are frequently missed, and tracking individual property status becomes confusing. To solve this, brokers can utilize MAPOG to convert static data into a centralized, visual map.
Key concept: Manage Scattered Property Listings Through a Centralized Map
The core concept is to Manage Scattered Property Listings through an interactive interface. By categorizing properties such as “available,” “sold,” or “under construction”, with distinct markers, teams can instantly identify status. This eliminates the reliance on cumbersome spreadsheets.
Step-by-Step Workflow: Manage Scattered Property Listings
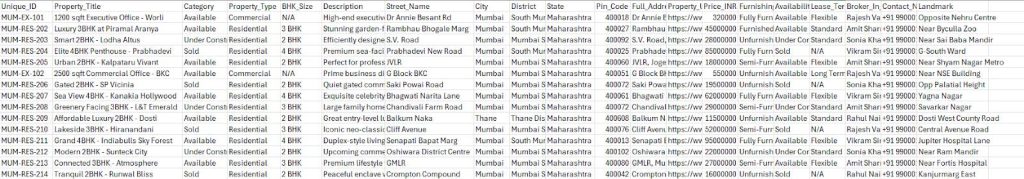
To begin, prepare an Excel sheet with property data, separating addresses into columns like Street, District, and Zip Code for accurate mapping.
1. Setting Up the Map
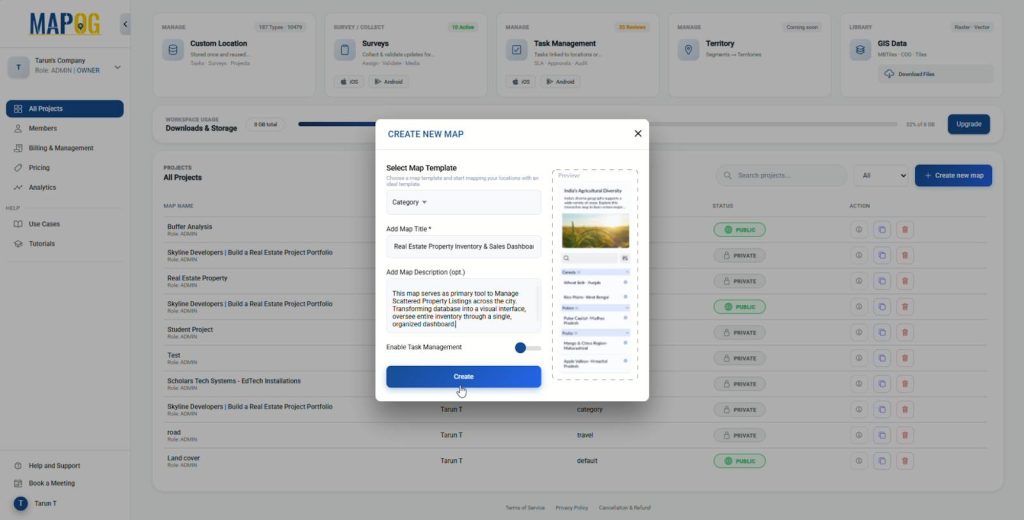
Then, Head to MAPOG to initiate map creation. From the dashboard, click Create New Map, select Category from the template dropdown, enter a title, and click Create.
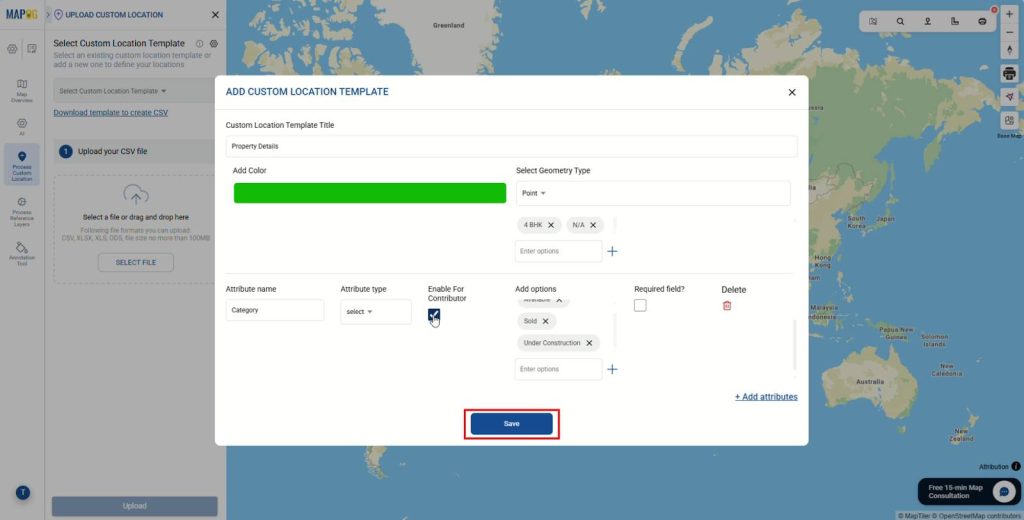
2. Create a Custom Location Template
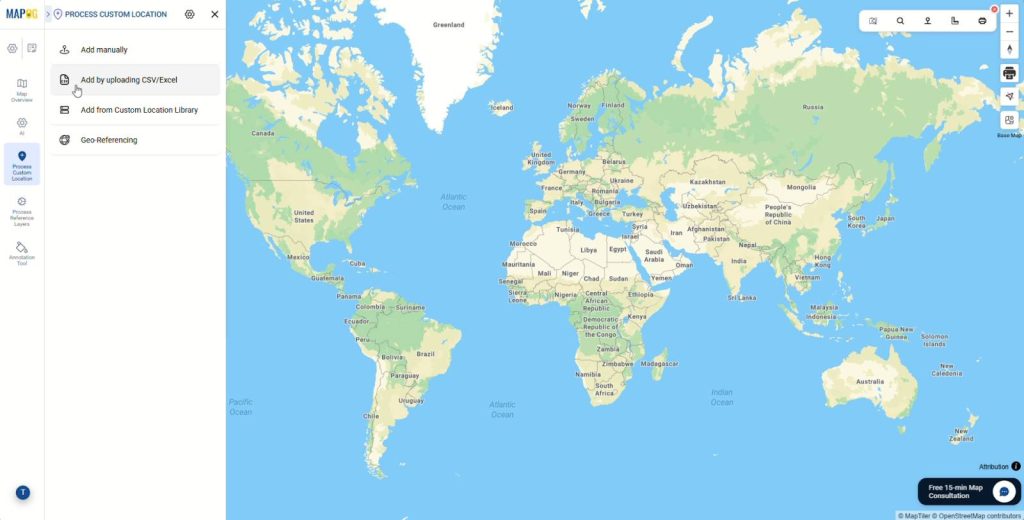
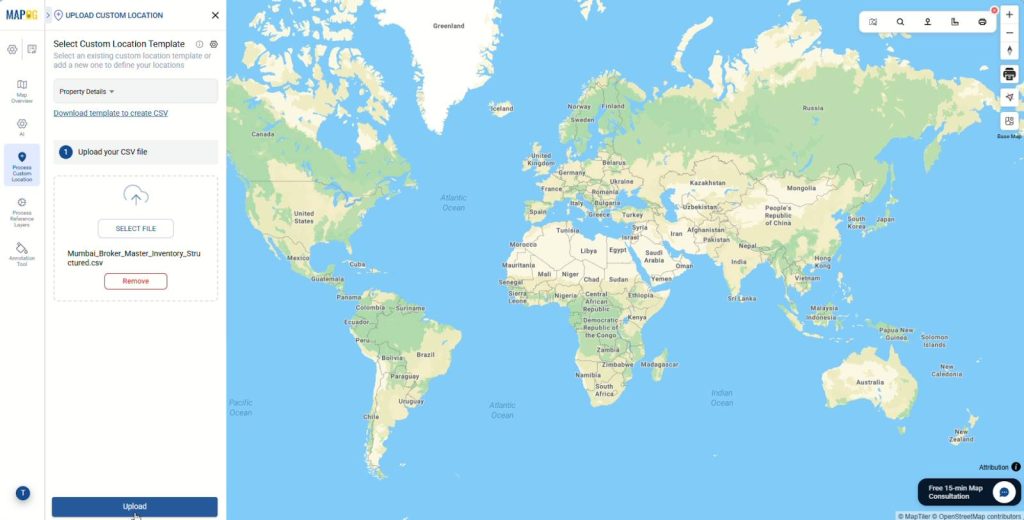
After that, click on the Process Custom Location in the left sidebar and select Add by uploading CSV/Excel.
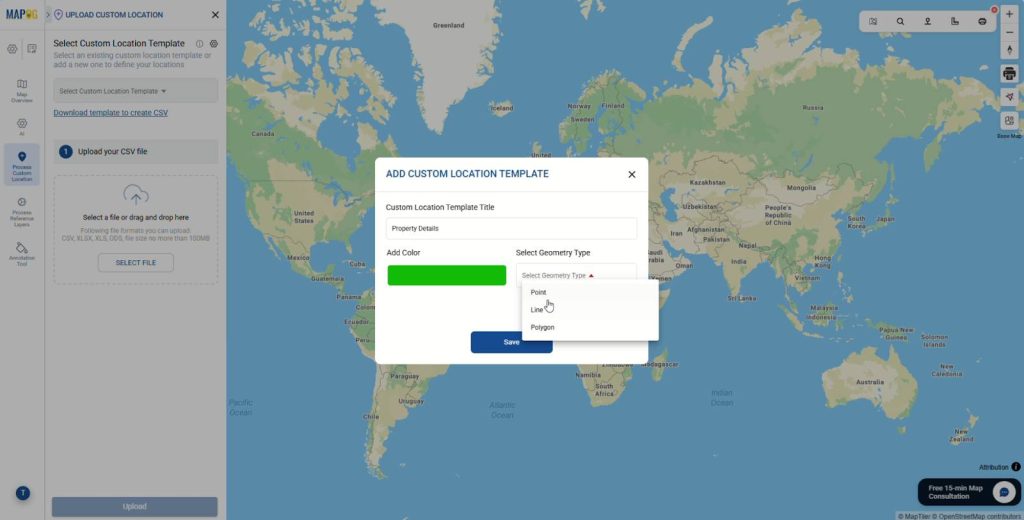
Next, open Custom Location Template Settings and click on Add more custom location template to add a new template. Choose a color and select Point as the geometry type and create a reusable template.
Next, click Add Attributes to create custom data fields that define what information appears on the map. Select attribute types such as Text, Select, Number, or Website URL. For example, you might add Property Name (Text) or Price (Number). Enable for Contributor so staff can update details on-site, then click Save.
Next, return to the upload menu and choose your new template and upload your prepared Excel or CSV file.
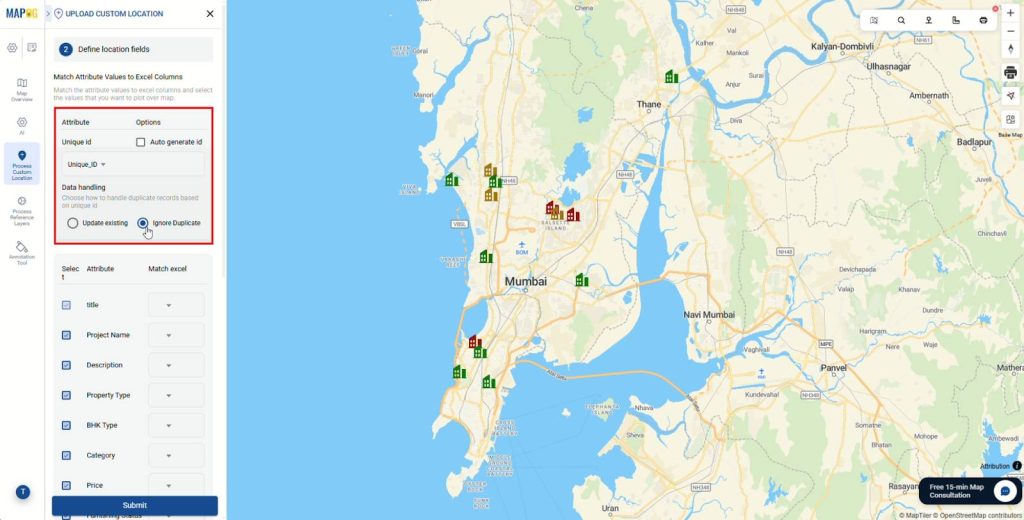
Next, select a Unique ID column to help the system identify each location record and prevent duplicates when updating or importing data again. If your file does not include unique IDs, you can toggle Auto Generate ID to create them automatically.
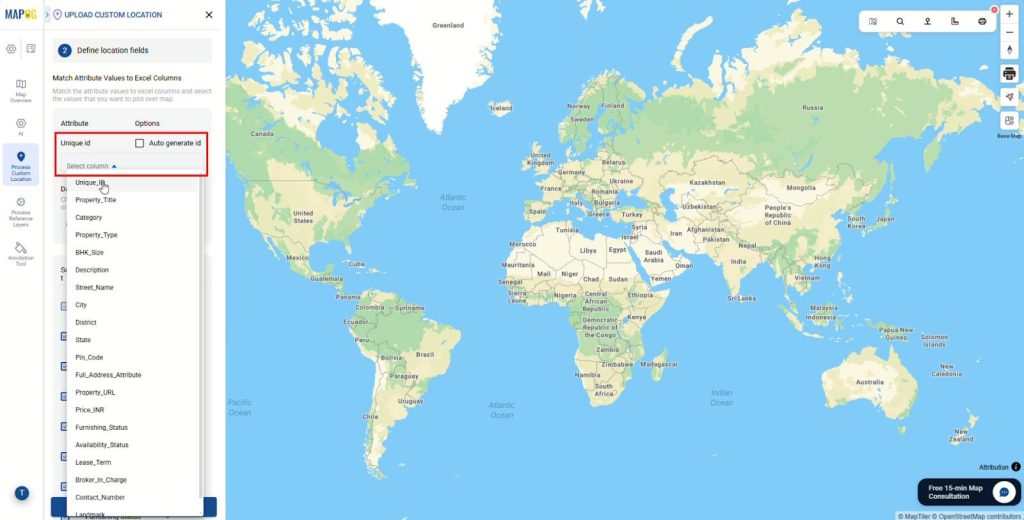
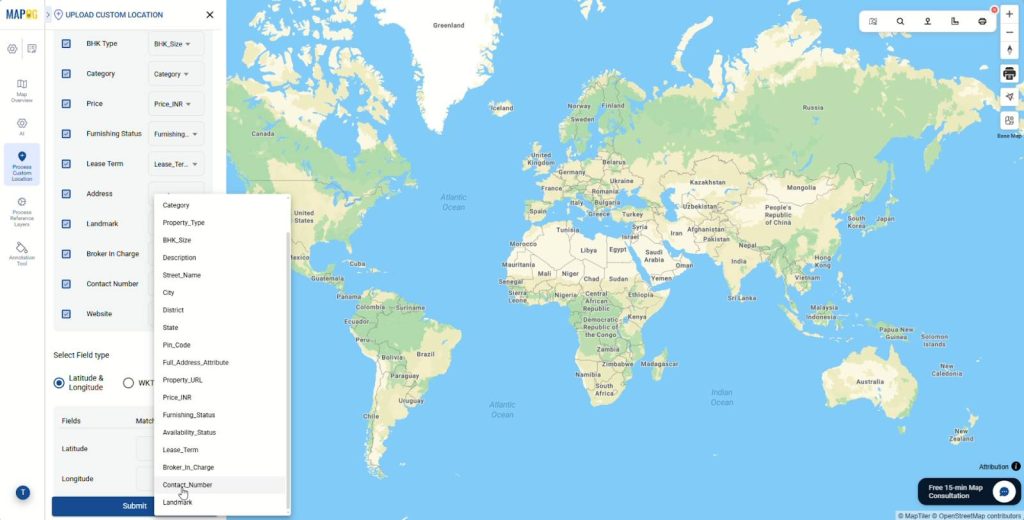
Then, match your Excel columns to the attributes.
3. Geocoding & Address Configuration
Then, select Geocoding to translate addresses.
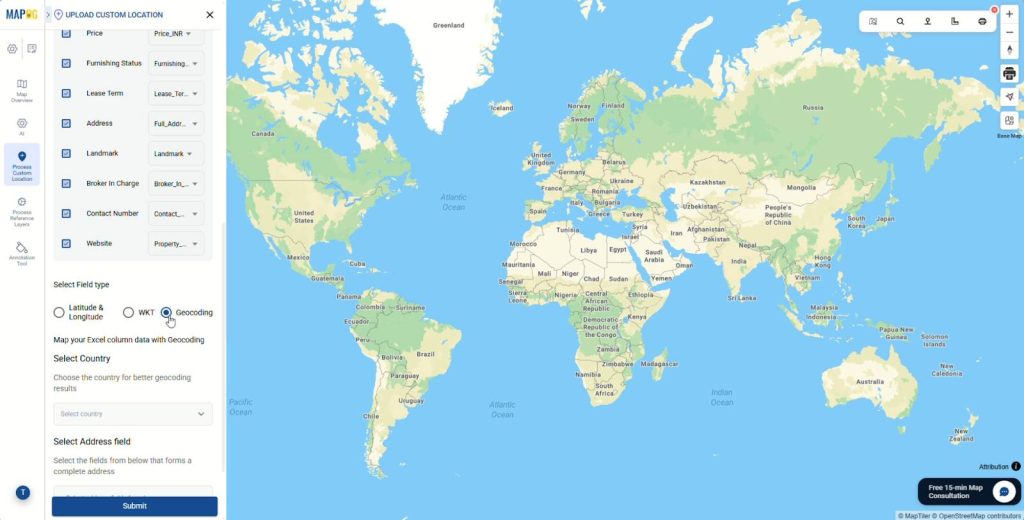
First, select the correct Country to ensure regional accuracy.
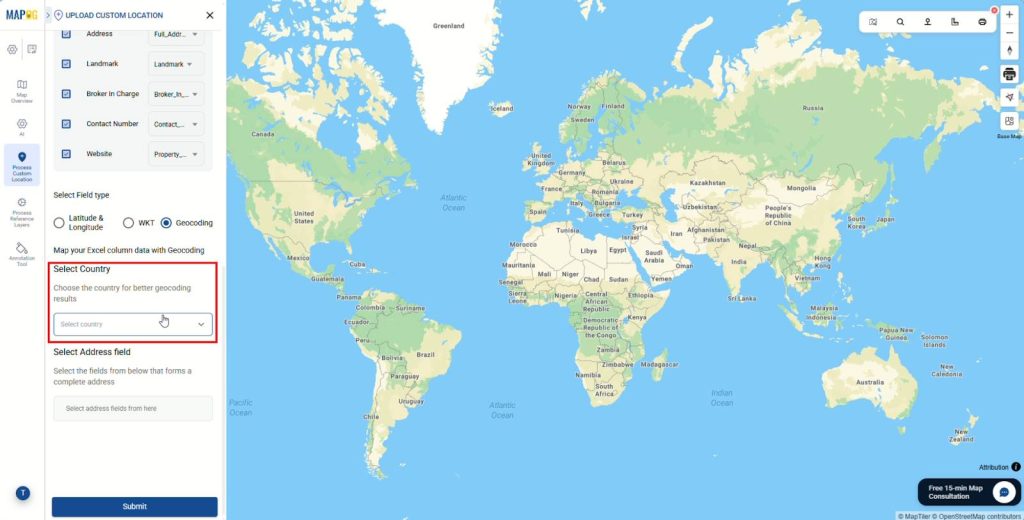
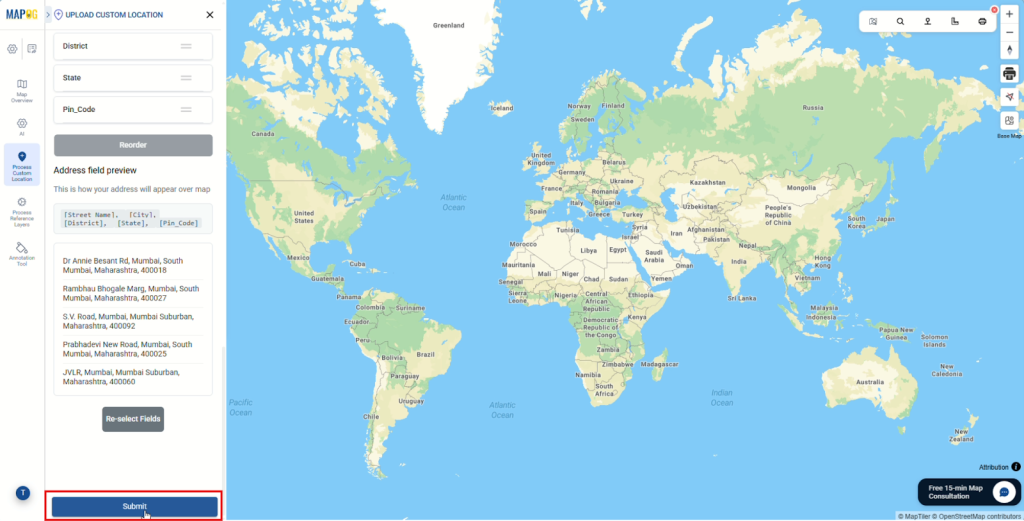
Then, map address fields like Street, City & others, dragging them into the correct order. Once verified, click Save.
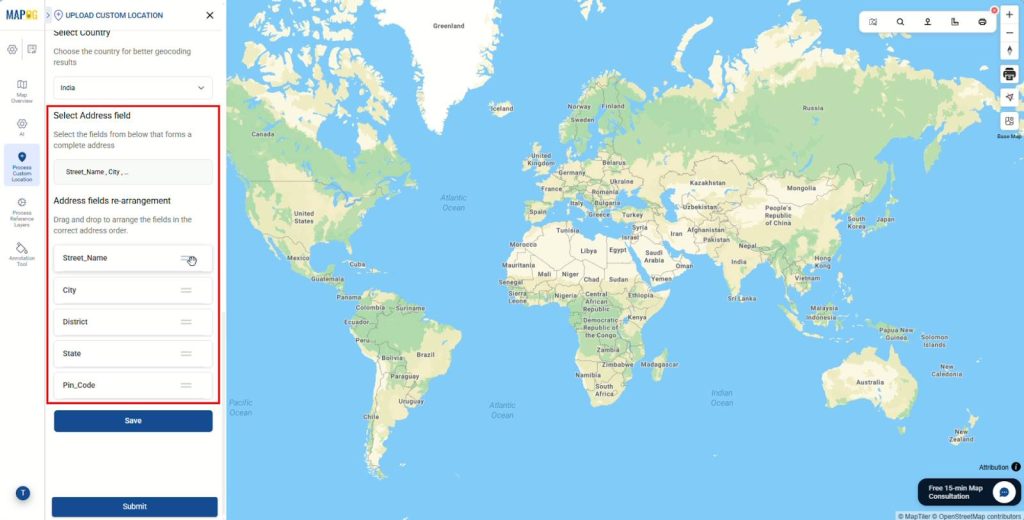
If needed, you can click Re-select Fields to redo the mapping. Finally, click Submit. The system will now place all property markers on the map.
4. Styling and Visualization
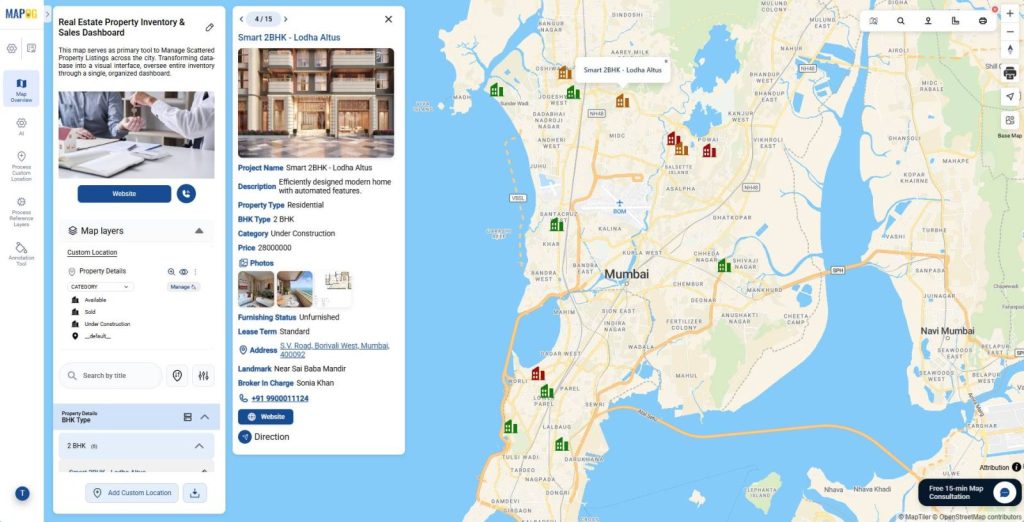
Next, open Edit Custom Location Details to add images.
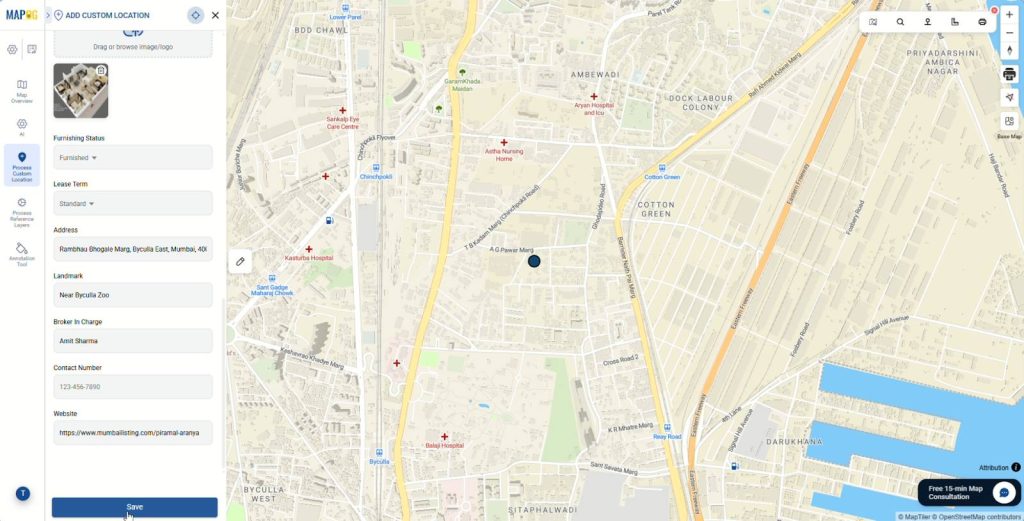
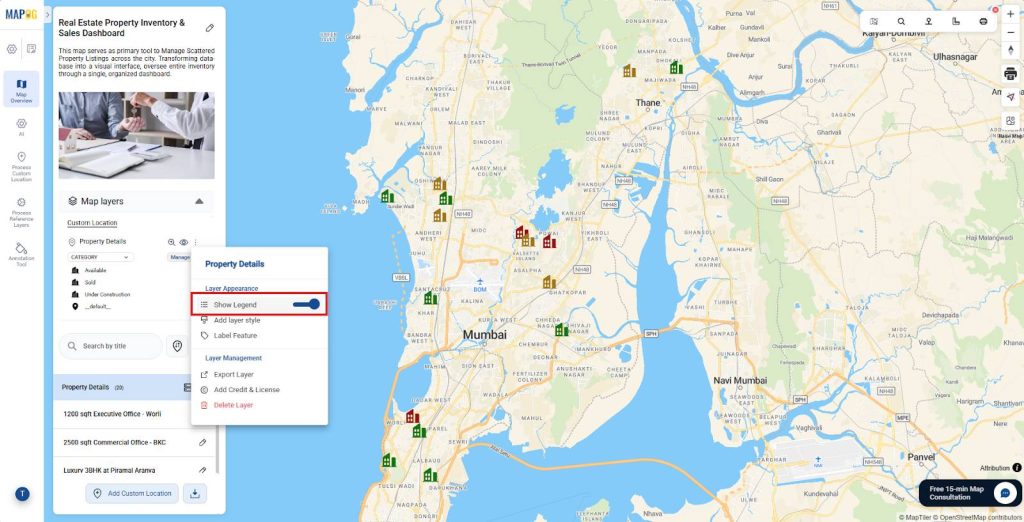
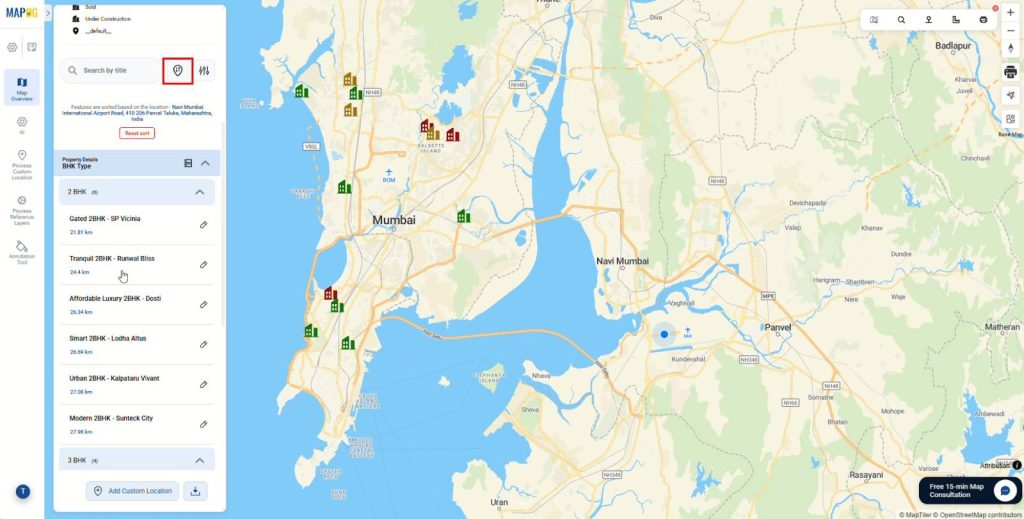
Then, click the three dots by the layer and select Add Layer Style. In the Category tab choose the attribute field you want to use for categorization. After that, go to basic icons and assign distinct colors and icons so brokers can identify status at a glance. For example:
- Green: Available
- Red: Sold
- Orange: Under Construction
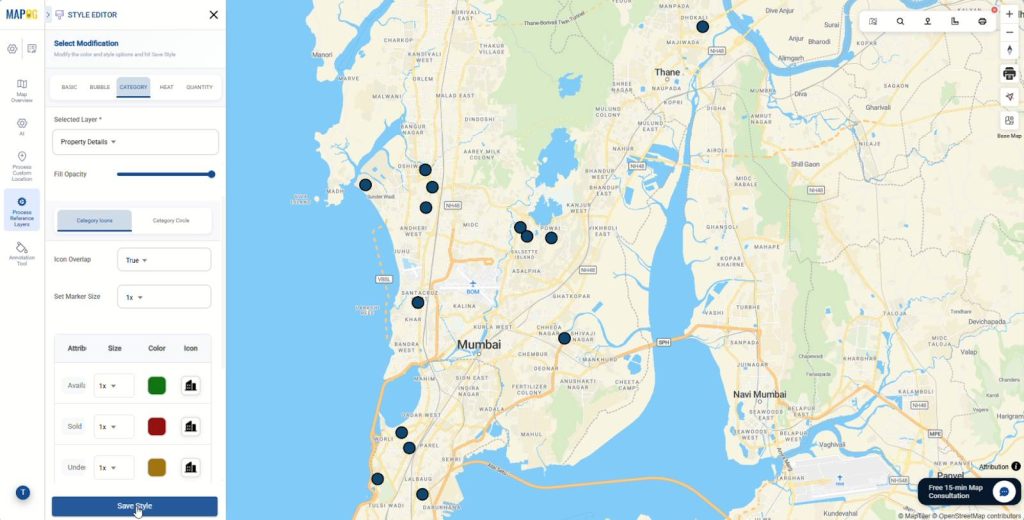
Finally, turn on the Show Legend toggle to add a visual key.
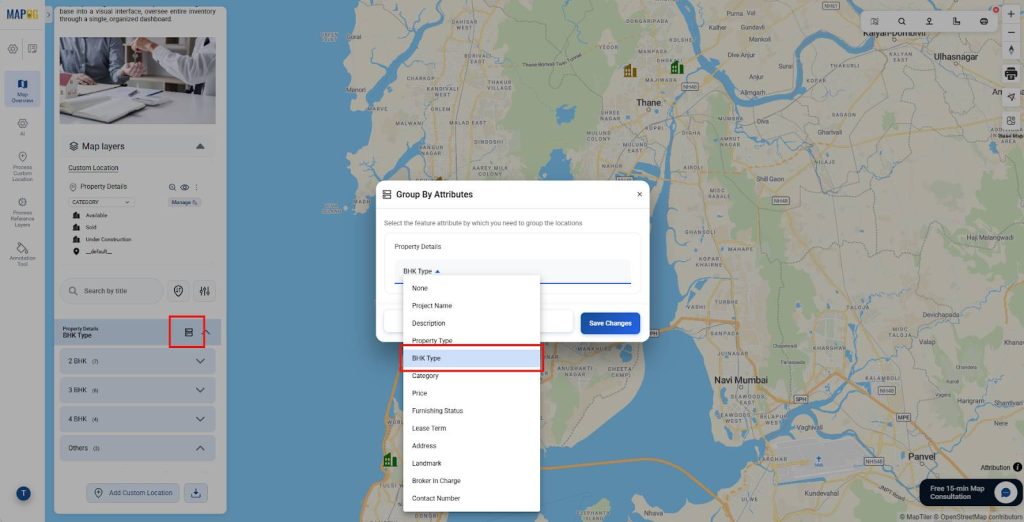
5. Group by Attribute, Filtering and Sorting
Next, click the Group by icon and select an attribute like “BHK Type” to automatically group property locations.
Then use the Filter icon to refine results. For example, you can filter listings by property type or price range using the slider. After you click Apply, the map immediately updates to display matching properties.
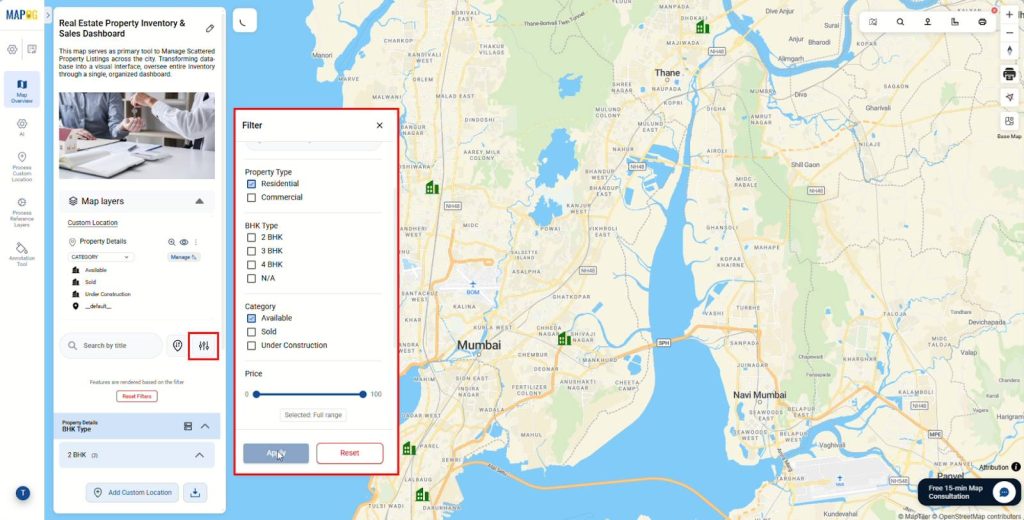
Additionally, click the Sort icon to organize listings by distance from a specific landmark or live location. As a result, the system calculates the distance between each property and your chosen point.
6. Adding More Data
As your business grows, you will likely add more listings. First, return to Add by Uploading CSV/Excel and select the same Property Details template. Then upload your updated Excel or CSV file.
Next, choose the Unique ID column again to maintain a clean database. After that, select a Data Handling option:
- Update Existing: refresh and update existing location points.
- Ignore Duplicate: skip listings already on the map.
Complete the attribute mapping and click Submit to update the map with the new inventory.
7. Call to Action
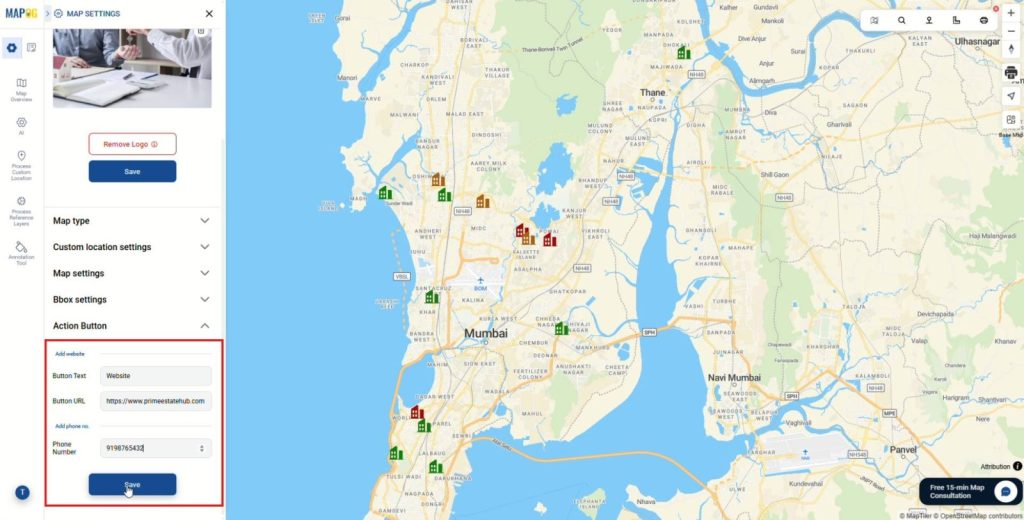
Open Map Settings and configure the Action Button to add a website and contact number, so users can instantly take action instead of just viewing the map.
8. Share and Publish
Finally, open Share & Publish to control who can view the map.
First, set the map to Private for internal team use or switch it to Public to make it accessible via link.
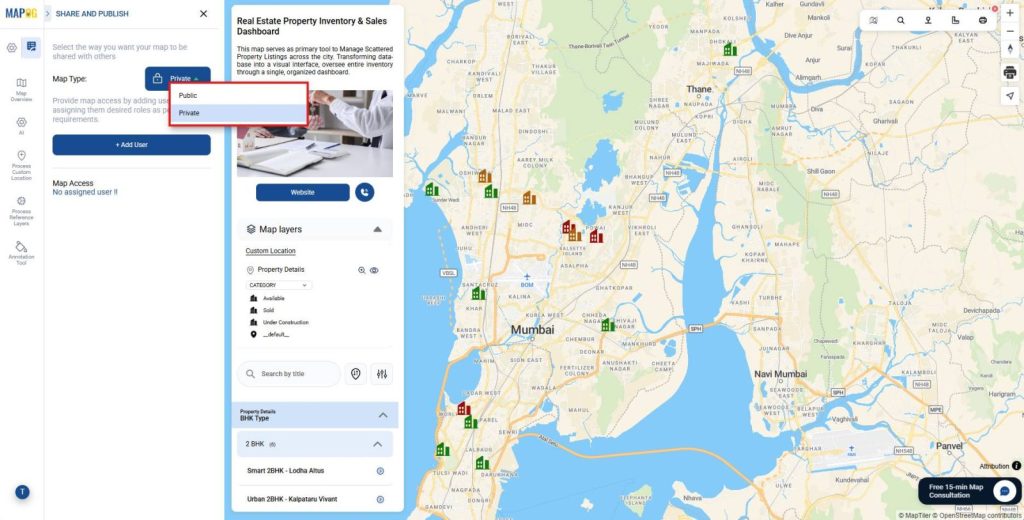
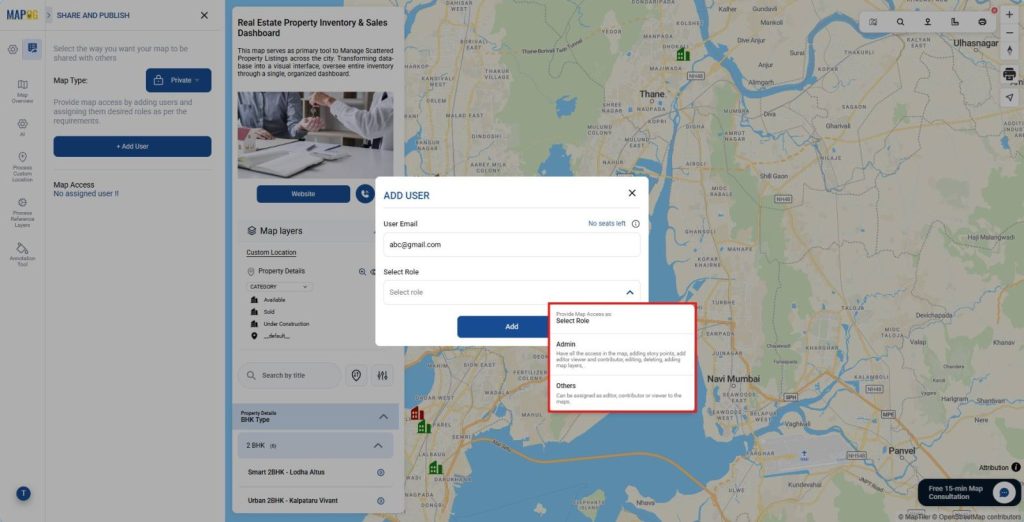
In Private mode, you can Add Users and assign roles; Admin for full control, while Others can be added as Editor, Contributor, or Viewer.
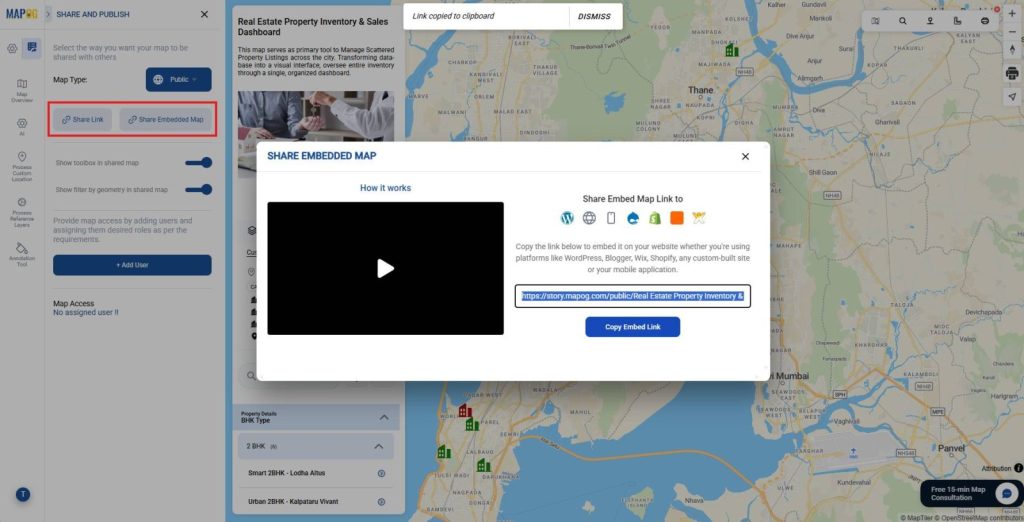
Alternatively, in Public mode, you can generate a Share Link or Embed the Map on your website for wider visibility.
Benefitting Industries and Domains
Several sectors benefit from this mapping transition:
- Real Estate Developers: Track project phases from ground-breaking to move-in ready.
- Brokerages: Organize territories by agent to ensure optimal coverage.
- Property Management: Monitor maintenance tasks across diverse rental units.
Conclusion
Ultimately, a visual system allows brokers to Manage Scattered Property Listings with greater efficiency. By filtering listings and tracking statuses on a single map, teams gain insights and make faster decisions using a centralized mapping system like MAPOG.