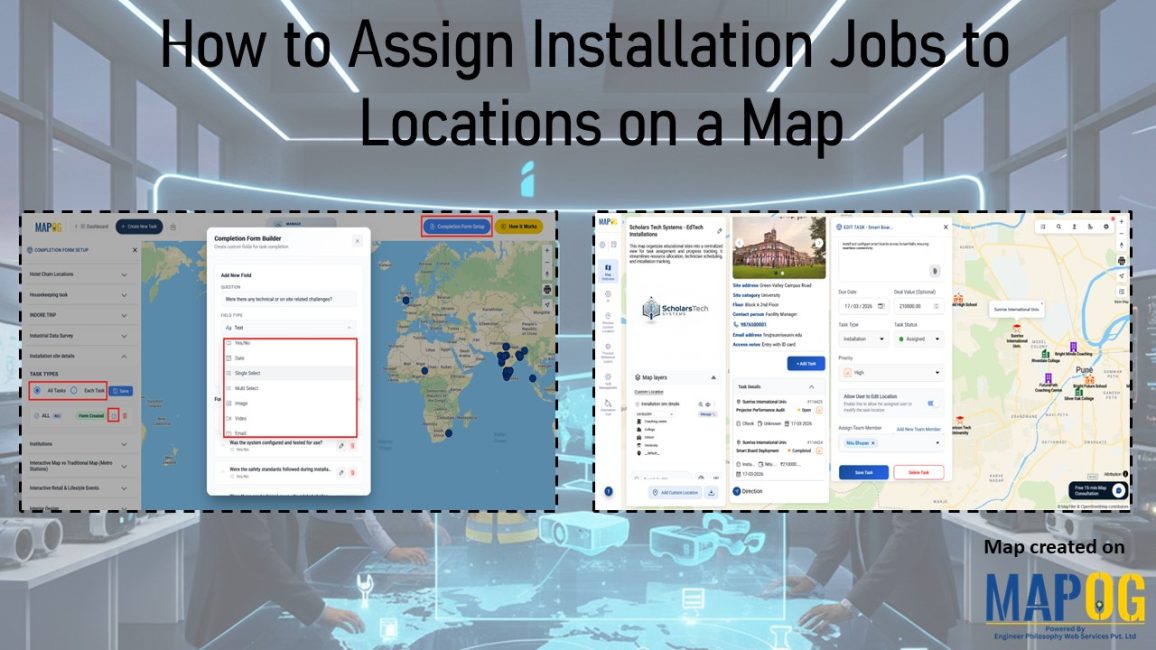
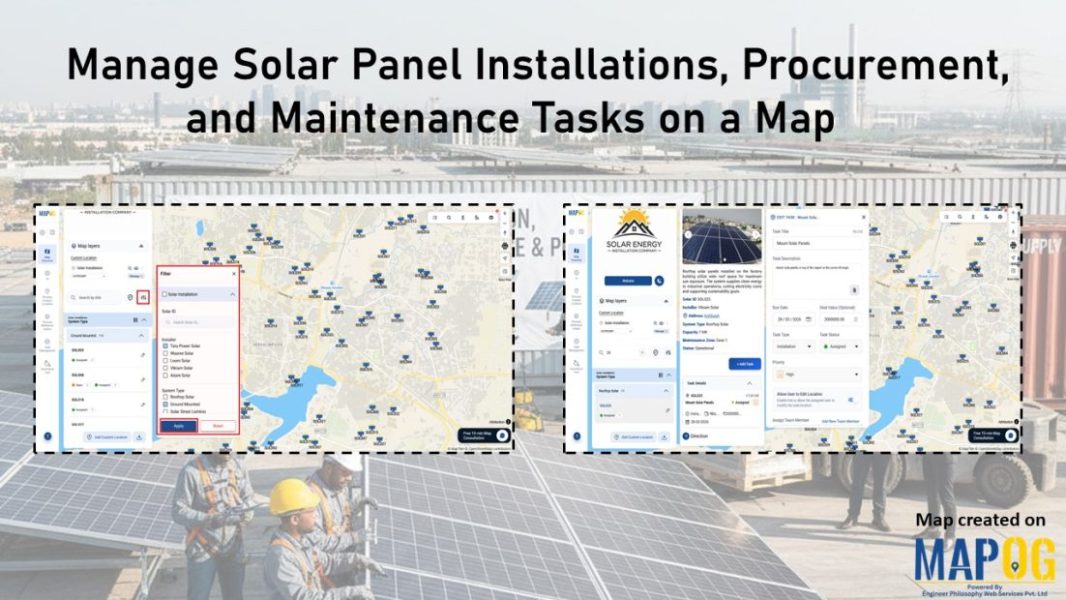
Interactive Mapping

How to Map and Monitor Franchise Locations

How to Map and Monitor Franchise Locations in One View

Map and Monitor Franchise Locations, scattered records hinder outlet tracking. MAPOG centralizes data into interactive maps, enhancing location visibility, monitoring, regional insights, and faster, spatially informed decision-making. Key Concept: Map and Monitor Franchise Locations Franchise location maps help track store locations, monitor performance, manage site visits, coordinate teams, compare regional results, and support reporting. This improves … Read more

Visualize Property Assets Using 3D Building Mapping

Visualize Property Assets Using 3D Building Mapping

Traditional spreadsheets and flat property listings hide high-value real estate assets to flat rows of data, critical spatial context making it hard to understand location impact, building scale, and asset relationships slowing decisions and increasing guesswork. MAPOG changes this by transforming real estate data into interactive 3D building maps, allowing teams to Visualize Property Assets … Read more

Cover image of map based task management map

Map-Based Task Management: Assign, Track & Update Task

Across industries, managing field tasks through spreadsheets, calls, or scattered messages often leads to coordination issues. Maintenance services, construction, logistics, utilities, and property management teams struggle with unclear task locations, delayed updates, and limited visibility across multiple sites. As a result, without geographic context, tracking progress and coordinating operations becomes inefficient. MAPOG’s  map-based task management … Read more

Shows features like geo-referencing layout image and adding attribute details for creating an interactive campus map for real estate projects.

Create an Interactive Campus Map for Real Estate Projects

Modern real estate developments such as campuses, townships, and estates involve many buildings and amenities. However, they are still shown through static layouts or spreadsheets, which fragment information and hinder navigation. Therefore, MAPOG resolves these challenges by enabling an interactive campus map for real estate projects that combines geo-referenced layouts, structured attributes, indicators, and filters. … Read more

Shows comparison of different map styling options: including heatmap, category, bubble and quantity

Understand Different Styling Options on a Map: Heat Map, Category, Bubble & More

At first glance, raw data on a map often looks like scattered points with little meaning. Although the information is there, the story remains hidden. As a result, patterns are difficult to spot, categories blur together, and intensity feels impossible to judge. That’s why it matters to understand different styling options on a map . … Read more

Map interface showing cycling route across the UK with breakpoints, photos, and text annotations.

How to Map Your Complete Cycling Journey with Breakpoints, Photos & Route Lines

Many cyclists struggle to preserve their journeys because GPS tracks, photos, and notes often end up scattered across different apps; as a result, breakpoints lose context, memories fade, and sharing becomes fragmented. However, when you map your complete cycling journey with MAPOG, everything comes together, routes, breakpoints, photos, and reflections; into one interactive storytelling map … Read more

Dashboard view demonstrating how to Filter Only the Locations That Need Action within a 5 km radius on a map using proximity and status-based filters.

How to Filter Only the Locations That Need Action Within a 5 km Radius

Managing multiple locations efficiently becomes challenging when you need to identify which sites require immediate attention. MAPOG‘s dynamic filtering system helps businesses streamline operations by pinpointing critical locations within specific geographic boundaries. Learning how to filter only the locations that need action within a 5 km radius transforms scattered data into actionable insights. Key Concept: … Read more

Centralized Map View

Centralized Map View for All Your Hotel Locations

In today’s increasingly competitive hospitality landscape, both travelers and hotel owners face a common challenge: understanding location clearly and quickly. Travellers often struggle to compare hotels across cities or regions. At the same time, hotel owners and managers find it difficult to oversee expanding portfolios using static address lists and reports. As properties spread across … Read more

Customers are pending field visits

Check Which Customers Are Still Pending for Field Visit

Check which customers are pending field visits with GIS mapping is an important step that allows your team to instantly identify who has been visited, who is still pending, and where follow-ups are falling behind. As a result, businesses can uncover patterns, understand field-team performance, and plan their sales operations more efficiently.  Whether you manage … Read more

Share Interactive Maps with teams

How to Share Interactive Maps with Teams or Clients Securely

In today’s collaborative and data-driven environment, sharing location intelligence securely is just as important as creating it. Static screenshots or exported files often fall short—they lose context, interactivity, and control. That’s where secure Interactive map sharing becomes essential. By enabling teams and clients to explore live maps with controlled access, you ensure everyone sees the … Read more