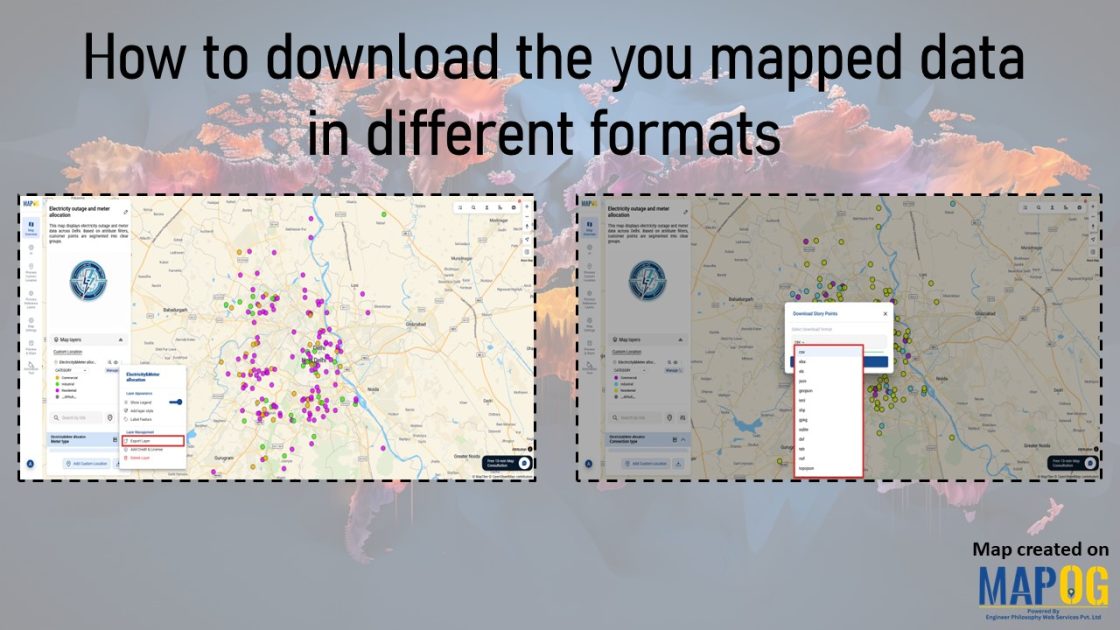
shapefile

How to Draw 3D Buildings

How to Draw 3D Buildings on a Live or Dynamic Map

In the world of digital mapping, the concept of 3D mapping has changed how we visualize spaces. MAPOG is a mapping tool which allows users to draw realistic 3D buildings with ease, specifically for urban planning, real estate visualization, or educational use. Key Concepts of 3D Buildings You Should Know Drawing 3D buildings on a … Read more

5 Inspiring Examples of Interactive Dynamic Maps You Can Create Online

Interactive and dynamic maps not only transform data into actionable visuals but also let users explore, interpret, and share insights. With MAPOG, you can not only map portfolios, campuses, routes, or stores but also organize, analyze, and visualize trends; moreover, this enables clearer, faster, and connected decisions. Key Concept: Why Create Interactive Dynamic Maps? Interactive … Read more

Uploading shapefiles

How to Import Shapefiles into an Online Mapping Tool

Shapefiles are a popular format for storing geographic data, often used in GIS to define boundaries, and spatial attributes. However, How to Import Shapefiles into an Online Mapping Tool can be complex and difficult to interpret for non-technical audiences or in decision-making processes. Importing shapefiles into MAPOG  transforms static data into interactive, shareable maps that … Read more

Measure Distance & Area on a Map (Free Online Tool)

Measure Distance & Area on a Map (Free Online Tool)

Measuring distance and area is a fundamental tool with a wide range of applications like calculating land parcels, determining the lengths of roads and rivers. Leveraging MAPOG one can measure distance and area enabling to analyze and manage geospatial data for more informed and efficient decision making. Key concept and importance The key concept of … Read more

GIS in land use and zoning analysis for better city planning

GIS in Land use and Zoning analysis for better city planning

In today’s fast-changing urban landscape, GIS in land use and zoning analysis for better city planning plays a vital role in shaping smarter, more livable cities. Whether it’s managing population growth, conserving green spaces, or optimizing infrastructure, city planners increasingly depend on GIS to make informed decisions. This article explores how GIS tools enhance zoning … Read more

Flood Risk Mapping with Interactive Web Maps: A SaaS Platform Approach

Flood Risk Mapping with Interactive Web Maps: SaaS Approach

A SaaS-based flood risk mapping platform leverages interactive web maps to provide risk assessments. Using GIS, AI, and hydrological data, it enables governments, insurers, and communities to visualize flood-prone areas, enhance preparedness, and optimize response strategies. Cloud-based accessibility ensures scalability, data integration, and seamless user collaboration for proactive risk management. Key Concept How Flood Risk … Read more

Role of GIS In Irrigation Planning and Water Resource Management

Role of GIS In Irrigation Planning and Water Resource Management

GIS plays a vital role in irrigation planning and water resource management by optimising site selection, assessing water demand, designing irrigation networks, and analysing crop suitability. Additionally, it enhances decision-making through spatial analysis, monitors water distribution, prevents water logging, and integrates data for sustainable and efficient water resource utilisation. Key Concept in Monitoring GIS in … Read more

Adding More Attributes to a Shapefile – Create new map and share

Welcome to MAPOG! Today, we’re thrilled to guide you through the process of enriching your shapefiles by adding additional attributes using our Map Analysis Tool. By following a few simple steps, you’ll be able to enhance the depth and detail of your mapping projects, unlocking new insights and possibilities. Whether you’re in urban planning, environmental … Read more