In the realm of data visualization, maps serve as powerful tools for understanding geographic trends and patterns. “Mapping Population Data: Analyzing through bubble styling ” Through this article, we will delve into the intricacies of bubble style mapping and its applications in analyzing population data. From urban planning initiatives to market research endeavours and public health campaigns, bubble style mapping offers invaluable insights for a multitude of industries.
Key Concept for Creating a Dynamic Bubble Map
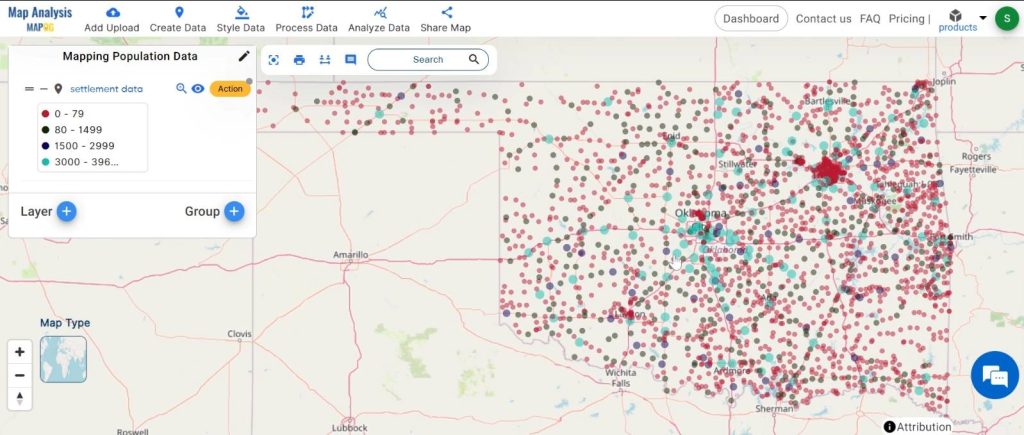
Bubble style mapping presents a dynamic method for visually representing population data, transforming numerical figures into vibrant visualizations using bubbles of varying sizes and colors. The datasets will be provided for practical application. Additionally, articles like “Creating Travel Guides: Mapping with GIS Buffer Zones” and “Creating GIS Solutions for Urban Agriculture Map” offer deeper insights into GIS applications.
MAPOG Map Analysis, a simple tool designed to simplify the creation and interpretation of travel maps.
Bubble style mapping transforms complex numerical data into intuitive visualizations. Here’s a step-by-step guide to tapping into the potential of bubble style mapping:
Step 1: Data Preparation
Begin by gathering your dataset containing numerical values that you wish to visualize spatially.
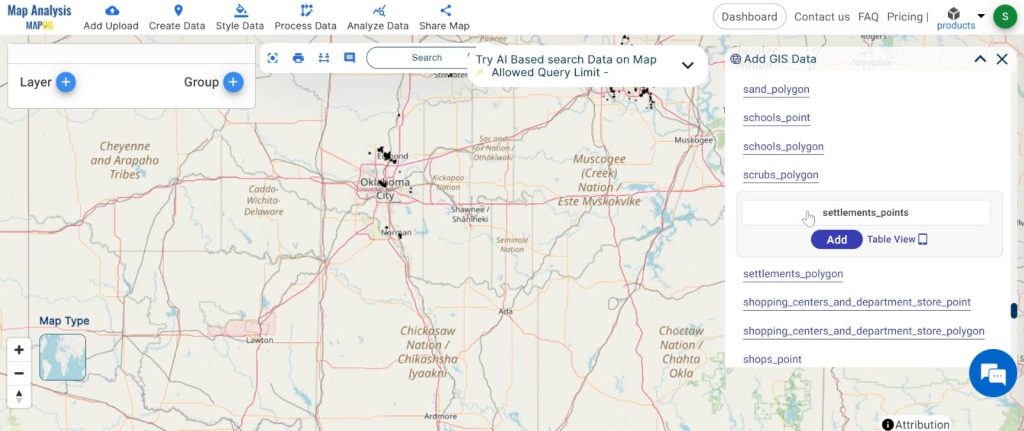
1.Click on the “Add Upload” button and choose “Add GIS Data“.
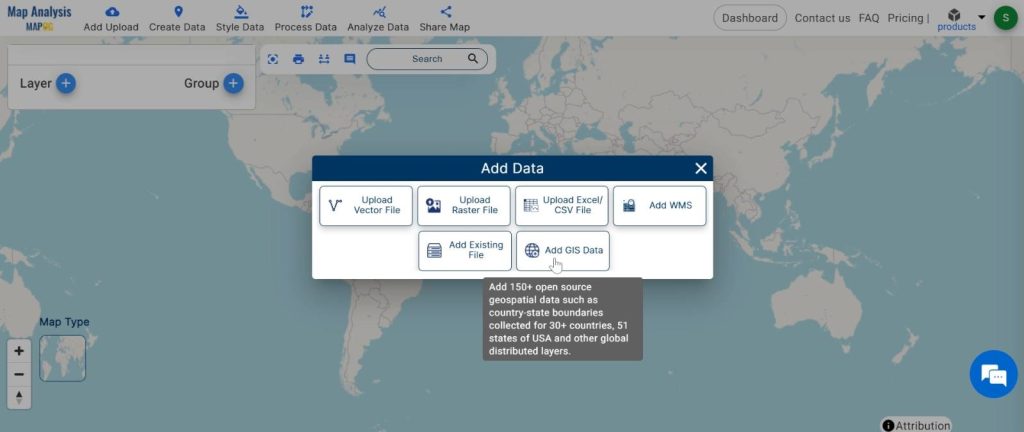
2.here search the country name.
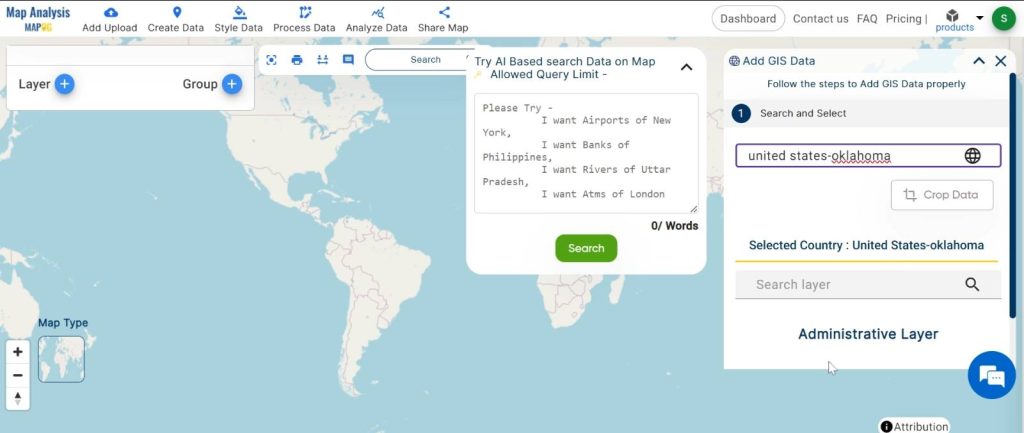
3.now add the data.
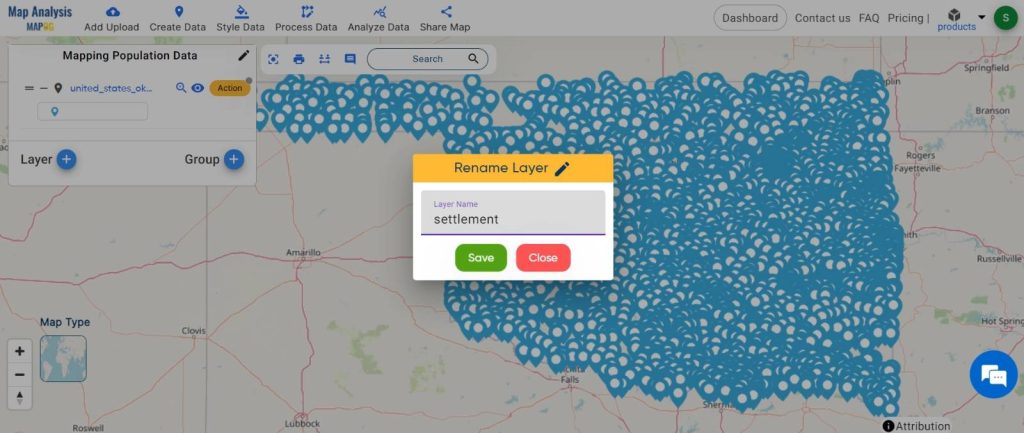
Step2: Name the untitled map and Rename the layer:
1.Here you have to name the untitled map
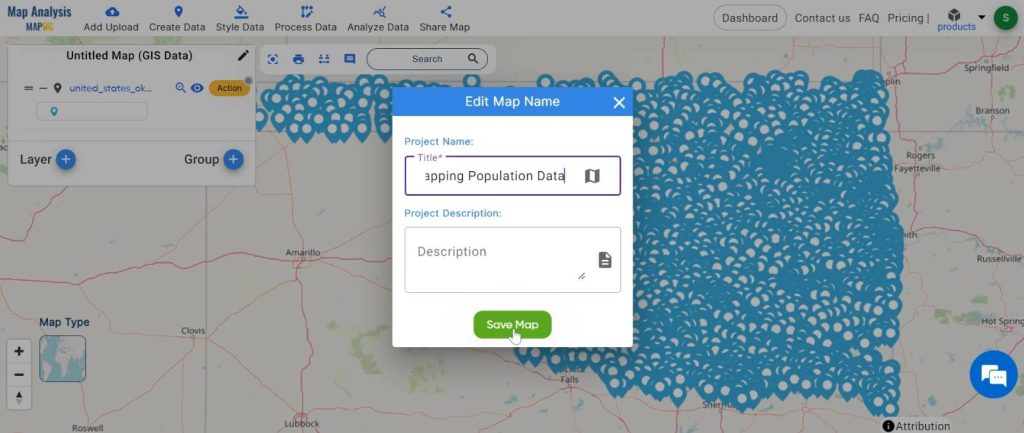
2.Rename the layer
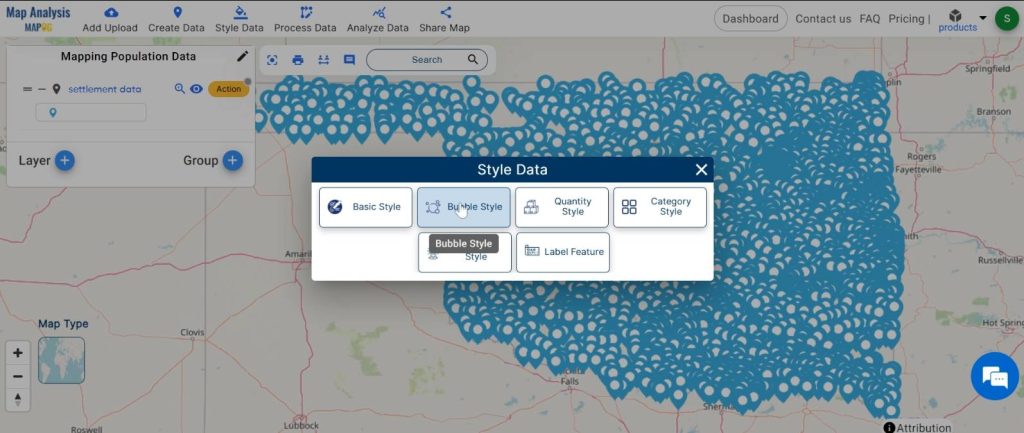
Step 3: Bubble Styling
Apply the bubble style mapping technique to your dataset, assigning bubble sizes proportional to the values they represent and colors indicative of different categories or gradients within the data.
1. Click on the “Style Data” button and choose “Bubble Style”.
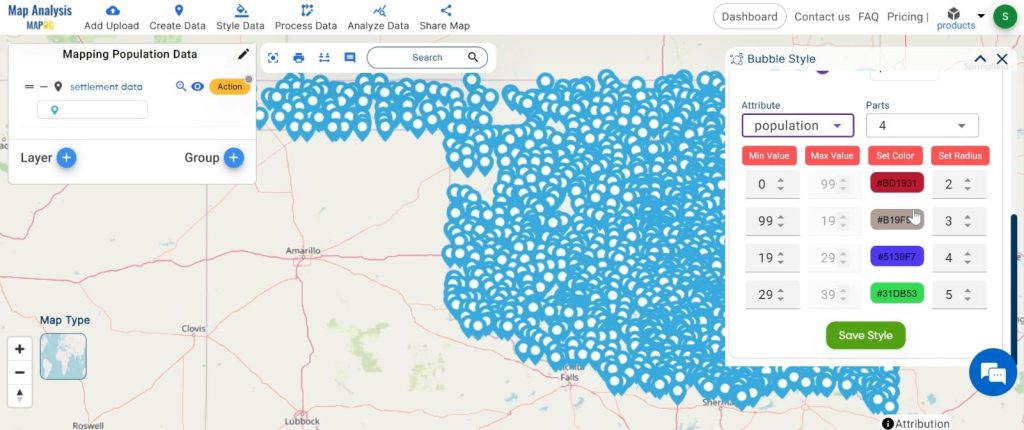
2. Now set the layer and attribute name. Then choose the colour and bubble radius.
Click on the “Save Style” button.
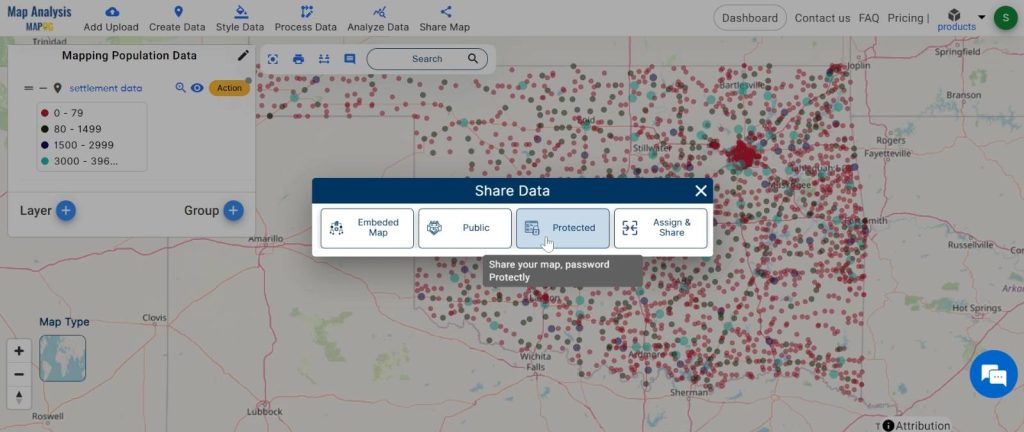
Step 4: Share and Collaborate
Share your bubble style map with stakeholders and colleagues.
Major Findings:
- Bubble style mapping offers clear insights into population distribution, highlighting areas of density and demographic disparities effortlessly.
- This dynamic visualization tool aids decision-makers in urban planning, resource allocation, and targeted interventions in public health and social services.
- Sharing bubble style maps fosters collaboration, facilitating data-driven discussions and informed decision-making processes.
Domain and Industry:
Bubble style mapping finds its application predominantly in Geographic Information Systems (GIS) and spatial analysis, where it serves as a pivotal tool for visualising and interpreting spatial data. Its utilisation spans across various sectors including urban planning, public health, market research, and social services, offering valuable insights for informed decision-making and strategic planning.
In conclusion, bubble style mapping proves indispensable in Geographic Information Systems (GIS) and spatial analysis, offering intuitive visualisations for informed decision-making. Across industries including urban planning, public health, and market research, it enables precise resource allocation and strategic planning. Its efficiency in translating complex data into actionable insights makes it a vital tool for addressing contemporary challenges.
Link of the Data:
Explore the data further through our GIS Data product, uncovering valuable information for in-depth analysis and understanding.
Exploring Our Previous Blogs:
- GIS Analysis in Urban Planning: Reshaping Transportation Future Insights of state/city
- Make Routes for Military Aerial Planning- Through Bearing angle and Distance calculation – Online Route Compass
- Create Map for Real Estate Developer for Best Site Selection
- Creating Travel Guides: Mapping with GIS Buffer Zones
1 thought on “Step-by-Step Guide: Creating a Dynamic Bubble Map for Free – Exploring Population Demographic”