In the realm of spatial analysis, understanding the distribution and types of educational institutions is paramount for effective planning and decision-making. With the advent of advanced GIS platforms, such as MAPOG, utilizing tools like proximity analysis has become instrumental in categorizing educational institutions with precision and efficiency. This article delves into the key concept of employing proximity analysis to categorize educational institutions, highlighting its importance in education and planning domains. Explore the application of MAPOG in wetland mapping-Protecting Wetlands: Guide to Create GIS Map for Nature.
Key Concept for Categorization of Educational Institution Types
The key concept revolves around leveraging proximity analysis within MAPOG to categorize educational institutions based on their types, including schools, colleges, universities, and kindergartens. By analyzing the spatial relationships and distances between these institutions, we can accurately classify them and gain insights into their distribution patterns within a given area. The link for GIS data is available at the end of this article.
For more information on fast emergency response, check out our article – Fast Emergency Response: Using GIS and Isochrone Maps for 10-Minute Ambulance Arrival
Steps for Categorization of Educational Institution Types
Step 1 Upload the data
Navigating to the MAPOG map analysis tool, add the GIS data for our needs.
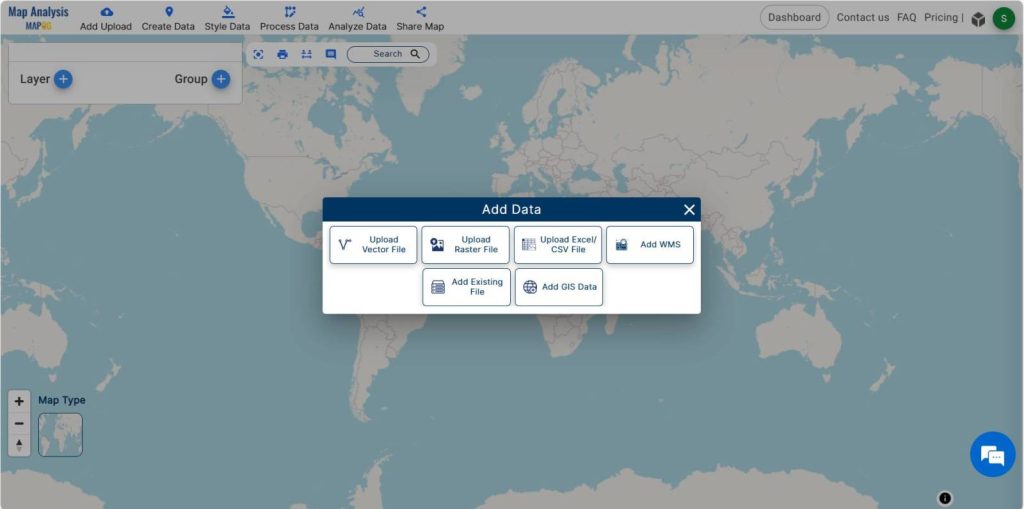
Transitioning to the MAPOG map analysis tool, we add the GIS data for our needs. MAPOG offers a wide range of data. Herein, the educational institutions data in an area is added. You may opt to manually select or utilize the AI search option for data addition.
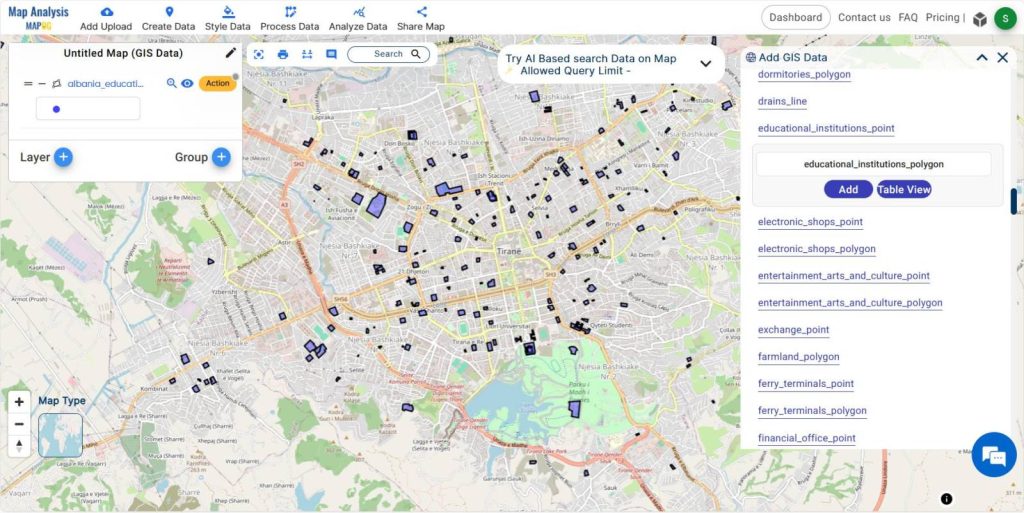
Selecting the educational institutions and adding them to the layer, the data in this area becomes visible on the screen.
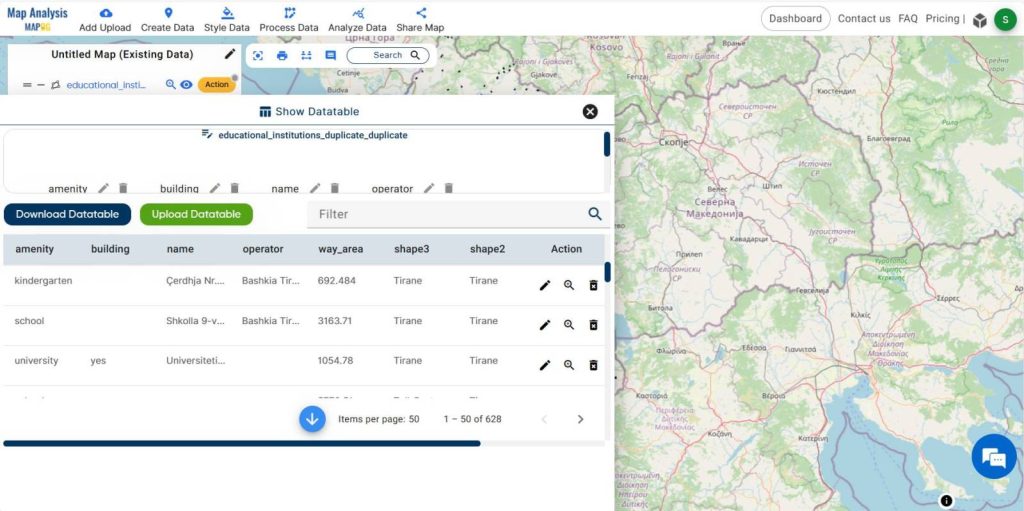
Furthermore, you can explore the datatables by navigating to the action button. Within the data table, information pertaining to educational institution types, such as schools, colleges, and universities, is readily available.
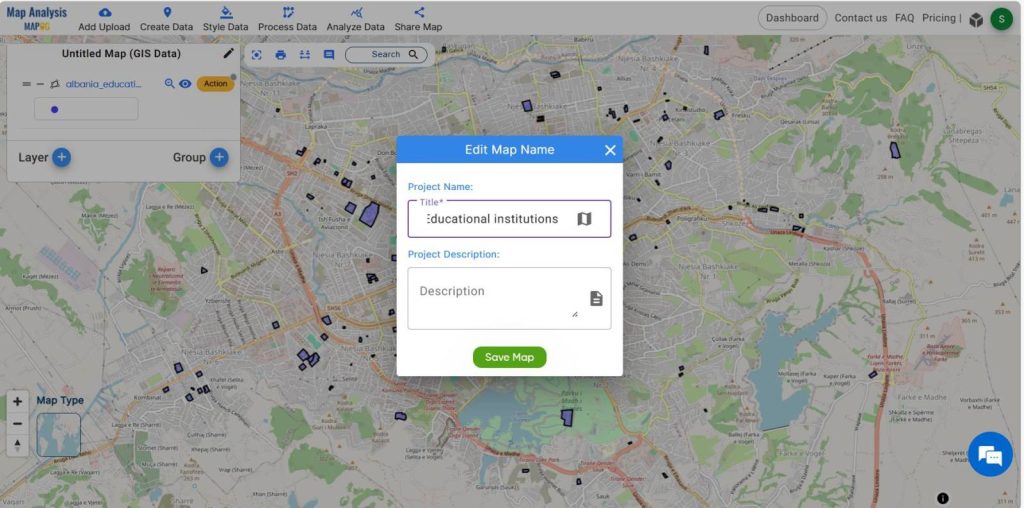
Step 2 Project Title
Give the project a title instead of leaving it untitled. Additionally, describe your project in the description box.
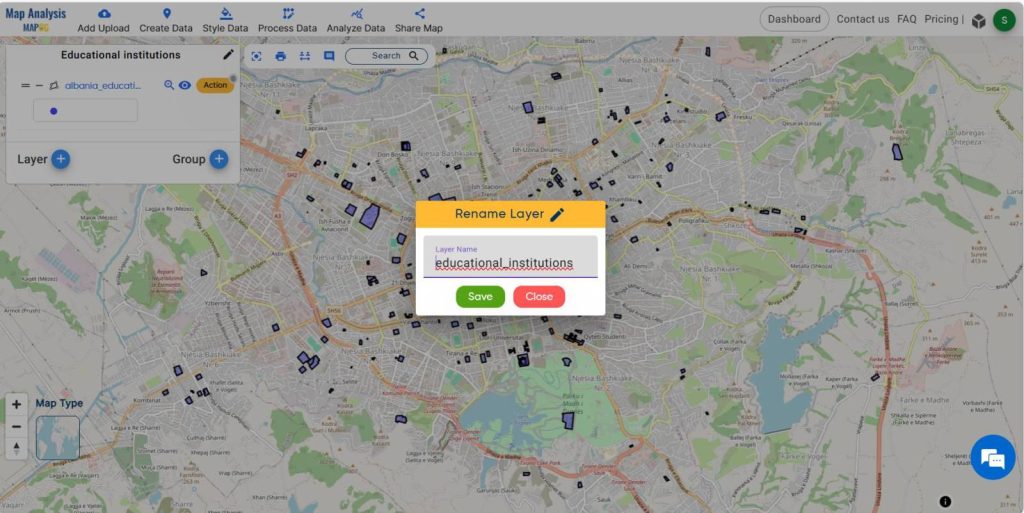
Step -3 Rename the layers
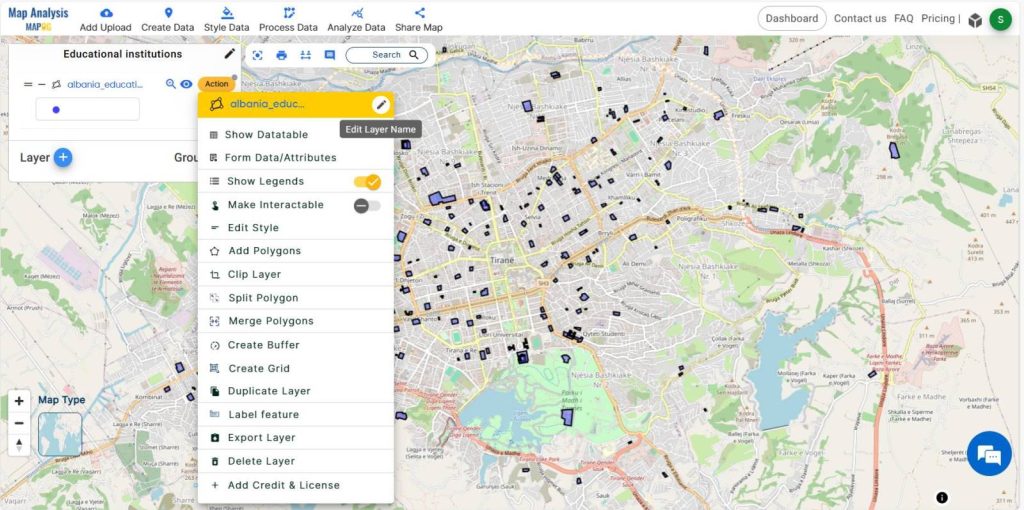
To improve comprehension, select the action button linked to the data layer and proceed to rename the educational institutions data layer.
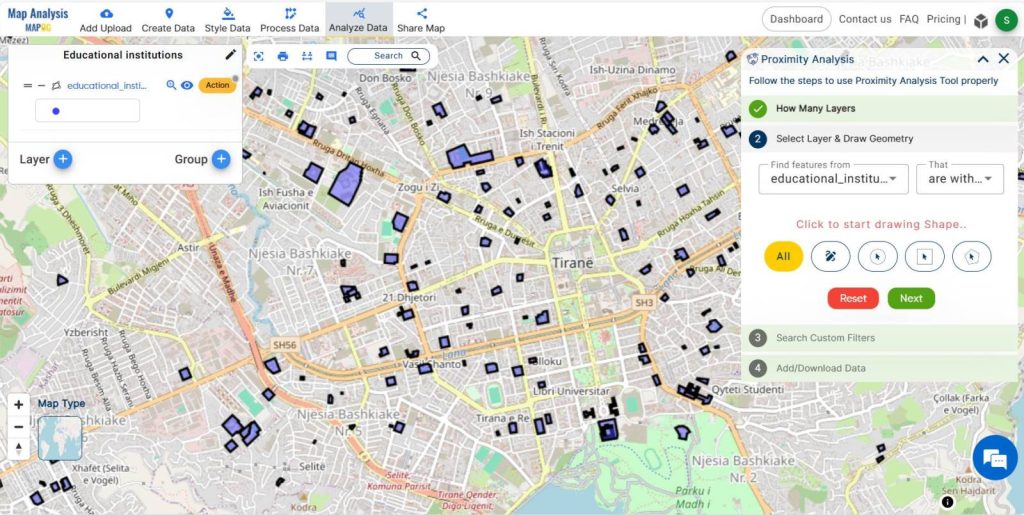
Step-4 Proximity Analysis
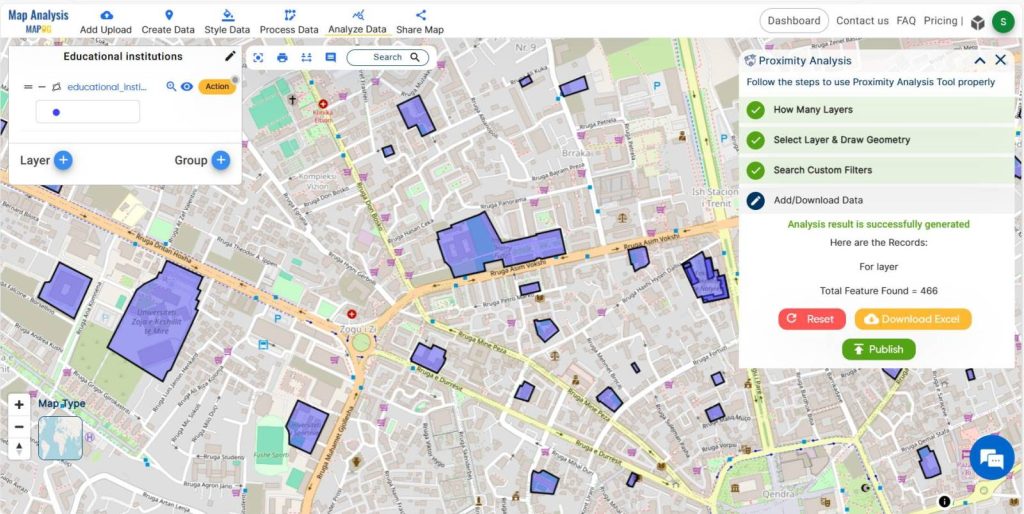
Navigate to the Analysis Data menu, whereupon a window for proximity analysis will appear. Choose the educational institutions data and identify the schools within this dataset.
Utilize the attribute amenities, then opt for the ” = “option and input the feature to locate – school. Proceed to submit the data. The result shows the number of schools in that area.
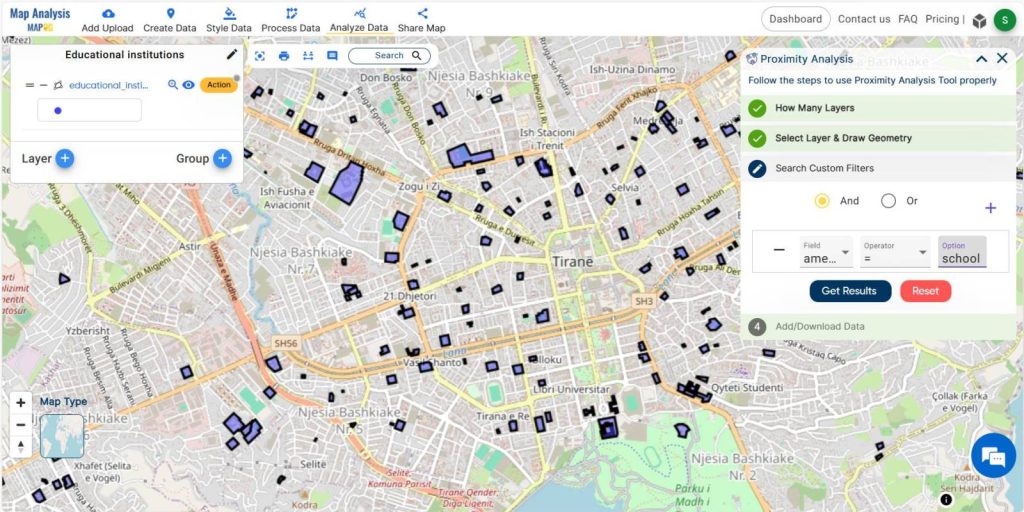
Use the publish option to view this data as a new data layer. Rename the layer as “School” for improved clarity. Additionally, you have the option to hide and unhide the layer for additional visual analysis.
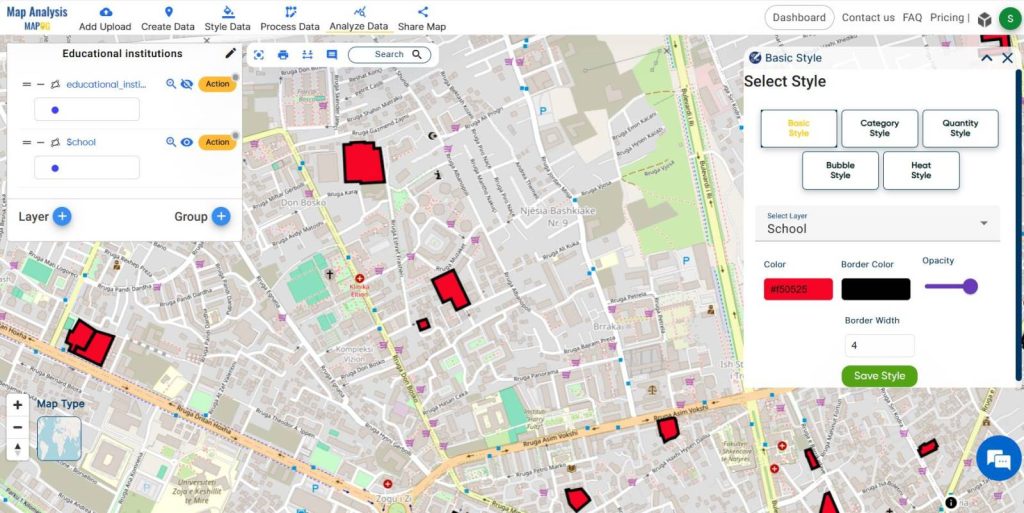
Step -5 Styling
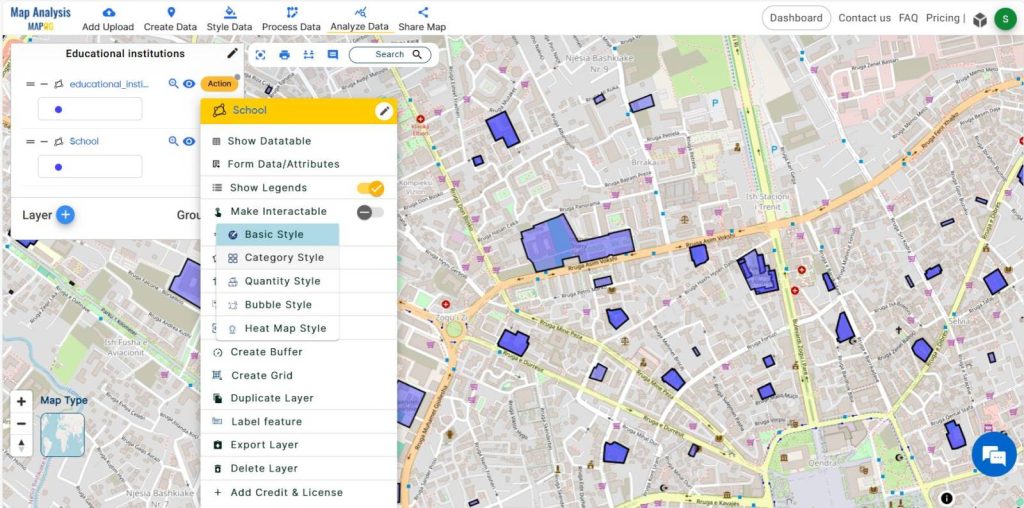
Click on the action button associated with the school data layer to edit the style, then transition to the basic style option, selecting appropriate colors and adjusting the opacity to maximum, while also modifying the border color and width as needed.
Likewise, categorize other educational institutions like colleges, universities and kindergartens from the dataset using proximity analysis and tyle with variant colors using the style data menu.
Output Map
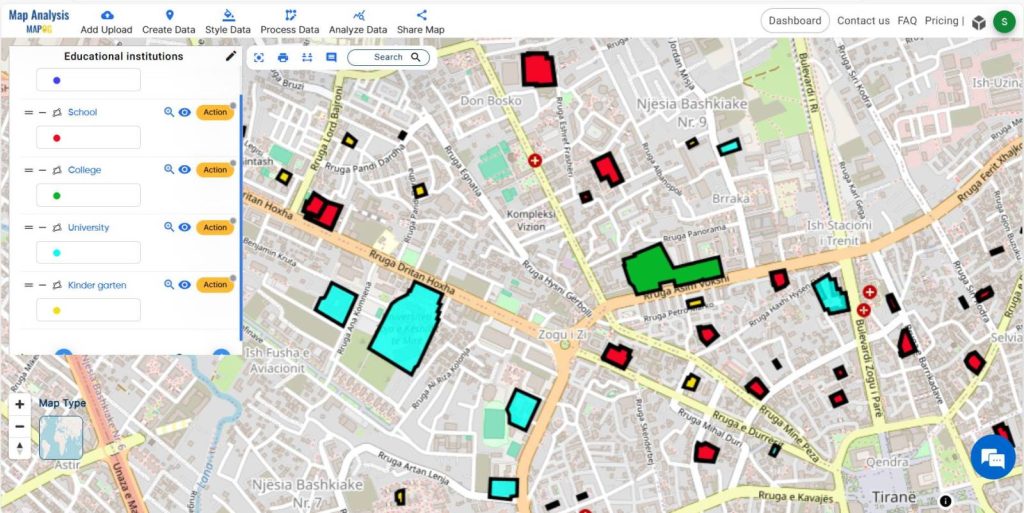
The output map showcases the categorization of different types of educational institutions such as schools, colleges, universities and kindergartens. using the proximity analysis tool, allowing for clear visualization and analysis.
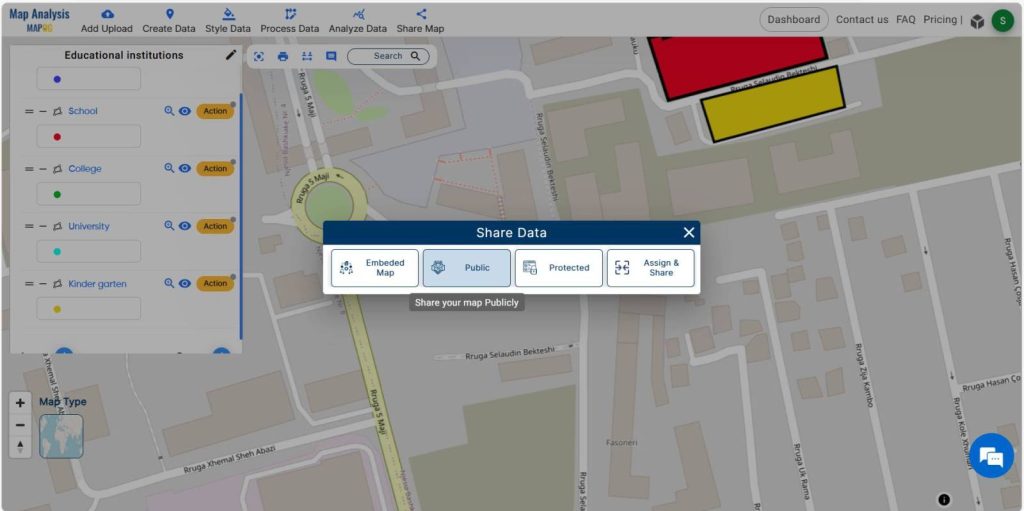
Step 6- Share Data
Share this map to the public using the share data menu.
Major Findings
- Efficient identification of schools, universities, and colleges.
- Streamlined data organization for educational planning.
- Enhanced decision-making for resource allocation.
- Understanding of educational infrastructure distribution.
Domain and Industry
In the domains of education and planning, the application of MAPOG holds significant implications. Educational institutions, policymakers, and urban planners can utilize this approach to optimize resource allocation, identify areas in need of educational facilities, and improve overall accessibility to quality education.
Conclusion
the utilization of MAPOG revolutionizes the categorization of educational institution types. By providing actionable insights into spatial distribution and relationships, this approach empowers stakeholders in education and planning domains to make informed decisions that positively impact communities and enhance educational opportunities. Are you interested in Habitat Mapping? Check this article-Map habitat locations of endangered animals & keep track of their living.
GIS Data Links- Educational Institutions