Wetland Conservation: GIS Protection Strategies are paramount as wetlands, vital for biodiversity and ecosystem services, face growing threats from human activities and climate change. Effective conservation and management strategies hinge on accurate mapping and monitoring of wetland resources. This article explores the application of MAPOG in wetland mapping, emphasizing its capabilities in executing Wetland Conservation: GIS Protection Strategies for preserving these invaluable ecosystems.
Buffer Analysis in MAPOG: GIS Insights for Wetland Protection
The buffer analysis tool in MAPOG is a powerful GIS tool. This tool helps you create a zone for your requirements, which is also called Buffer. By using buffer tools in the wetland area of United States Indiana, the extent of specified distance from the edges of selected features can be studied and also the spatial relationships and potential impacts of that area can be analyzed.
Benefits from Creating Buffer zones
MAPOG GIS tools offer a powerful platform for wetland mapping and conservation, enabling users to analyse spatial data, generate informative maps, and support evidence-based decision-making. By harnessing the capabilities of MAPOG GIS tools, stakeholders can enhance their capacity to monitor and manage wetland resources effectively, ultimately contributing to the long-term sustainability of these vital ecosystems.
How to analysis for wetland protection
Here are the steps for creating wetland conservation map:
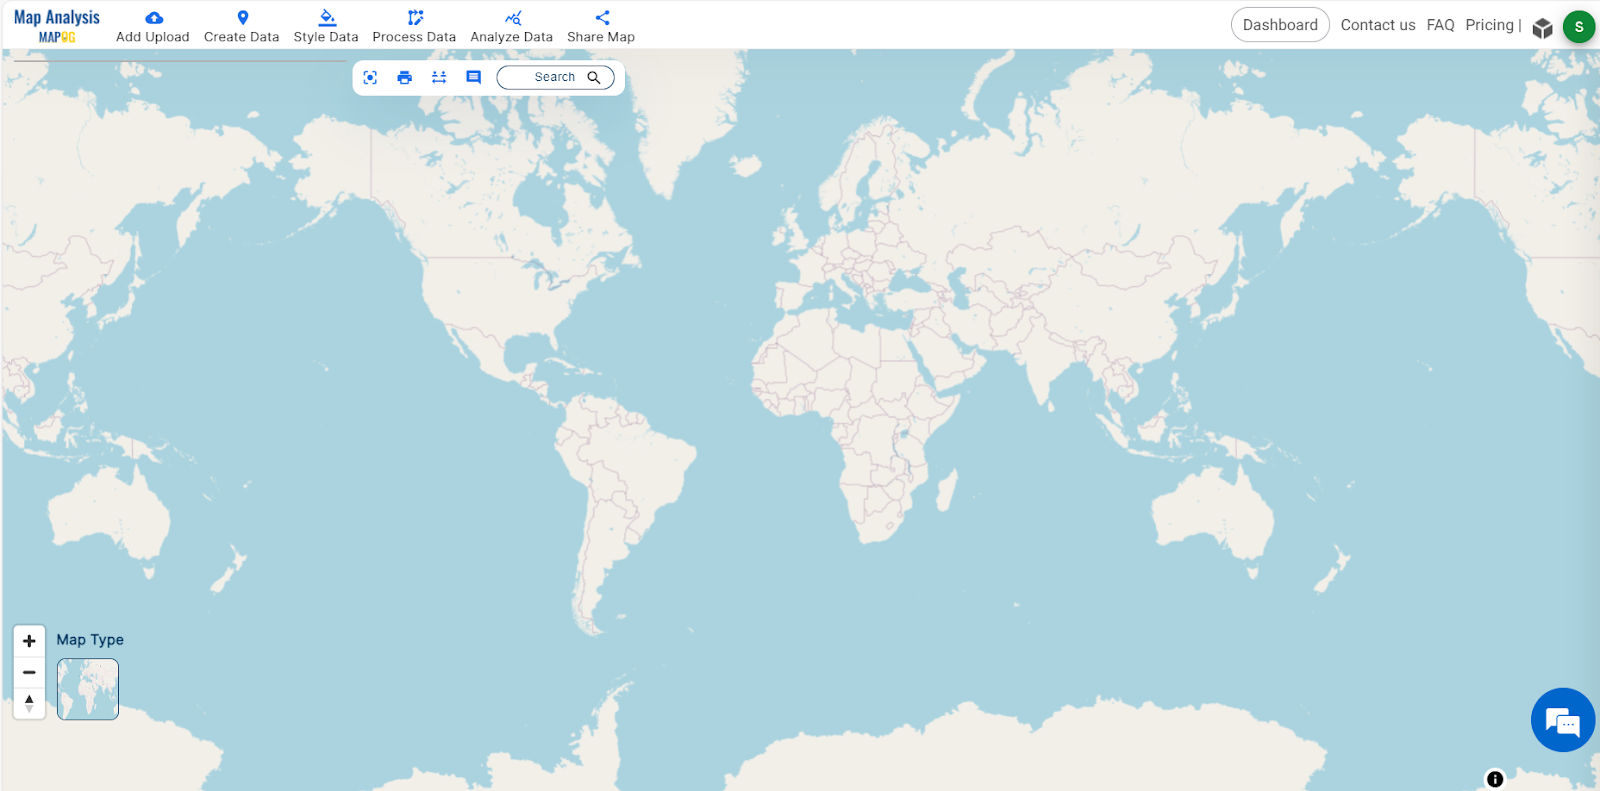
Step-1 Open Map Analysis interface from MAPOG
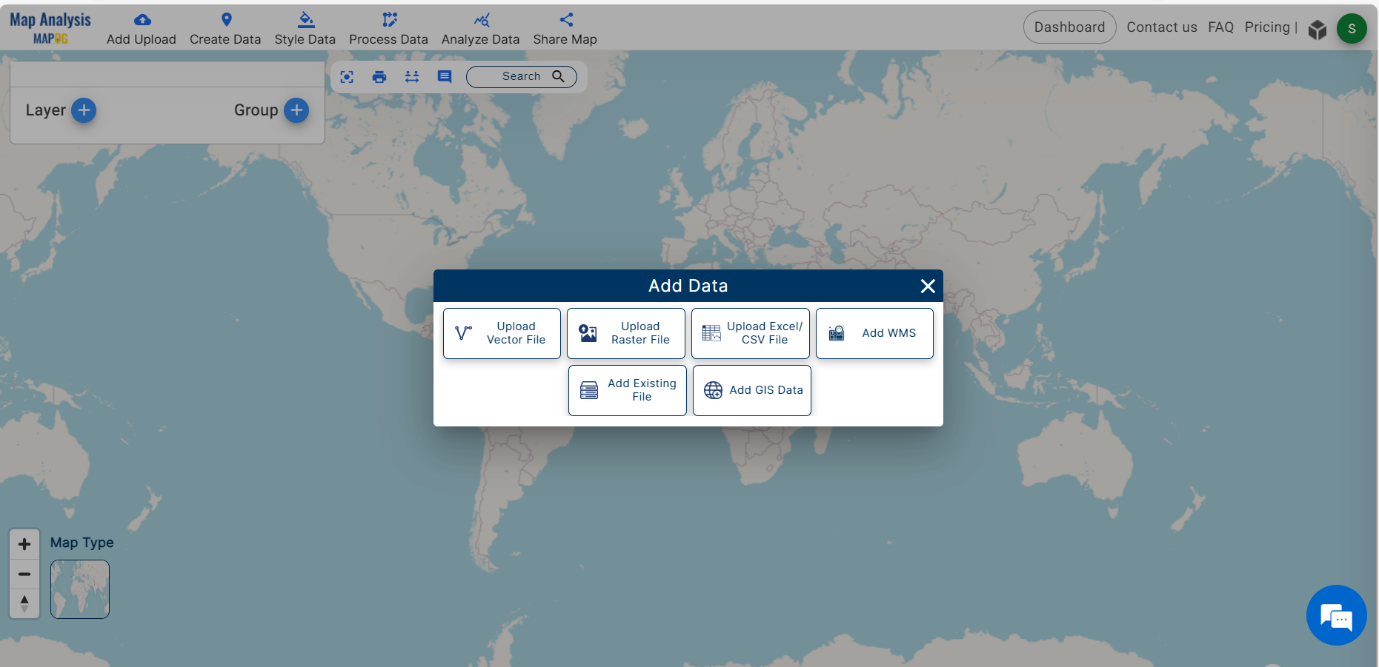
Step – 2 Add Wetland polygon data
Navigating to Map Analysis tool, Select Add Upload Option and Click on Add GIS Data.
To upload the Wetland data, River line data and Streamline data, select the United States Indiana Region (Area of Study) and scroll down to select the wetland polygon data from the in- built GIS data in MAPOG. Then Click on the Add button.
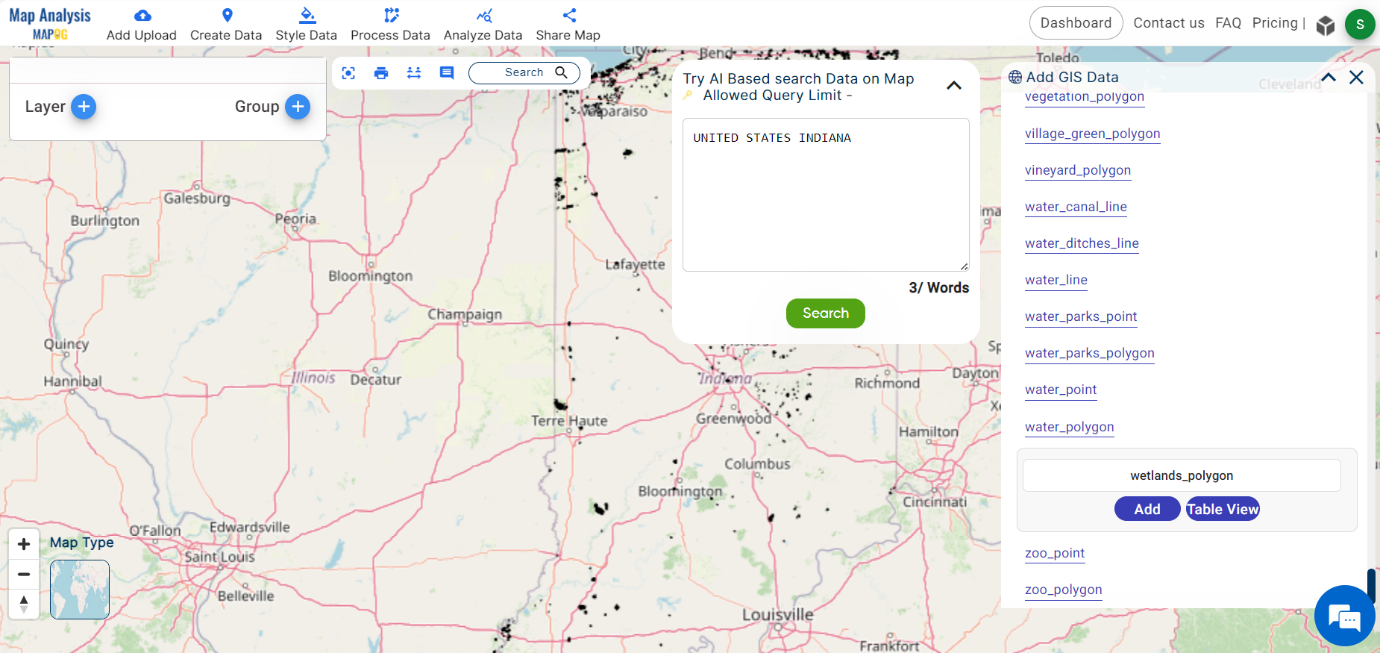
Thus, Wetland Data added successfully. You can download GIS data from – Wetland polygon data.

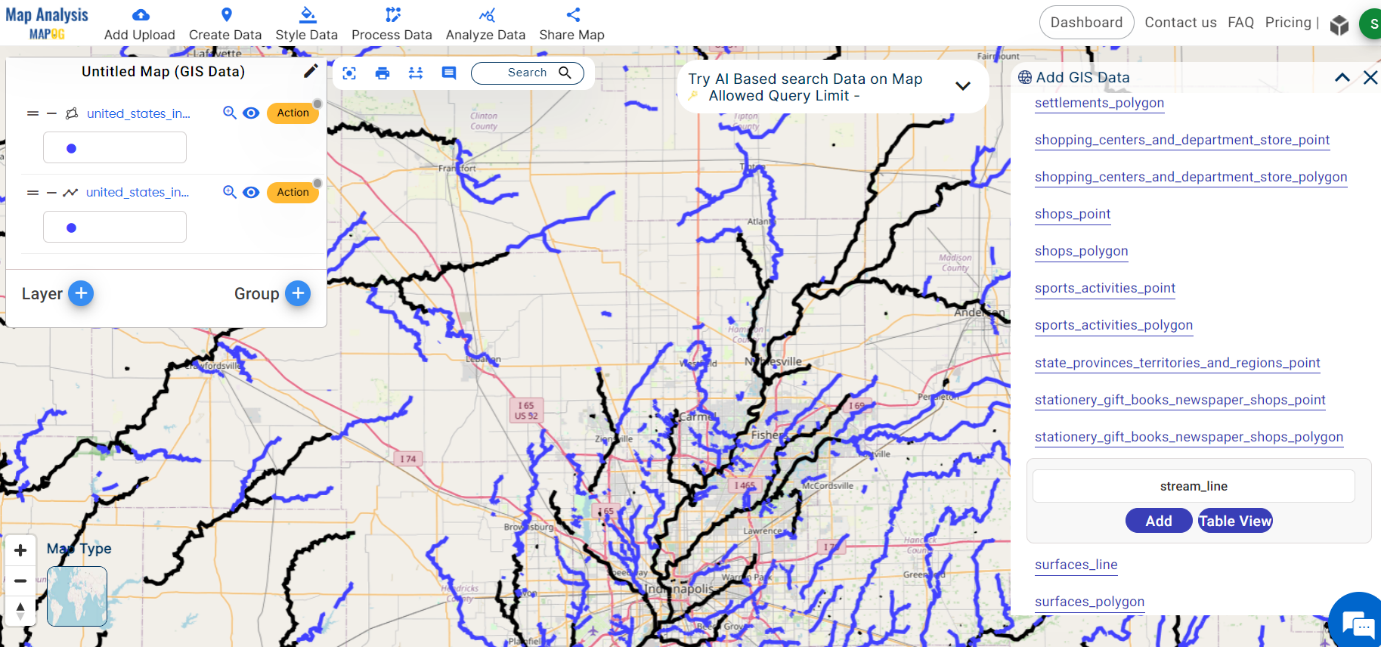
Thus, River line data added, likewise add streamline data. GIS Data Link – Streamline data.
GIS Data Link – River Line data
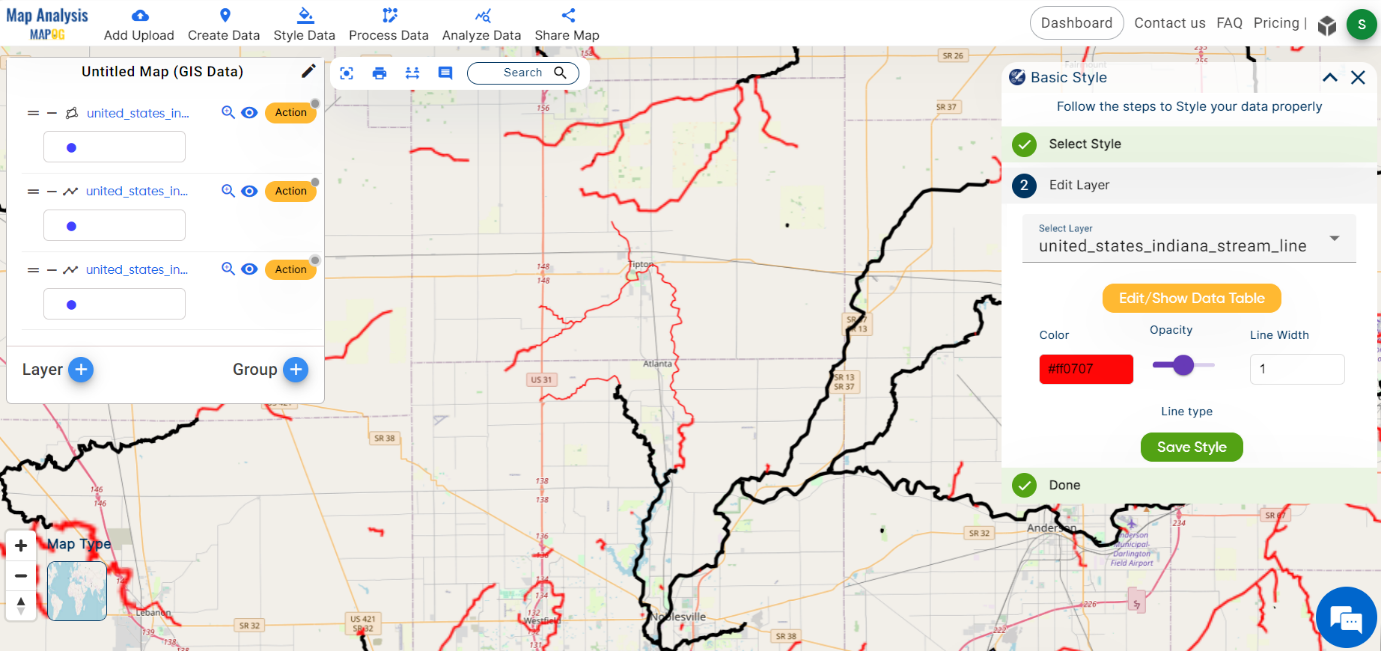
Step- 3 Style your map
Apply basic styles to the map by giving variant colors to your data added.
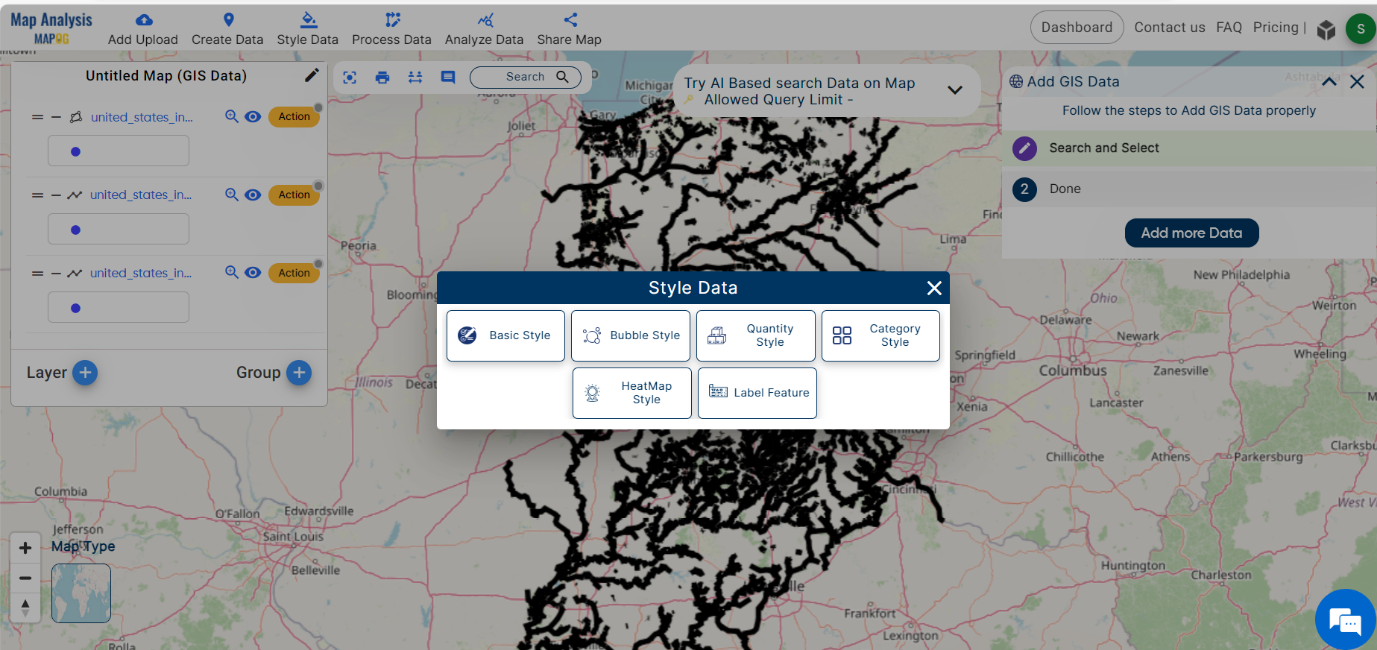
Select the layer to which the basic style should be applied and choose the color and save it.
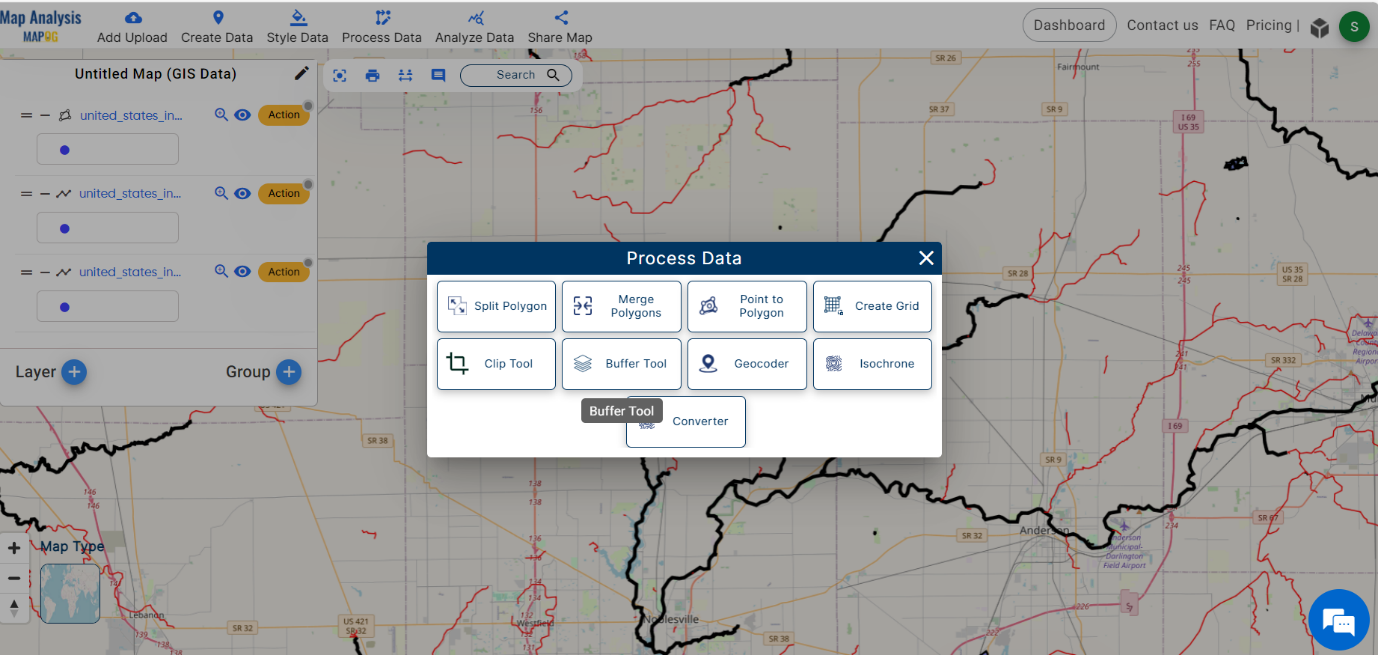
Step-4 Creating Buffer Zone
Click on Process data and select Buffer Tool. Select the layer to be buffered and type the range to create a buffer zone.
Create a buffer zone around the wetland and the river using a buffer tool.
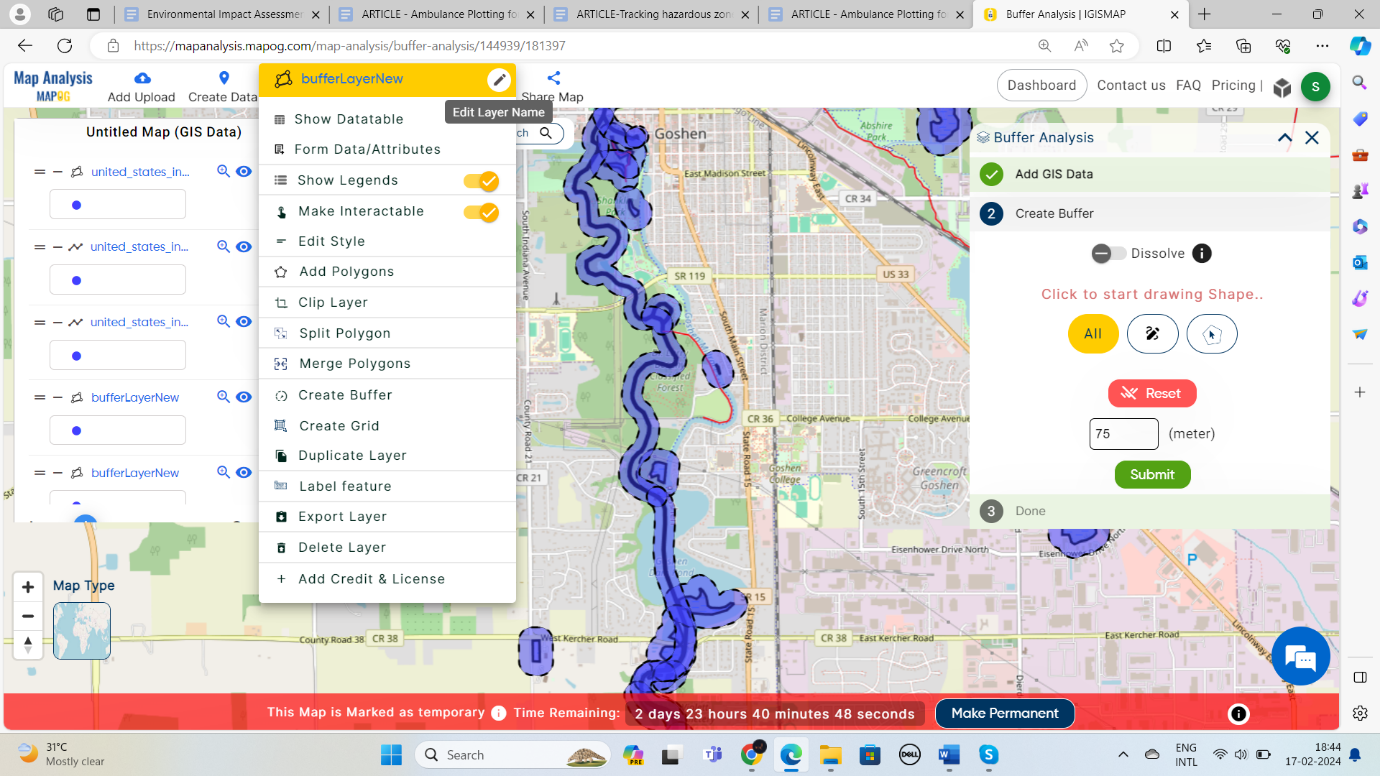
Rename the buffered layers for better understanding.
Step-6 Save the Map
To save your map, simply click on the pencil icon located next to the Untitled Map text. Enter appropriate names and descriptions in the dialog box that appears. Then, click on the Save Map option. Your project will be saved.

Step-7 Share the map
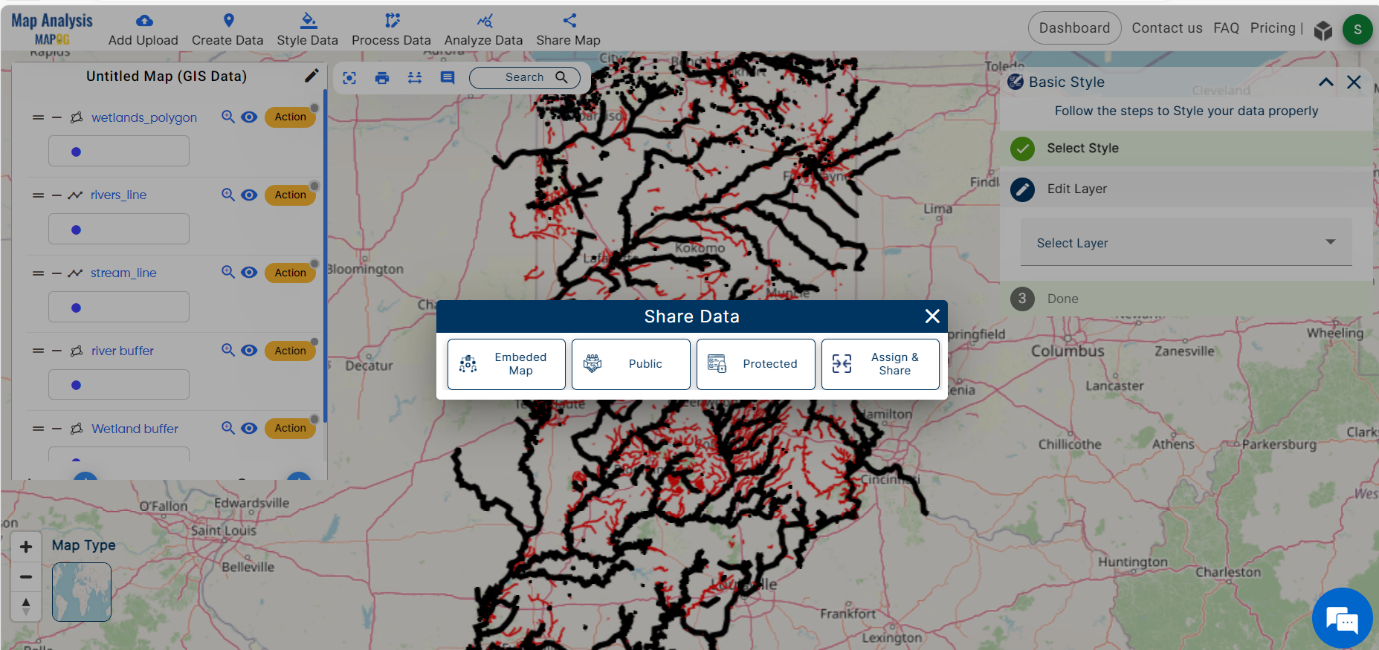
Result
The buffer zone created around the wetland and the rivers can be considered as a protective zone for the conservation of the wetlands.

Findings and Factors to Consider
- Understanding Wetland Dynamics: GIS tools allow for the visualization and analysis of spatial data related to wetlands, enabling researchers and conservationists to understand the complex dynamics of wetland ecosystems.
- Effective Decision-Making: By integrating various data layers such as land use, hydrology, decision-makers can prioritize conservation efforts, allocate resources efficiently, and develop evidence-based policies for wetland management.
- Habitat Assessment and Monitoring: GIS enables the assessment and monitoring of wetland habitats at different spatial and temporal scales.
- Identification of Threats and Vulnerabilities: GIS tools can be used to identify threats to wetland ecosystems, such as habitat loss, pollution, invasive species, and climate change impacts.
- Community Engagement and Stakeholder Participation: GIS can serve as a powerful tool for engaging local communities and stakeholders in wetland conservation efforts.
Conclusion
MAPOG stands as a versatile tool, not only in wetland conservation with its GIS Protection Strategies but also in various crucial applications. Whether it’s reshaping transportation networks, planning military aerial routes, mapping tiger attack hotspots, or ensuring fast emergency response, MAPOG stands at the forefront. Learn more about our journey in GIS analysis for urban planning, military aerial planning, and emergency response by exploring these insightful articles: ‘GIS Analysis in Urban Planning: Reshaping Transportation Future Insights of state/city,‘ ‘Make Routes for Military Aerial Planning- Through Bearing angle and Distance calculation – Online Route Compass,’ and ‘Mapping Tiger Attack Hotspots – Create an Online Map and Share.’ Each article delves into unique GIS applications, showcasing the power of technology in addressing diverse challenges and contributing to a safer, more connected world.”
13 thoughts on “Protecting Wetlands: Guide to Create GIS Map for Nature”