We invite you to delve into the heart of the Sundarbans, where the lush mangrove forests and winding waterways create a unique ecosystem teeming with life. As guardians of geospatial intelligence, MAPOG extends a hand to explore an unprecedented facet of vulnerability analysis. This article delves into the intricate process of mapping tiger attack hotspots through advanced spatial analysis techniques.

In this riveting expedition, we unravel the mysteries of vulnerability faced by local communities residing in the Sundarbans, where the dance between humanity and nature takes centre stage. Imagine a map that goes beyond the conventional, a map that not only delineates geographical features but also intricately plots vulnerability hotspots susceptible to tiger attacks.
Thematic Map
A thematic map is a visual representation that focuses on a specific theme or topic, presenting spatial data in a way that emphasises patterns, relationships, or distributions. It utilises colours, symbols, or patterns to convey information, providing insights into geographic variations and facilitating the interpretation of spatial phenomena.
Benefits of Mapping tiger attack hotspots
Mapping vulnerability in the Sundarbans through a comprehensive vulnerability analysis offers numerous benefits, addressing critical aspects of human-wildlife interaction and ensuring the well-being of both communities and the environment. It empowers communities with risk awareness, supports wildlife conservation efforts, helps in Research and Monitoring, informs policy decisions, and facilitates efficient emergency responses.
Below are the steps of mappinng tiger attack hotspots of Sundarbans Fringe Villages
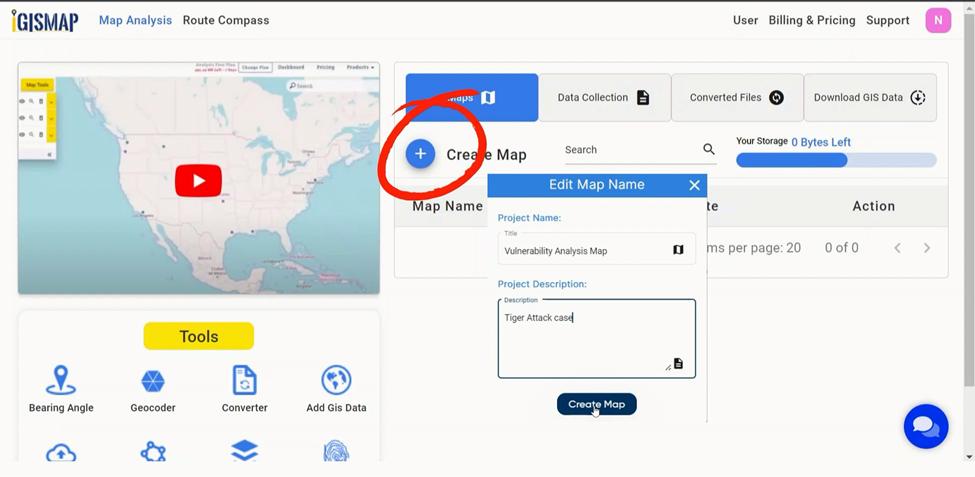
Step 1: Create Project
To create a Vulnerability Analysis Map first we have to login in our account with our specific MAP login ID & Password. By doing that we came into the interface of MAP application. Then click on Create Map option, a dialogue box will open. Fill up the dialogue box with Basic information Like the name of the project and a description to organize the work.
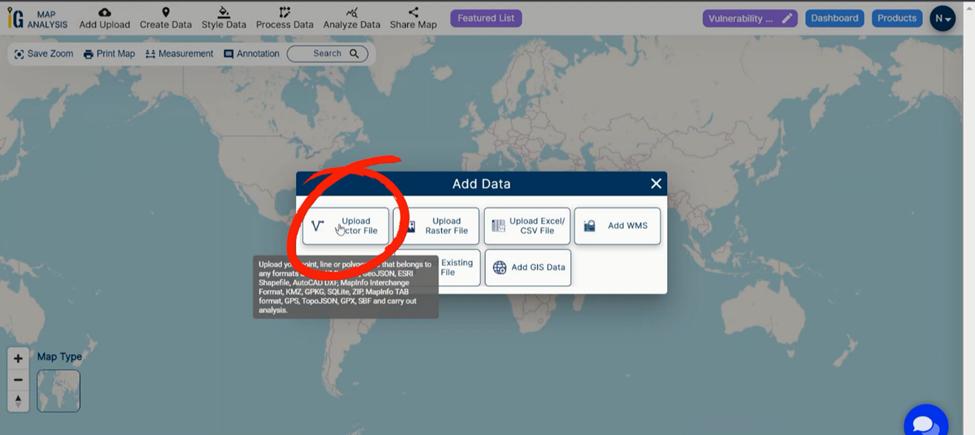
Step 2: Upload Vector Data
Once the project is created, the next step is to add the data. After entering the MAPOG canvas, go to the Add polygon option and select the “Upload Vector data” to upload the data. A box will open on the right side of the screen, select the browse option to browse the data & click upload to upload the data. The base data is containing the Tiger attack information. This initial step sets the stage for a detailed analysis, benefiting the Forest Department, Local communities, and Government.
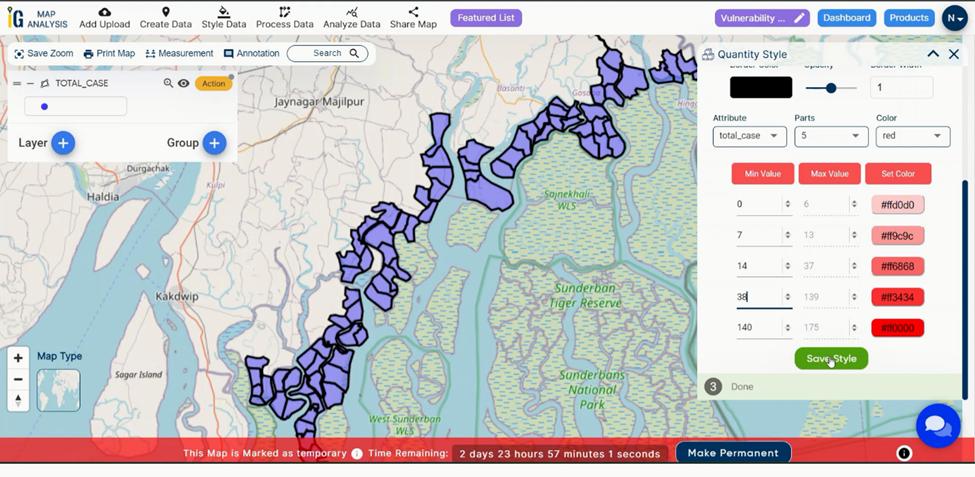
Step 3: Thematic Styling for total case:
Now, let’s add thematic styling to differentiate & enhance the visualisation of Tiger attack in those villages. To style the data go to the style data option and select the Quantity style option to visually interpret the data. Select the layer to be published in the edit layer option. In the attribute cell select the “Total Case” option & manipulate the rest of the option like parts, Minimum and maximum value as you desire, select a colour and save the style. This level of detail aids the Forest Department, survey, Local communities, and Government.
Step 4: Add legends for better explanation:
Additionally, MAP give the opportunity to enhance the map by adding the legend. To add legend, go to the Action button and turn on the Show legends option and your legends will be visible on the left side of the canvas. This lets the user explain the colour code schemes to provide context to the audience.
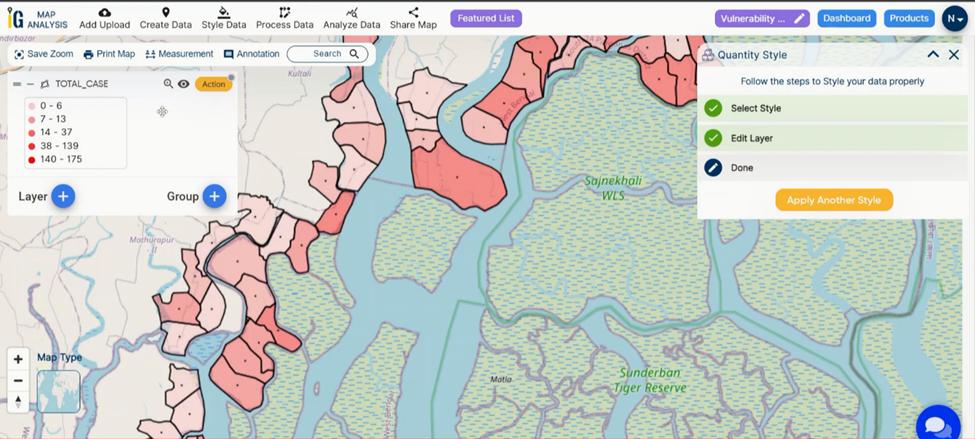
Step 5: Result And Analysis:
With our map now enriched with details, let’s make those final adjustments. This thematic map is a powerful tool for Targeted Risk Mitigation, Community Empowerment, Wildlife Conservation, Policy Formulation, Emergency Response Planning, Research and Monitoring and more. Export it for impactful use. The thematic nature of this map is clearly providing the insightful details of the Tiger attacks in those areas.
Findings and Factors to Consider
- High-Risk Zones: Identification of specific areas with a high frequency of tiger-human interactions and potential conflict zones.
- Spatial Trends Over Time: Recognition of spatial trends in vulnerability over time, allowing for a dynamic understanding of the evolving tiger-human dynamics.
- Historical Incident Data: Analyse historical tiger attack data to identify patterns, frequency, and areas with a higher incidence of conflicts.
- Human Settlements: Assess the distribution, density, and proximity of human settlements to tiger habitats, highlighting potential conflict zones.
- GIS Technology Accuracy: Validation of GIS technology accuracy in mapping and analysing spatial data for reliable vulnerability assessments.
- Emergency Response Infrastructure: Assess the availability and effectiveness of emergency response infrastructure, including communication systems and evacuation plans.
- Continuous Monitoring Recommendations: Recommendations for continuous monitoring and updates to adapt strategies based on changing conditions and emerging patterns.
We’ve found that utilising MAPOG‘s thematic analysis tool has been pivotal in uncovering these spatial patterns and revealing essential insights for our research.
The vulnerability analysis map for Sundarbans tiger attacks delineates high-risk zones, aiding targeted interventions. It empowers communities with risk awareness, supports wildlife conservation efforts, informs policy decisions, and facilitates efficient emergency responses. This spatial tool ensures a balanced coexistence between human settlements and Bengal tigers in the Sundarbans. This article serves as a testament to the value of MAPOG’s GIS vulnerability Analysis of Tiger attacks in spatial research and planning, offering a practical and clear path to unlocking geographic insights.
If you looking for making aerial route map then check our Route Compass Tool.
Other Articles
- Protecting Wetlands: Guide to Create GIS Map for Nature
- GIS Analysis in Urban Planning: Reshaping Transportation Future Insights of state/city
- Fast Emergency Response: Using GIS and Isochrone Maps for 10-Minute Ambulance Arrival
- Mapping Tiger Attack Hotspots – Create an Online Map and Share
- Make Routes for Military Aerial Planning- Through Bearing angle and Distance calculation – Online Route Compass
- Mapping Healthcare Efficiency: GIS Buffer Analysis of Hospital Locations
- Add WMS- Two step online view of WMS layer on a map
- Plot ATM locations on a map and embed on your website
- Map habitat locations of endangered animals & keep track of their living
6 thoughts on “Mapping Tiger Attack Hotspots – Create an Online Map and Share”