Let yourself loose into a memorable exploration of Analysis of Forest Fire and Map Risk Areas by using the Buffer Tool within MAPOG. Dive into the revelations regarding the insights discovered, the new strategies that emerged, and the overall understanding came about relate to wildfire processes in the past 10 years. Data-driven approaches will be introduced to help in the combat of pollution as well as the preservation of our ecosystems.
Key Concepts for Decade of Forest Fire Analysis with Buffer Tool
Vulnerability mapping is being among the most straight-forwardly the desired goal that identifies the fire prone critical area of mangrove zones in our attempt. There is a clear design of the map in the form of a storytelling which gives us an in-depth knowledge of the forest fires that occurred in these regions.
Steps to Create Decade of Forest Fire Analysis with Buffer Tool
Step 1: Upload Excel File
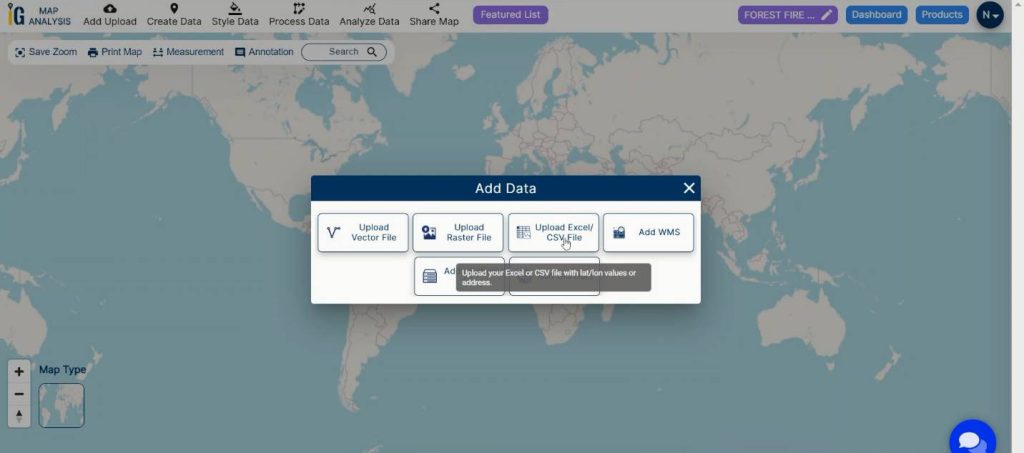
First, navigate to the Map analysis interface, next step is to add the data. After entering the MAPOG canvas go to the header and you’ll find the Add polygon option and select the Upload Excel/CSV file from the dialogue box to upload the data.
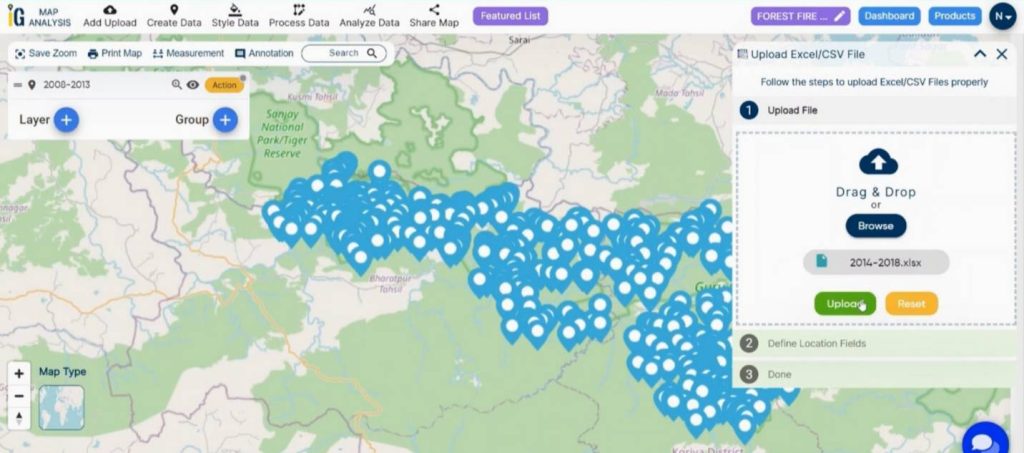
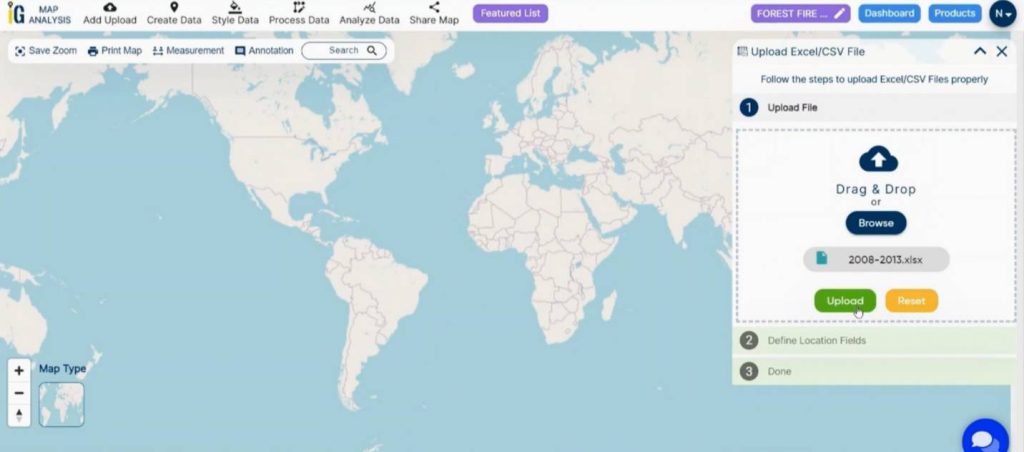
A box will open on the right side of the screen, select Browse option to browse the data & click Upload to upload the data. Here, I’ve chosen the 2008-2013 & 2014-2018, ten-year long forest fire data for the analysis. First, we are adding the 2008-2013, five-year long data.

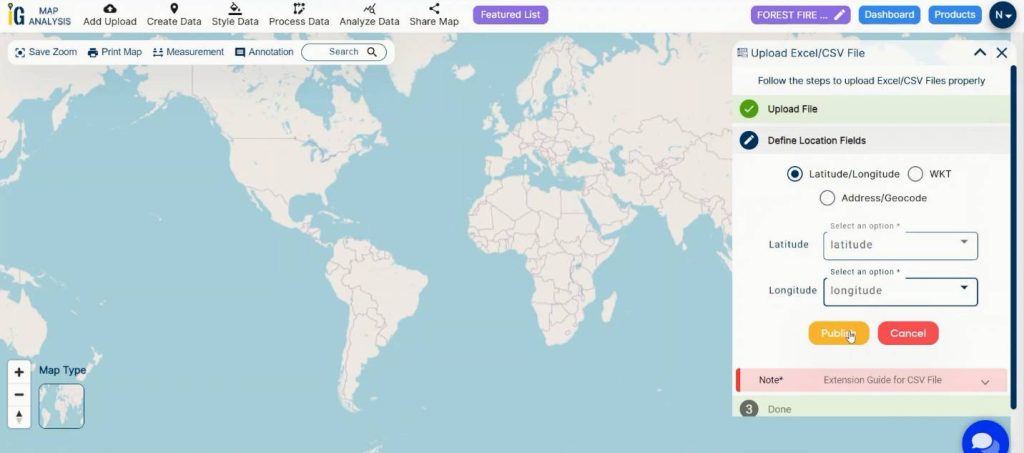
Then in Locational field Select the Latitude /Longitude option and select Latitude & Longitude from the options from drop down menu and Publish it.
By using the same method upload the 2014-2018 forest fire data.
Step 2: Add Thematic Style
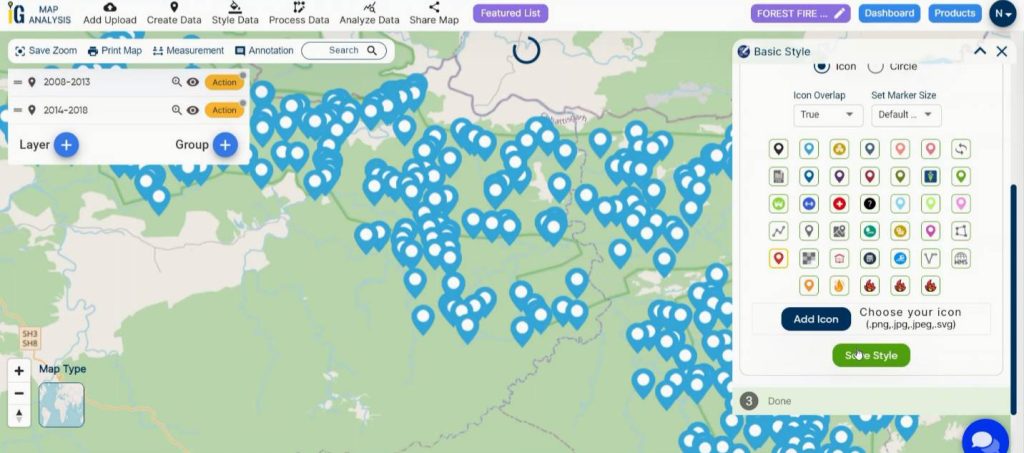
Now, let’s add thematic styling to differentiate & enhance the visualization of Forest Fire. select the Basic style option from the dialogue box in the right-side corner of the screen to visually interpret the data.
Dive into the world of petrol pump accessibility with our spatial analysis guide! Explore “Petrol Pump Accessibility: A Spatial Analysis Guide Using Buffer Zones” and see how buffer zones enhance route planning, ensuring convenient access to fuel stations and optimizing travel experiences.
Select the layer to be published in the edit layer option. Here I’ve selected a blue color icon for 2008-2013 Forest fire points and a red color icon for 2014-2018 Forest fire points to clearly visualize and differentiate between both layers. Select save style option to save the style
Step 5: Create Buffer Zones
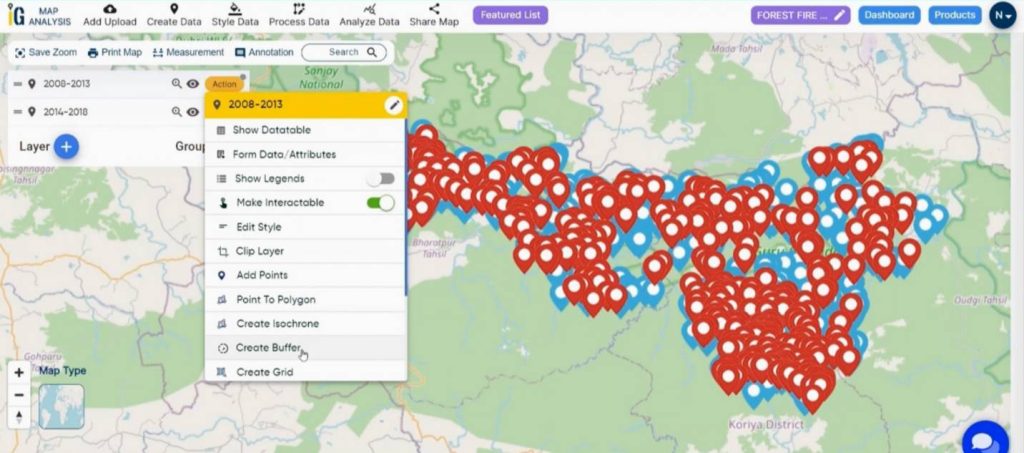
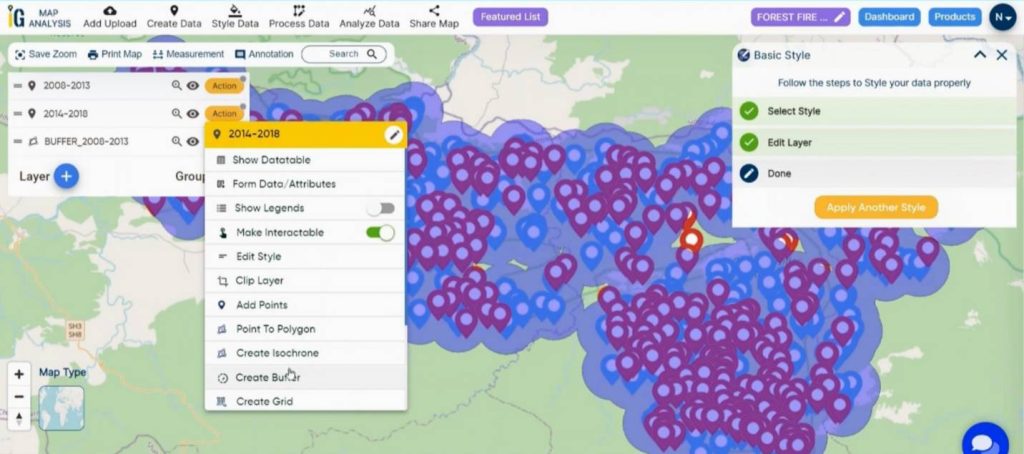
Now we’re going to perform a buffer analysis for a 3 km radius around the 2008-2013 forest fire point location. First go to the 2008-2013 layer and click on the Action button. In the drop-down menu, click the Create Buffer option.
Dive into biodiversity conservation with our step-by-step guide! Learn how to utilize the clip tool and create grids for precise mapping, empowering effective conservation strategies in ‘Biodiversity Conservation: Step-by-Step Guide to Clip Polygon for Effective Maps‘.
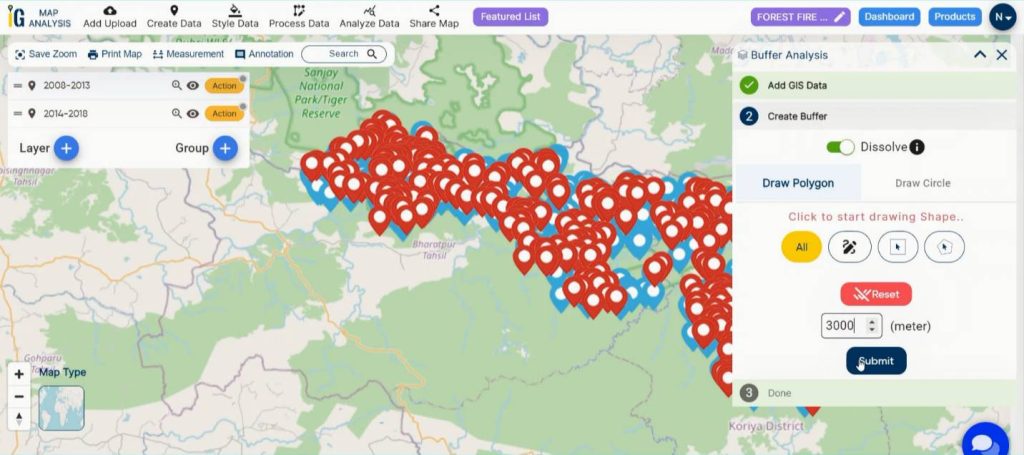
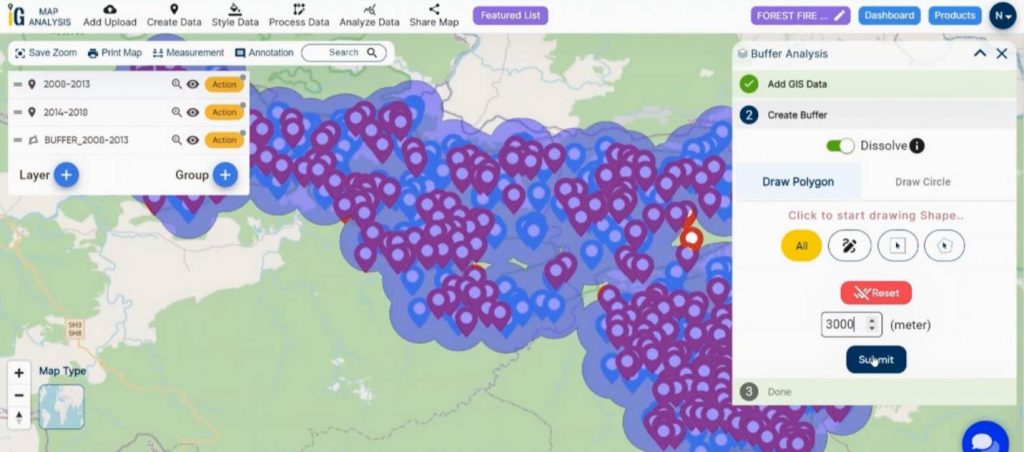
A dialogue box will open on the right side of the canvas. Select all points, turn on the dissolve option to merge the overlapping buffers. Then set the buffer range as 3000 meters and click on submit.
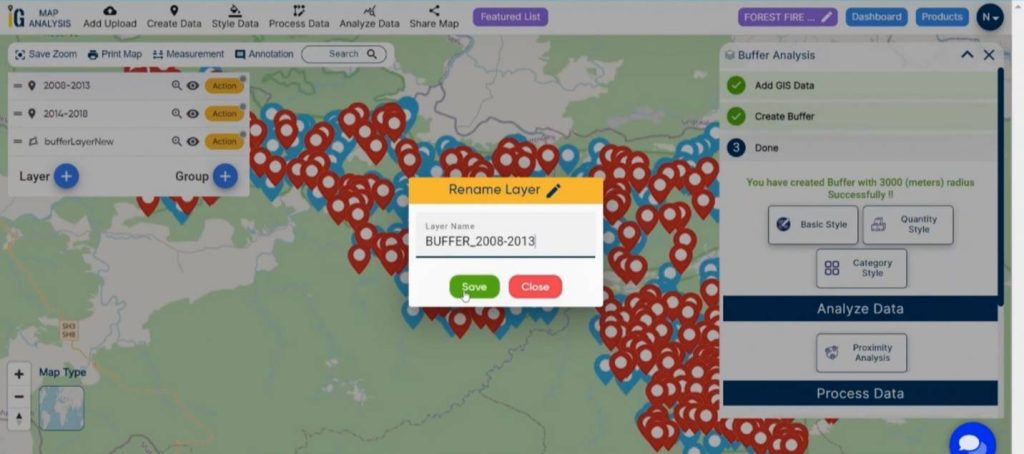
Go to the action button of that buffer layer and click on the Action button. Press the pencil icon to Rename the layer. Provide name and description and save it.
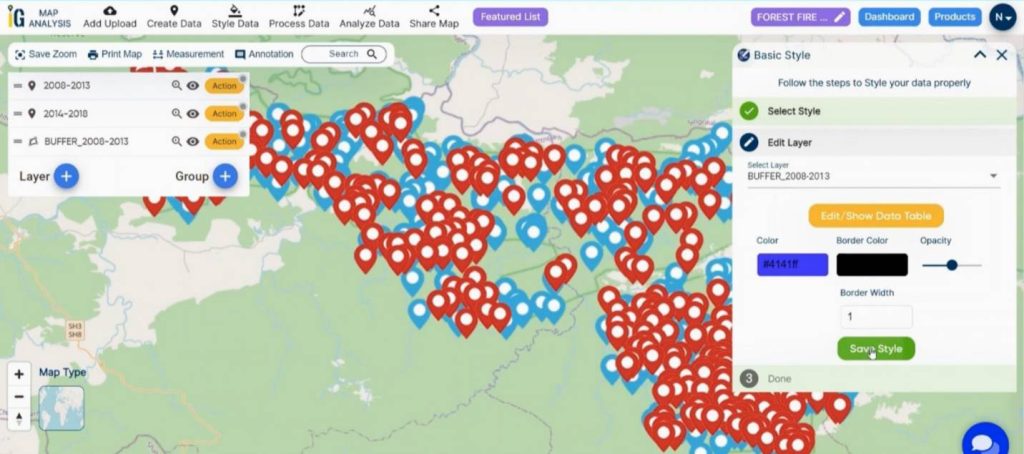
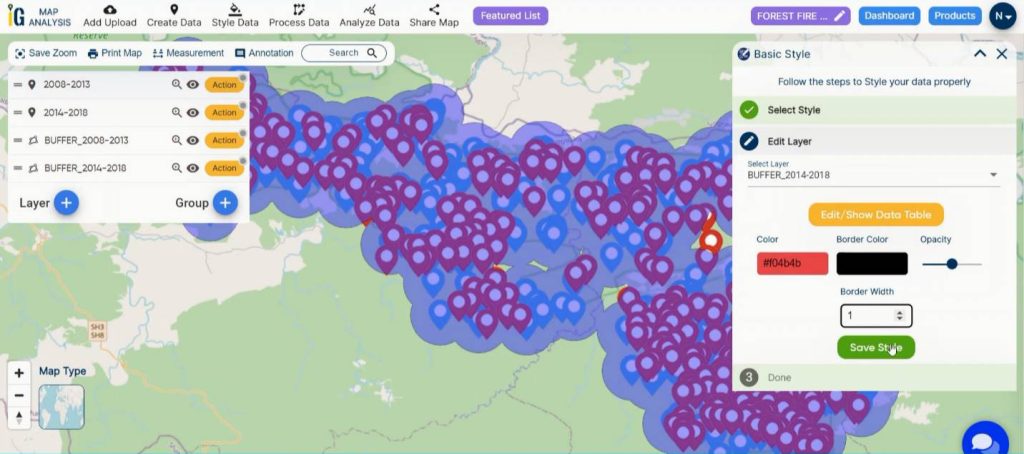
Select the basic style option from right side box and the layer to be published.
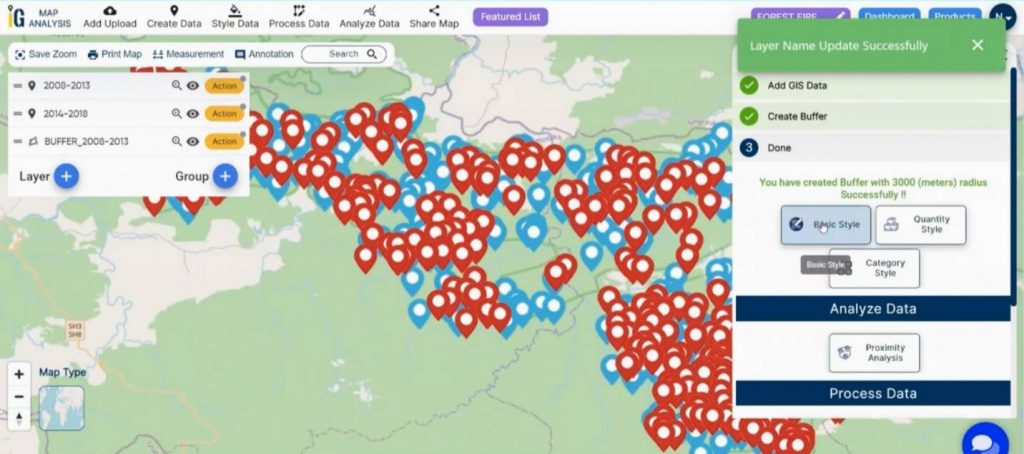
Select a color and border style and save style. This will help us visualize the potential areas of influence.
For a comprehensive analysis perform another buffer analysis for the 2014-2018 layer. Press the action button of this layer and click Create Buffer.

A dialogue box will open on the right side of the canvas. Select all points, turn on the dissolve option to merge the overlapping buffers. Then set the buffer range as 3000 meters and click on submit.
Rename the buffer layer as “BUFFER_2014-2018” by going through the same rename process.
change the color of the latest buffer layer to red for easy visual distinction & to differentiate between both layers.
Step 6: Results & Analysis
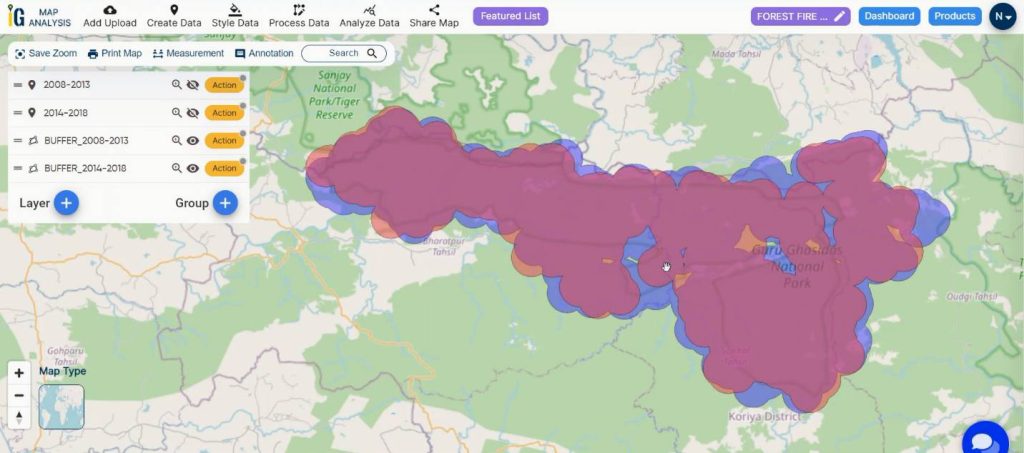
The blue areas indicate the 2008-2013 forest fire location and red area signifies the 2014-2018 forest fire location. Here we can see a large number of areas overlapping each other. The overlapping nature indicates that those areas are most likely to be the victim of forest fire or they are the deadliest fire prone areas in this decade. This comprehensive map is a powerful tool for Targeted Risk Mitigation, Early Detection and Rapid Response, Wildlife Conservation, Policy Formulation, Emergency Response Planning, Community Engagement and Education, Adaptive Management and more. Export it for impactful use. The thematic nature of this map is clearly providing the insightful details of the Forest Fire in those areas.
Discover ideal locations for your dream home with ease! By “Create a Map to find suitable sites for constructing a new house” learn how to use buffer zones to assess suitability and maximize potential for constructing a new house.
Major Findings
Response Time: Evaluation of the effectiveness of emergency response times and firefighting efforts.
Human-Wildlife Interaction: Understanding the potential impact of forest fires on wildlife habitats and migration routes.
Effectiveness of Prevention Measures: Assessment of the success of prevention measures, including controlled burns and firebreaks.
Domain & Industry
This map is a powerful tool for Risk Assessment and Mitigation, Ecological Impact Assessment, Community Engagement and Education, Policy Formulation and beyond.
Conclusion
I’ve found that utilizing MAPOG’s Buffer analysis tool has been pivotal in uncovering these spatial patterns and revealing essential insights for our research. GIS is a valuable tool in analyzing forest fires in mangrove region, aiding in targeted interventions, wildlife conservation, policy decisions, and efficient emergency responses, ensuring a balanced coexistence between forest and wildlife.
HERE ARE SOME ANOTHER BLOGS YOU MIGHT BE INTERESTED IN
- Create Map, and Analyze: Optimizing Bank Branch Locations
- Precision Agriculture: Using GIS Buffer Zones for Eco-Friendly Fertilizer Management
- Fast Emergency Response: Using GIS and Isochrone Maps for 10-Minute Ambulance Arrival
- Mapping Tiger Attack Hotspots – Create an Online Map and Share
- Creating Travel Guides: Mapping with GIS Buffer Zones
- Mapping Healthcare Efficiency: GIS Buffer Analysis of Hospital Locations
- Add WMS- Two step online view of WMS layer on a map
- Plot ATM locations on a map and embed on your website
- Map habitat locations of endangered animals & keep track of their living