Welcome to our exploration of optimizing bank branch locations using MAPOG‘s map analysis tool. In this article, we’ll dive into the straightforward process of selecting the best locations for bank branches. By harnessing the power of MAPOG, we aim to simplify the decision-making process, ensuring easy access to banking services for all. Join us as we uncover practical insights into enhancing the banking experience through strategic branch placement.
Key Concept:
The central idea revolves around how MAPOG‘s versatile toolkit, including the buffer tool, serves to optimize the selection of bank branch locations. Additionally, MAPOG offers a range of tools beyond bank branch optimization, such as digitalization, isochrones, route compass, urban planning, merging tools, Agriculture and environmental protection. Within the scope of bank branch optimization, the buffer tool is particularly crucial. It aids in evaluating spatial relationships and coverage patterns within the banking sector, ensuring strategic placement of branches. Leveraging MAPOG‘s diverse capabilities enables banks to improve decision-making processes, streamline operations, and effectively tackle challenges within the banking sector.
Step-by-Step Process:
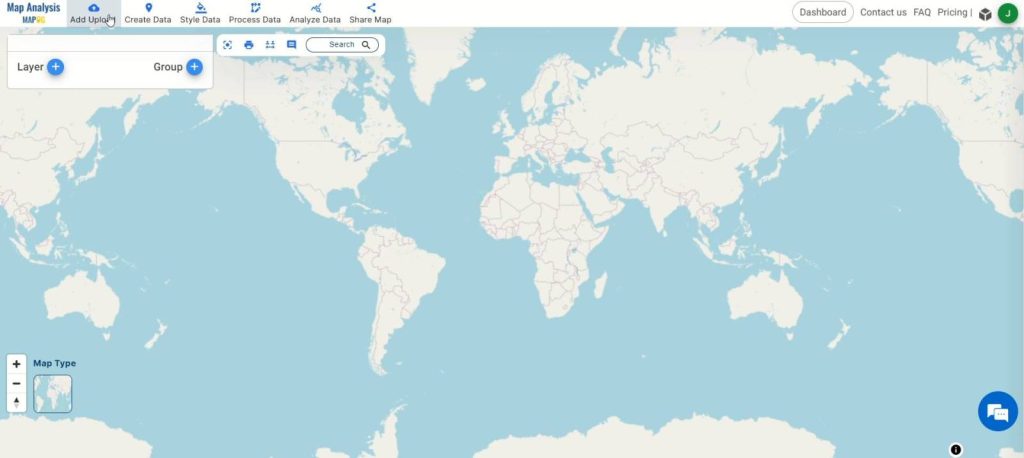
Step 1: Access MAPOG’s Map Analysis Tool: Begin by accessing MAPOG‘s map analysis tool, providing a user-friendly interface for conducting spatial analysis.
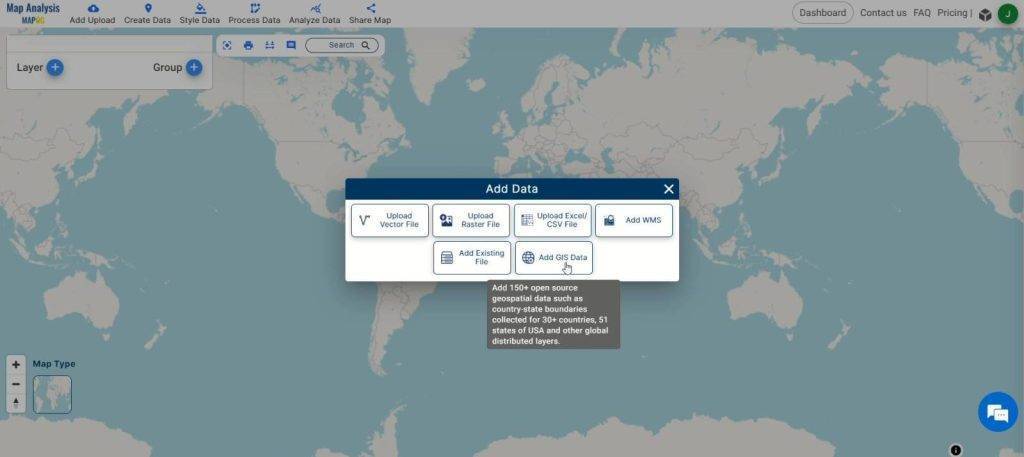
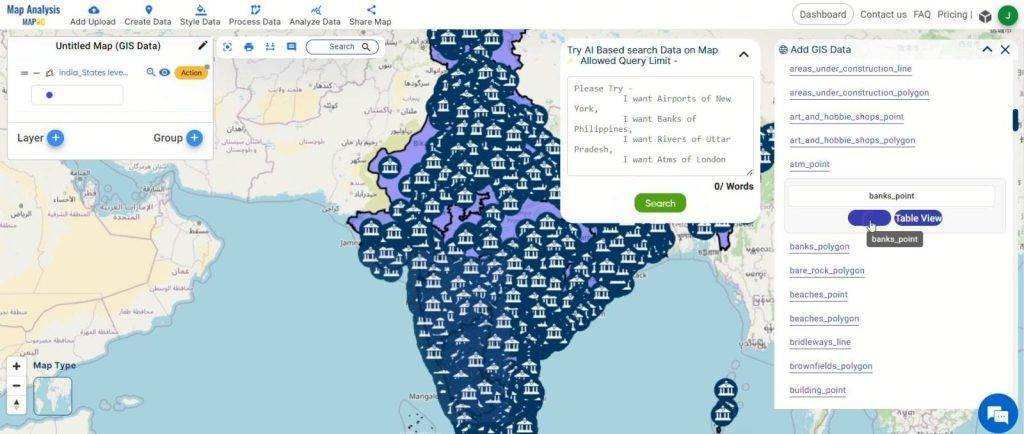
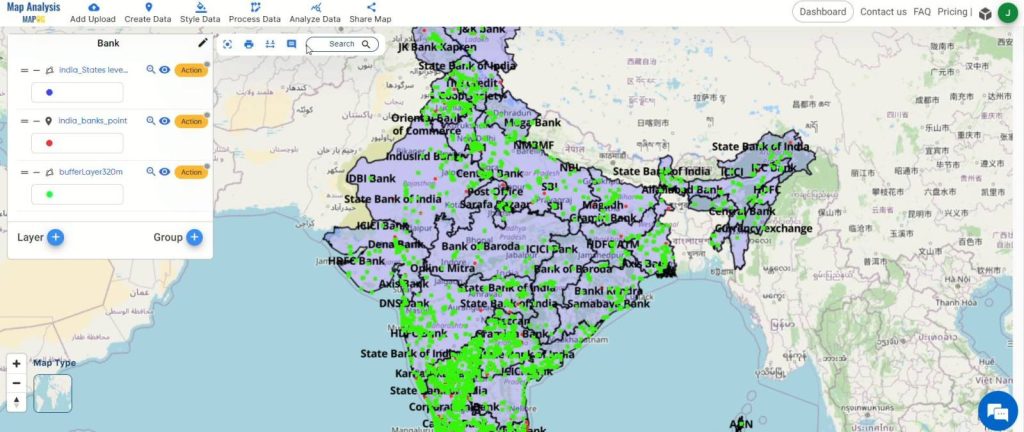
Step 2: Add GIS Data: Click on “Add Upload” and select “Add GIS Data” to input relevant datasets, including bank branch locations, administrative boundaries, and any other pertinent spatial data.
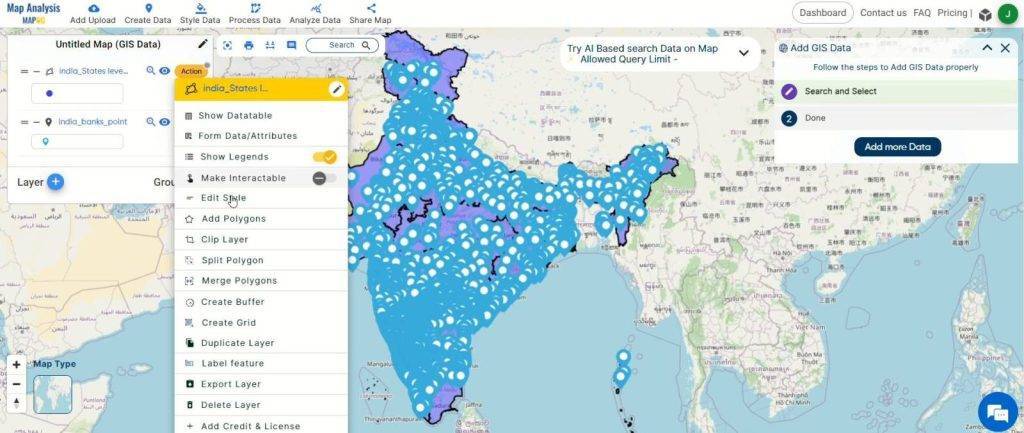
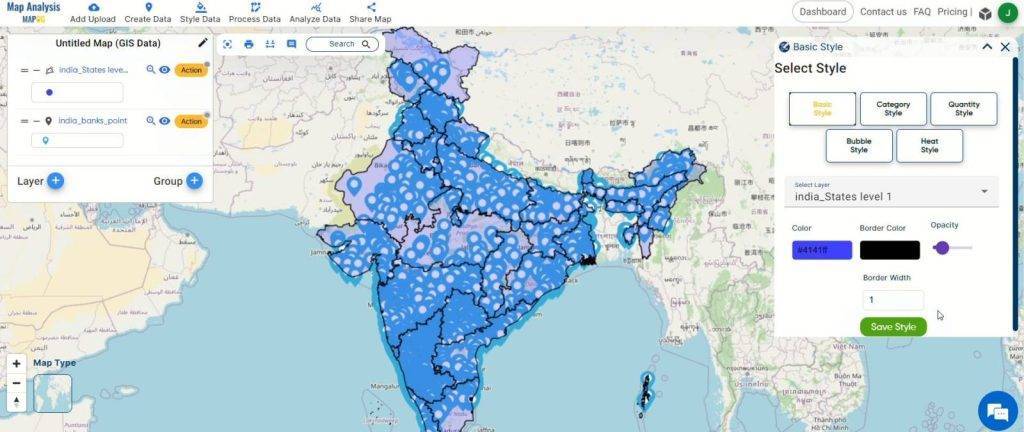
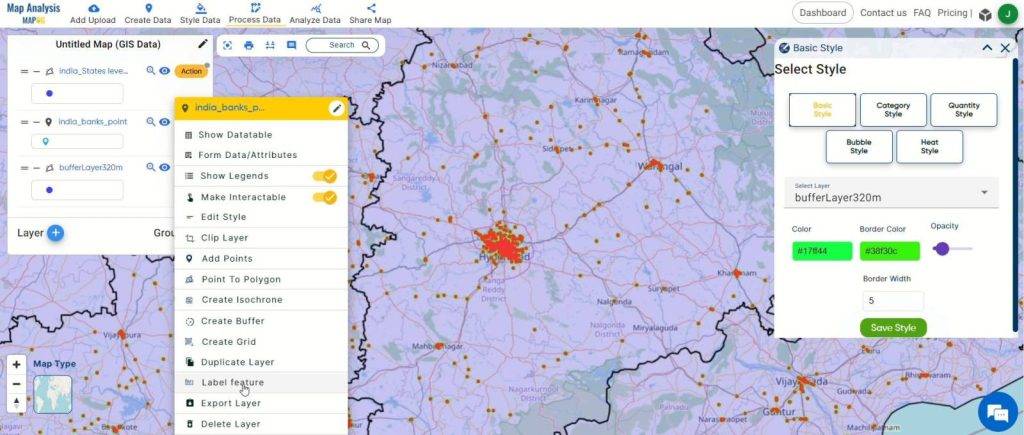
Step 3: Customize Style: Refine the visual representation of the datasets by clicking on the action button and selecting “Edit Style.” Tailor the appearance to improve clarity and facilitate analysis.
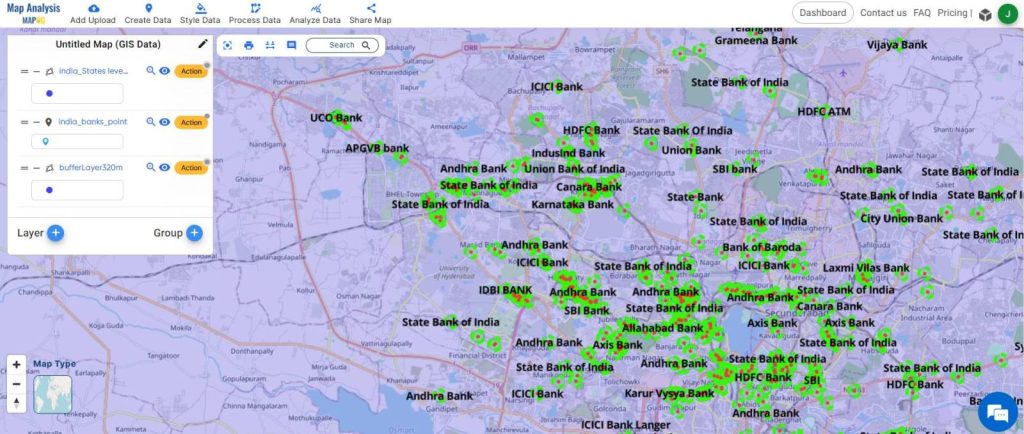
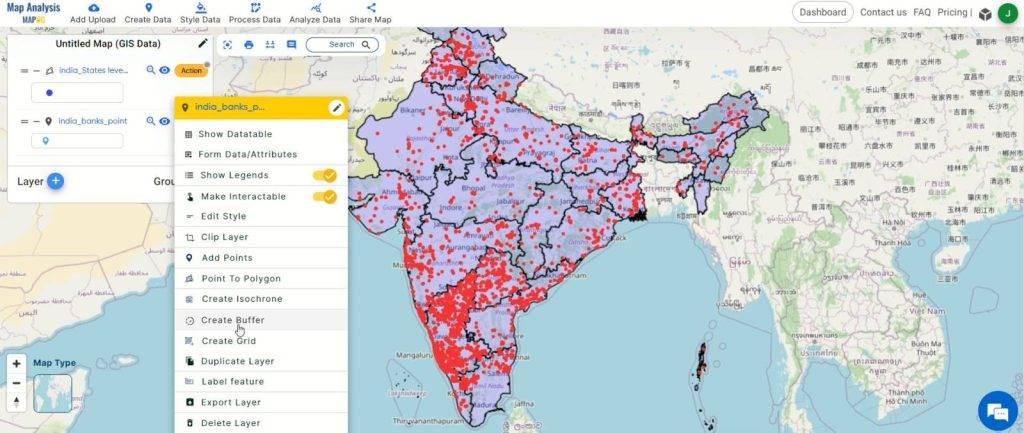
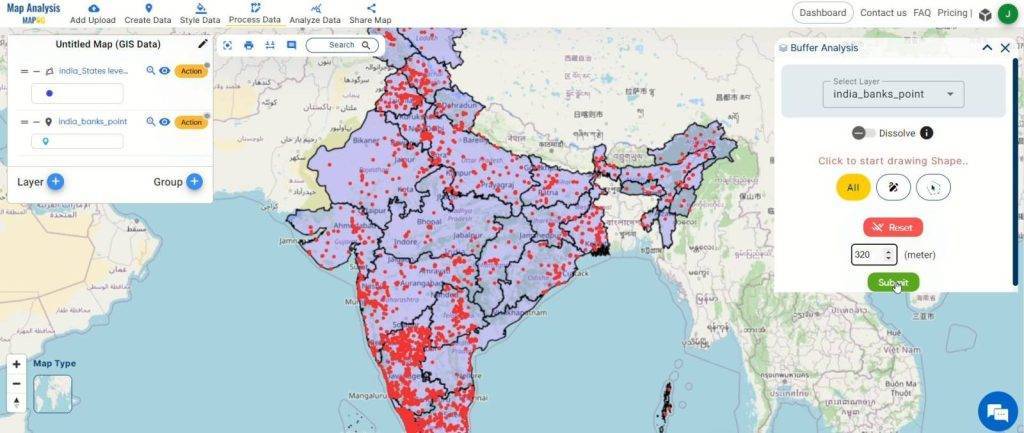
Step 4: Create Buffers: Utilize the buffer tool to assess spatial relationships around existing bank branch points. Generate buffers with a suitable radius, such as 320 meters, to evaluate coverage patterns and accessibility within the banking landscape.
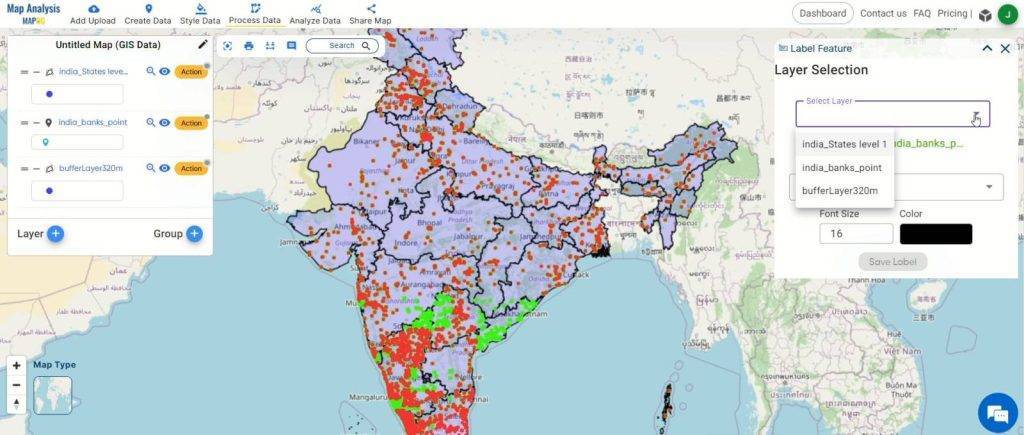
Step 5: Label Key Points: Enhance understanding by labeling key points within the dataset. Click the action button on the desired layer, select ‘Label Feature,’ and apply labels to important locations such as existing bank branches.
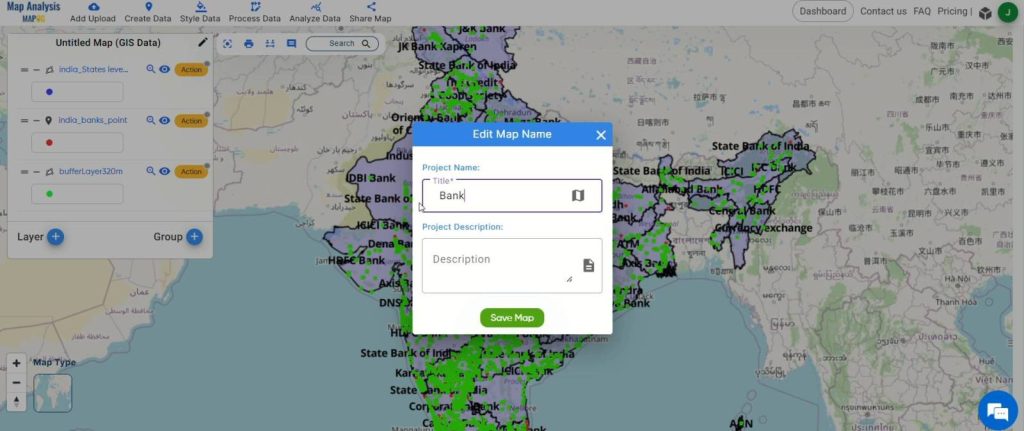
Step 6: Finalize and Save: Click on the pencil icon to rename the map if desired. Then, click “Save Map” to apply the changes and keep your data organized.
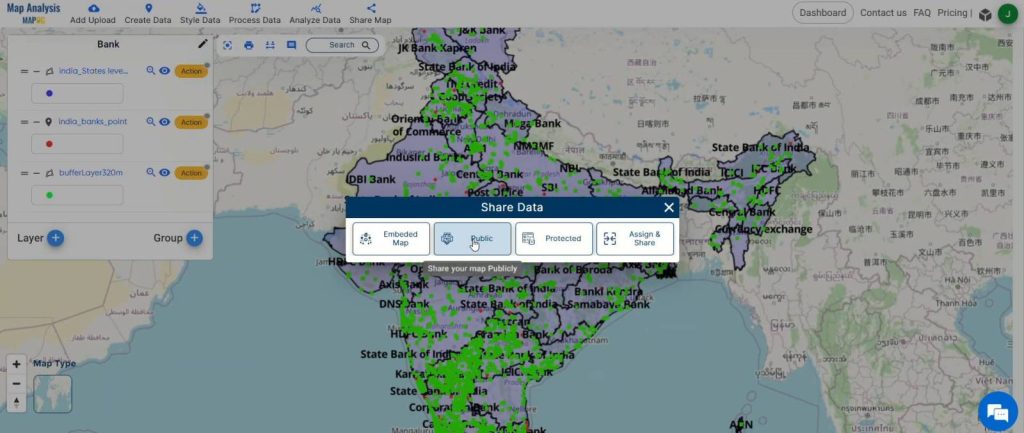
Step 7: Share Findings Share the analysis findings with stakeholders to facilitate collaboration and decision-making processes.
Major Findings:
The major findings, facilitated by the utilization of MAPOG, encompass a comprehensive understanding of optimal bank branch locations based on accessibility, market potential, and operational efficiency. Analysis of coverage patterns identifies areas for targeted expansion to address gaps in service provision. Demographic insights inform decisions on branch placement to effectively target specific customer segments. Market reach assessments evaluate penetration and competition, guiding strategic positioning. Operational efficiency improvements stem from streamlined branch networks and resource allocation. Enhanced customer accessibility results from identifying underserved communities for branch establishment. Ultimately, these findings empower banks with actionable data for informed decision-making and a competitive edge in the market, all made possible through the use of MAPOG.
Domains and Industries Benefiting
- Banking and Financial Services
- Retail and Commercial Real Estate
- Urban Planning and Development
- Government and Public Services
- Marketing and Advertising
- Environmental Conservation
- Transportation and Logistics
- Healthcare
Conclusion
In conclusion, the utilization of MAPOG‘s spatial analysis tools offers invaluable insights and benefits across various domains and industries. From optimizing bank branch locations to enhancing environmental conservation efforts, MAPOG enables informed decision-making, improved operational efficiency, and better service delivery. With its diverse applications and user-friendly interface, MAPOG empowers organizations to leverage spatial data effectively for strategic planning, resource allocation, and competitive advantage. For further inquiries or assistance, please contact us at support@mapog.com. As industries continue to evolve, MAPOG remains a valuable asset, driving innovation and progress through spatial analysis and visualization.
Other Articles
- Create a Map to find suitable sites for constructing a new house
- Create Map for Analyzing Water Quality using Heat Map Style
- Create Map – School Map Area Coverage Through Buffer Analysis
- Mapping Safety Create GIS Map : Game-Changing Approach to Hospital Risk Analysis
- Create Map for Real Estate Developer for Best Site Selection
- Create Map for Landfill Optimization: Spatial Analysis Approach