Water, the elixir of life, sustains ecosystems, nourishes communities, and fuels economies worldwide. However, in the face of increasing demands and environmental pressures, the assurance of water quality rises as a critical priority. In this context, MAPOG offers a powerful tool for create map for analyzing water quality using heat map style. This aids in visualizing spatial data related to water quality, leading to more informed decision-making and better management practices.
Key concepts – Create Map for Analyzing Water Quality
By using the Heat Map Style tool in MAPOG we can create visual representation of spatial distribution of water quality parameters. By employing color gradients, these maps provide visual cues that aid in identifying areas of concern, such as pollution hotspots, sources of contamination, and regions with optimal water quality conditions.
Step-by Step Guide for Creating Map for Analyzing Water Quality
Follow the step below for Creating Map for Analyzing Water Quality
Step 1: Open Map Analysis
Open Map analysis interface from MAPOG platform
Step 2: Upload Data
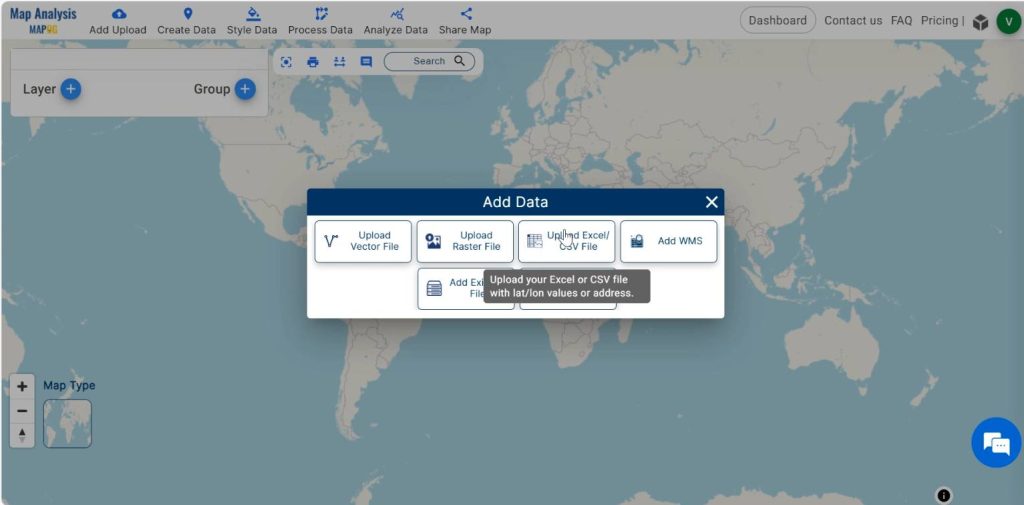
Click on Add upload in the header. Select Upload Excel/CSV file option.
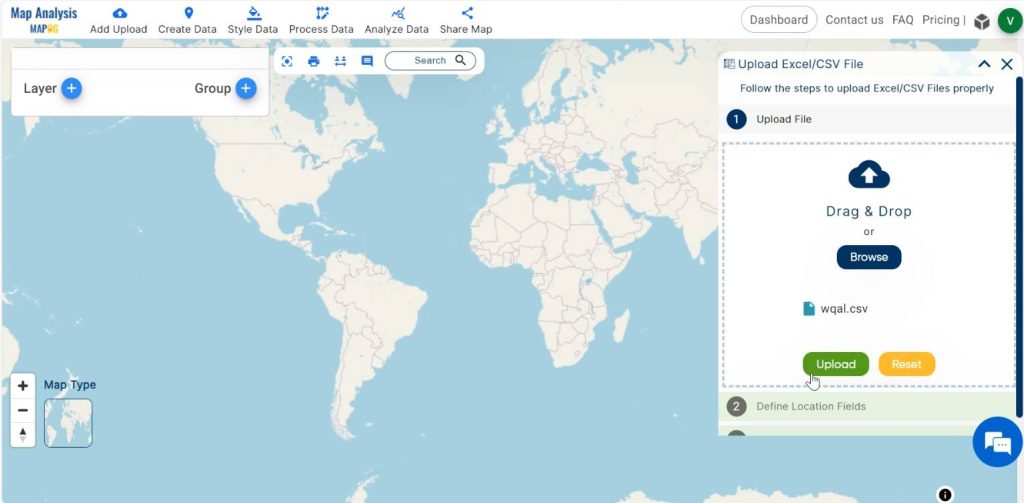
Browse your file and upload it.
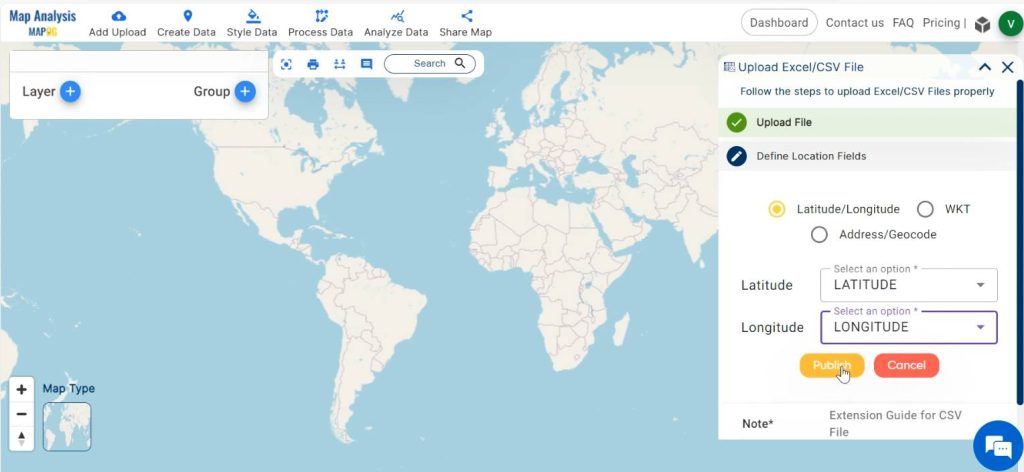
In the latitude and longitude option in “define location fields”, respectively select the title of columns having latitude and longitude data in your uploaded file and click on “Publish”.
Now, the CSV file appears in the layer and map.
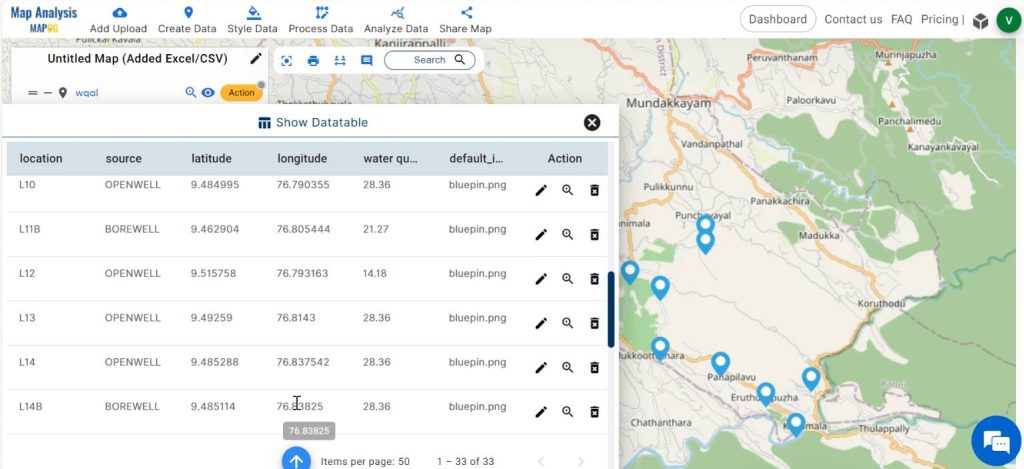
Step 3: View Datatable
You can see the data table by clicking on the “Action” option near the layer and then going to the “Show datatable” option.
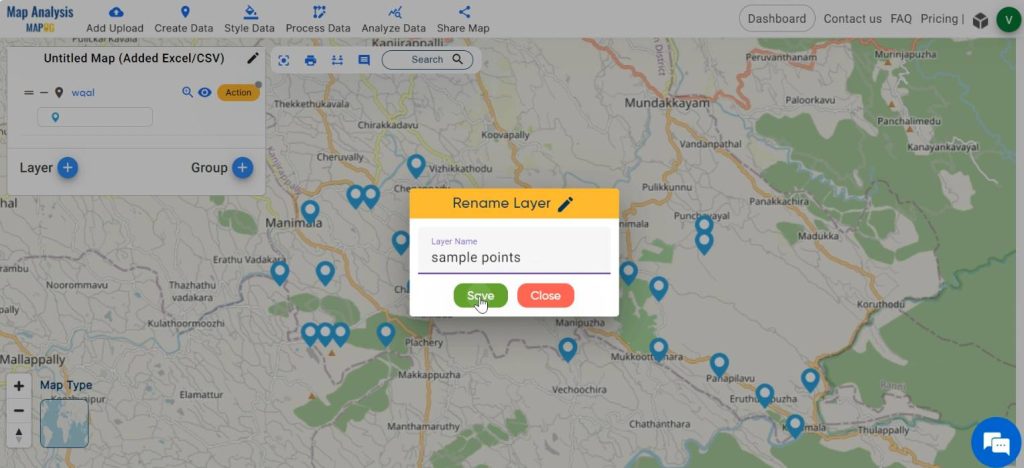
Step 4: Rename Layer
Rename the layer with a suitable name by clicking on “Action” and then the pencil icon seen near the name of the layer. Click on Save.
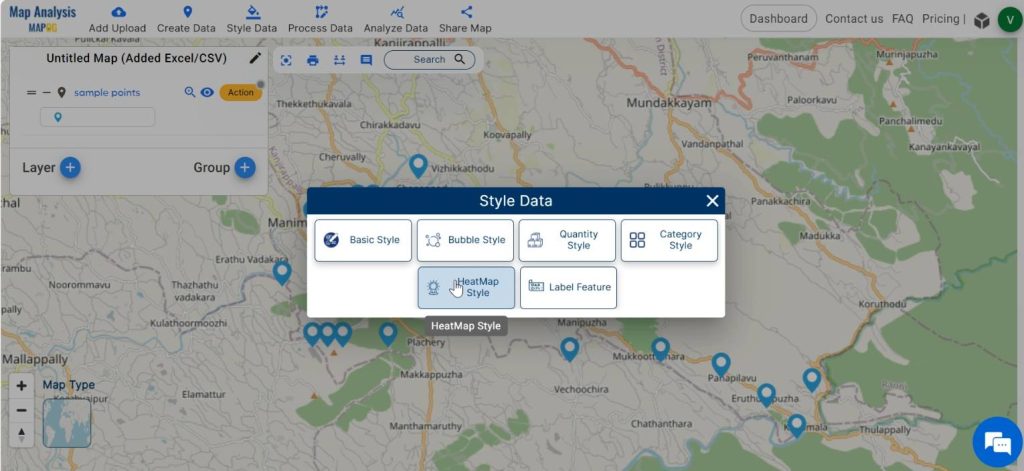
Step 5: Heat map Styling
Click on the Style Data option in the header, select Heat map style.
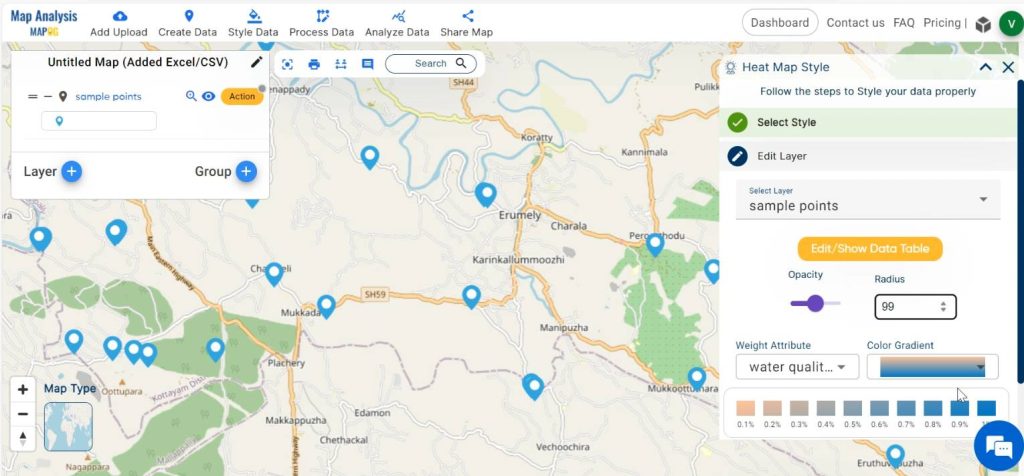
Select the desired layer from options. After Select the attribute to which the style has to be applied. Select suitable color gradient and radius. Click on Save style.
Step 6: Save Map
Finally, save your map by simply clicking on the pencil icon located next to the ‘Untitled Map’ text. In the dialog box that appears, enter appropriate names and descriptions. Then, click on the Save Map option.
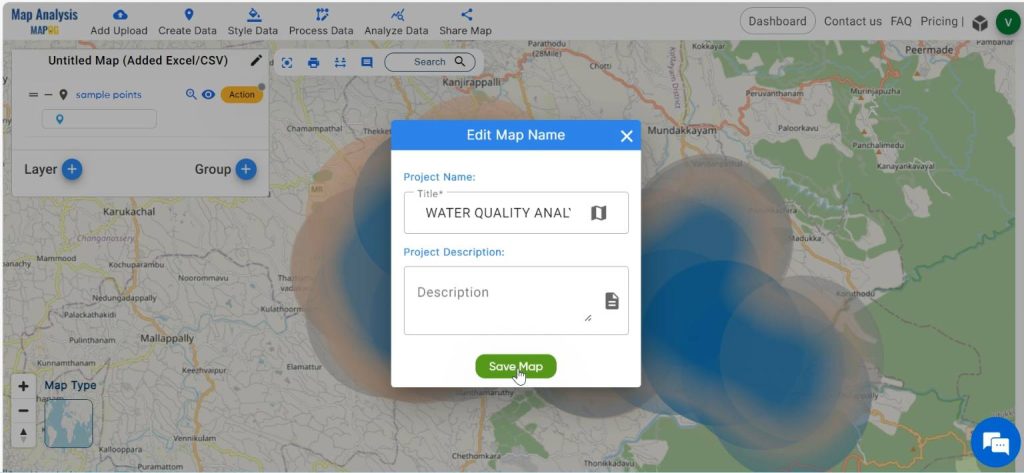
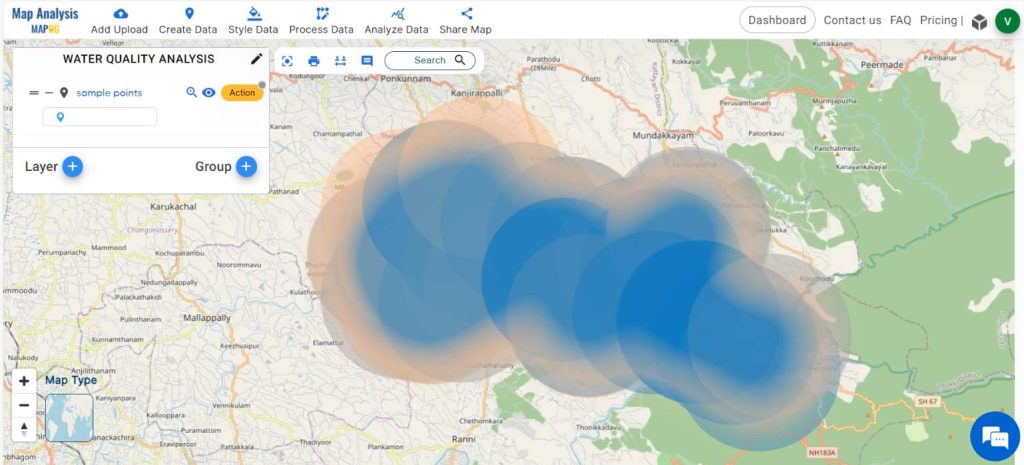
Now we have got a map showing spatial distribution of water quality.

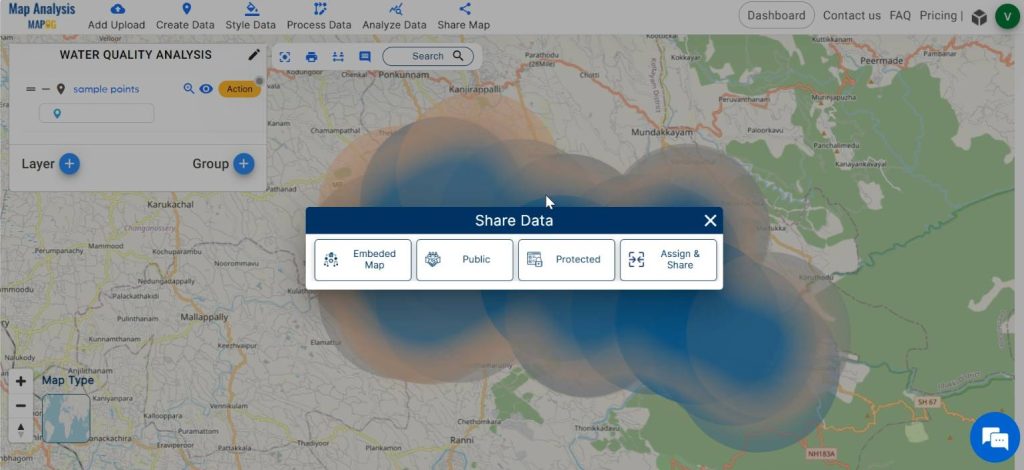
Step 7: Share Map
Share the map with your friends or post it on social media using the Share tool.
Major Findings– Create Map for Analyzing Water Quality
The major findings obtained by using heat map style tool in MAPOG is as follows:
- Spatial patterns: Identification of spatial patterns in water quality parameters across water bodies.
- Detection of Hotspots: Detection of hotspots or areas with elevated levels of specific water quality parameters, indicating potential pollution sources or areas requiring targeted management interventions.
- Decision Support: Information gained from the analysis facilitates informed decision-making for water resource management, pollution control, habitat conservation, and environmental policy.
- Stakeholder Engagement: These maps obtained from the analysis helps to provide water quality information to stakeholders, fostering greater awareness and engagement in environmental management initiatives.
In summary, water quality analysis using MAPOG is effective in enhancing water quality analysis, facilitating evidence-based decision-making, and promoting sustainable water resource management practices.
Domain and Industry–Create Map for Analyzing Water Quality
The beneficiaries of this analysis include:
1. Government Agencies: Helps to identify areas with poor water quality and prioritise resource allocation for remediation efforts.
2. Public Health Officials: Health departments can use the information to issue advisories or warnings to communities living in areas with compromised water quality.
3. Water Utilities: Water treatment facilities and utilities can adjust their treatment processes or implement targeted interventions to ensure that water provided to consumers meets quality standards.
4. Community Members: Residents living in areas identified as having poor water quality can take necessary precautions, to protect themselves from potential health risks.
5. Environmental Organizations: Non-governmental organizations focused on conservation and environmental advocacy can use the data to raise awareness about water pollution issues and advocate for policy changes or community initiatives aimed at improving water quality.
Conclusion– Create Map for Analyzing Water Quality
In conclusion, MAPOG platform offers a powerful approach for analyzing water quality parameters. By identifying spatial patterns, hotspots, MAPOG supports informed decision-making for water resource management. Moreover, the visualization of complex data enhances stakeholder engagement, ultimately contributing to more effective environmental policies and sustainable water management practices.
Other Articles
- Protecting Wetlands: Guide to Create GIS Map for Nature
- GIS Analysis in Urban Planning: Reshaping Transportation Future Insights of state/city
- Fast Emergency Response: Using GIS and Isochrone Maps for 10-Minute Ambulance Arrival
- Mapping Tiger Attack Hotspots – Create an Online Map and Share
- Make Routes for Military Aerial Planning- Through Bearing angle and Distance calculation – Online Route Compass
- Mapping Healthcare Efficiency: GIS Buffer Analysis of Hospital Locations
- Add WMS- Two step online view of WMS layer on a map
- Plot ATM locations on a map and embed on your website
- Map habitat locations of endangered animals & keep track of their living