Planning for highway extension and rehabilitation demands a meticulous approach to effective transportation infrastructure development. In this guide, we explore the utilization of MAPOG for a comprehensive examination of a highway extension and rehabilitation project, ensuring efficient development, maintenance, and improvement of transportation infrastructure. MAPOG caters to various use cases such as agriculture, route compass, urban planning, and buffer tools. Here, in this article we are creating Gis Mapped Highway extensions precision and effectiveness. It enable stakeholders to make informed decisions and streamline the planning.
Key Concept
The key concept revolves around employing spatial analysis tools, specifically MAPOG, to enhance the planning process for highway extension and rehabilitation projects. Spatial analysis involves scrutinizing geographical data to derive meaningful insights, aiding in informed decision-making. With MAPOG Map Analysis tool, users can efficiently add and process data, create buffer zones, and conduct proximity analyses, providing valuable spatial perspectives crucial for strategic highway planning. Additionally, the dataset required for this analysis is provided at the end of this guide, ensuring accessibility and practical application.
Gis Mapped Highway Extension
Steps are given below –
Adding Required Data for Analysis
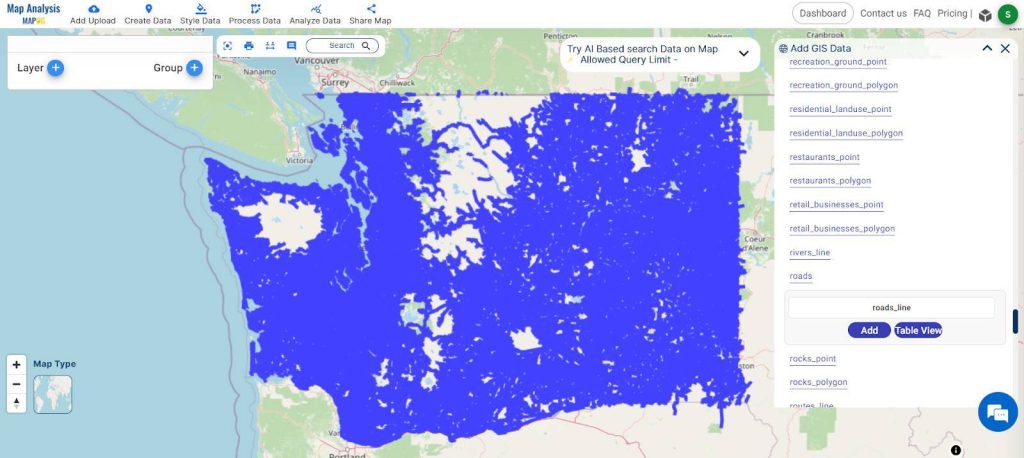
To comprehensively analyze highway extension and rehabilitation projects, it’s essential to leverage two types of data: line data and polygon data. In this context, I am employing highway data and building polygons data for the study.
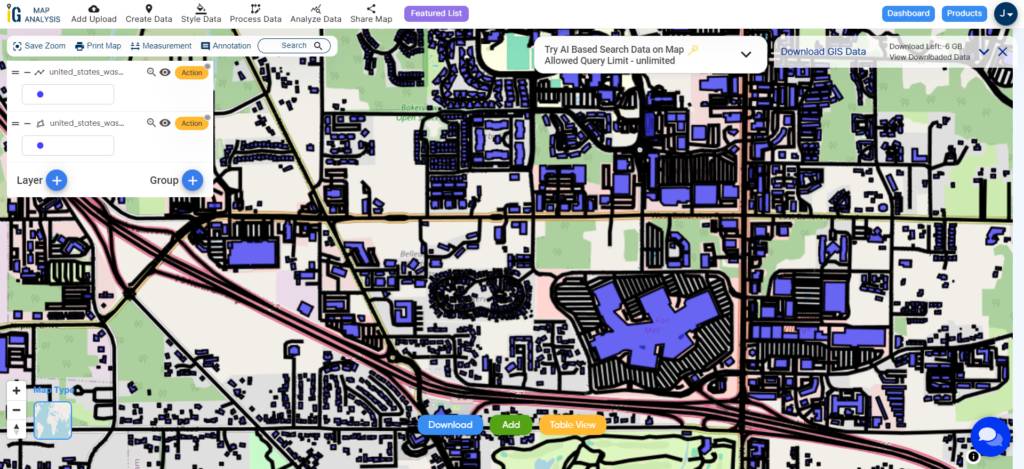
Highways are represented by Black-colored lines while building polygons are indicated by blue polygons.
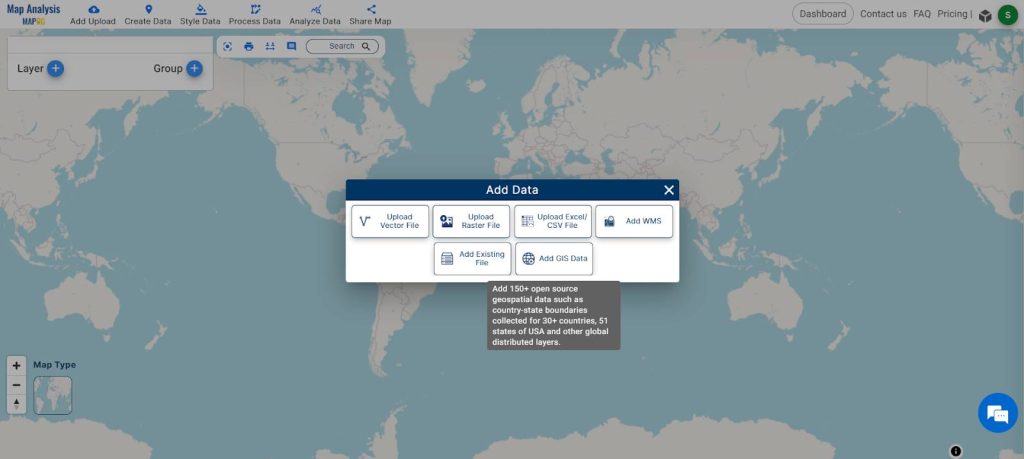
Steps 1. Access GIS Data Tool:
- Open Map Analysis interface. Then click on the “Add Upload” button in the upper left corner. A dialogue box will open. Click on “Add GIS Data” to upload the data.
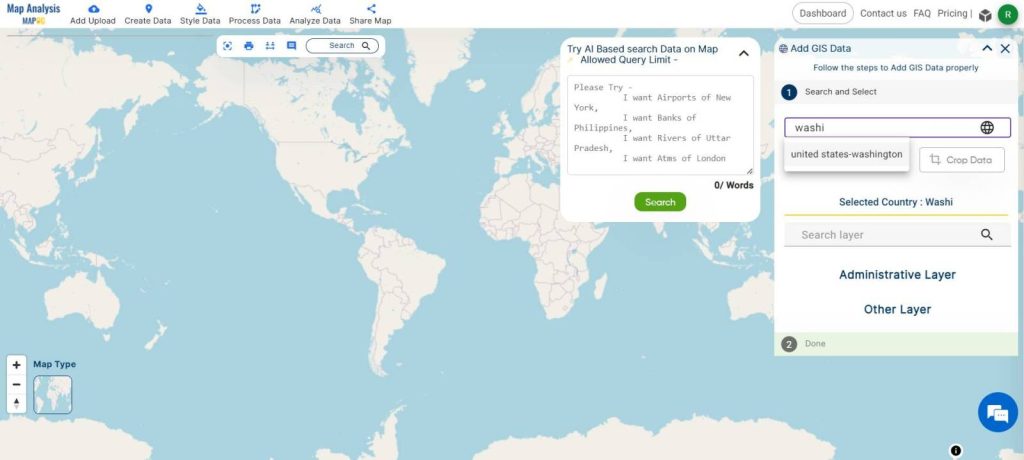
Steps 2. Select Country:
- Navigate to the country for which you want to conduct the analysis.
- A box will open on the right side of the screen, enter the country name and the region of interest. Then search for the required data. Click on it and select Add. Then, the layer will be added to the map and the layer will be visible on the left side of the screen.
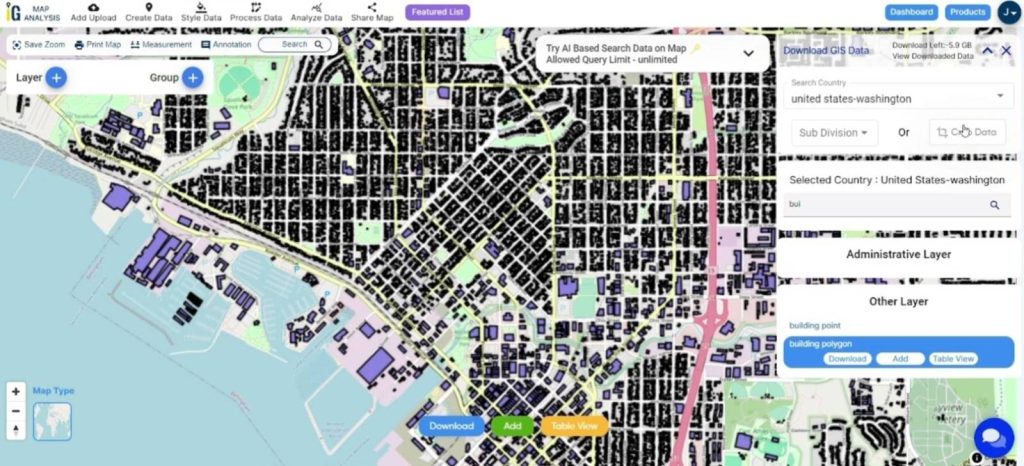
Step 3. Choose Data Layers:
- Locate and select the Highway Line data and Building Polygons data for analysis.
Step 4. Add Data Layers:
- Click the “ADD” button for both the Highway Line data and Building Polygons data. This adds the selected layers to your analysis.
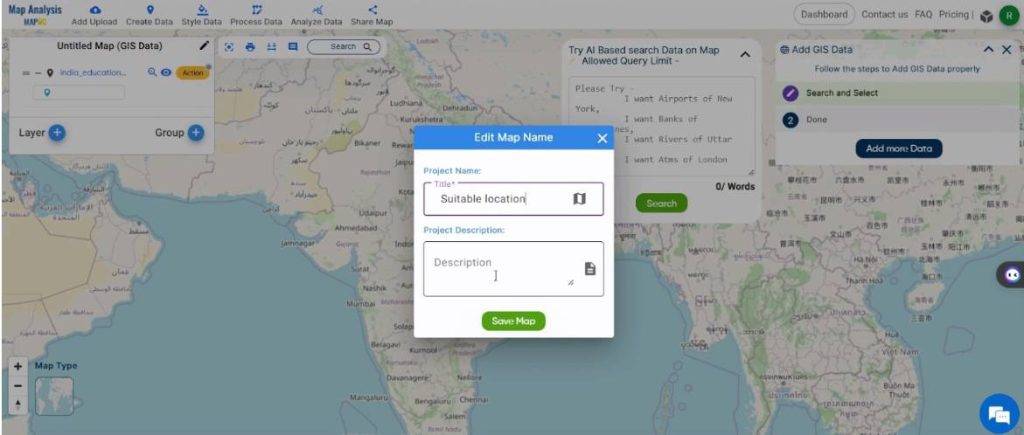
- Rename the map to a suitable name by clicking on the pencil icon on the top right corner of the box present on the left-hand side. Once the layer name is typed, select Save Map to implement the changes.
Step 5. Crop Tool:
- Look for the Crop tool, which is typically available in the top-right corner or within the action button.
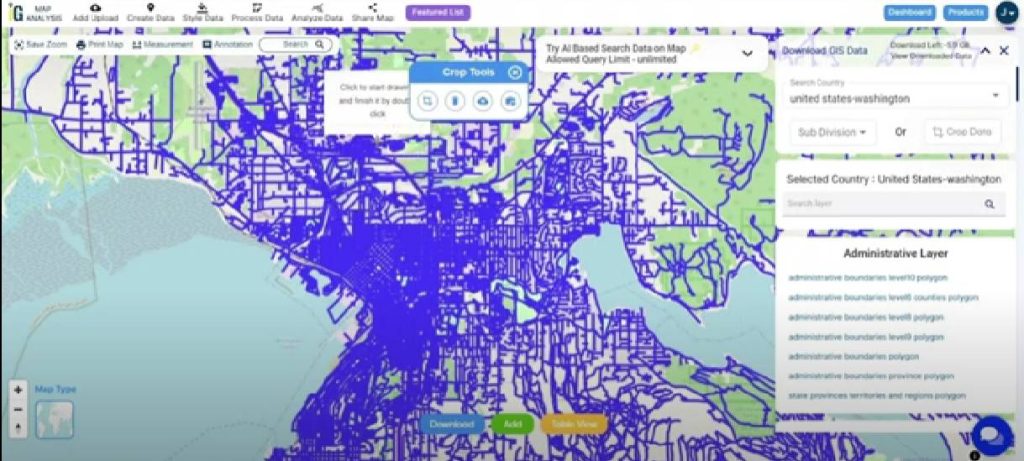
- Use the Crop tool to define and select specific areas of interest for analysis. This allows you to focus on particular regions or segments based on your requirements.
These steps provide a guide for users to efficiently set up and customize their GIS analysis by selecting relevant data layers and utilizing the crop tool for specific areas of interest. Moreover, MAPOG extends its versatility beyond various use cases such as agriculture, route compass, urban planning, and buffer tools
Creating Buffer Zone
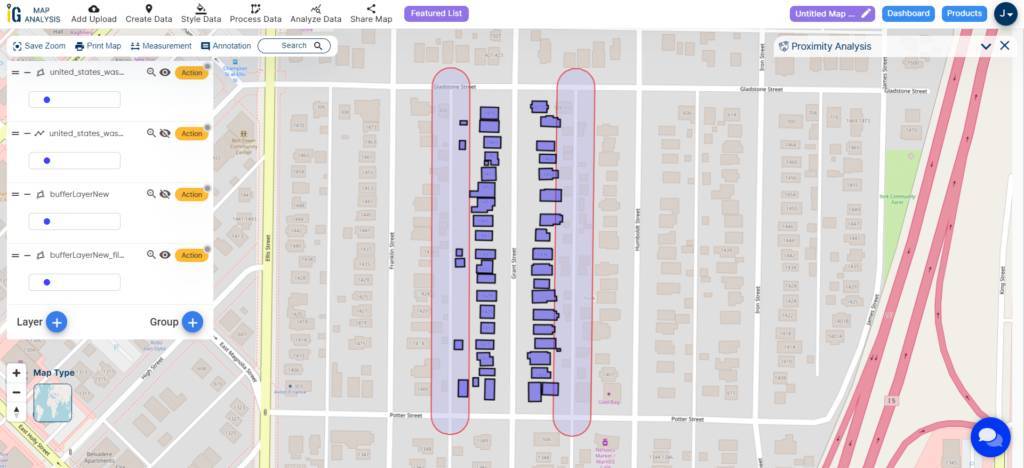
The next step involves generating a buffer zone of 15 meters for the highway line, extending the highway by 15 meters on both sides.
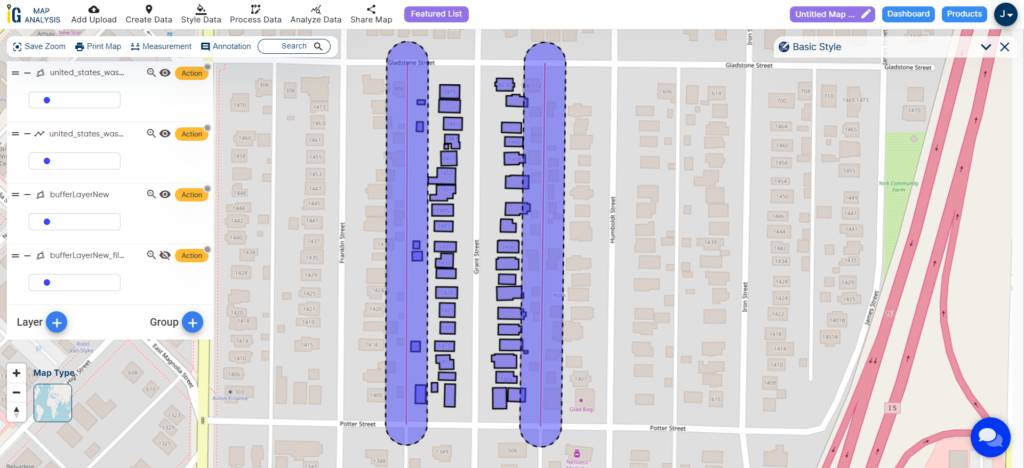
Upon inspecting the image, you can observe that the red line represents the actual size of the highway, while the blue-coloured image illustrates the 15-meter buffer zone that has been created.
Upon analyzing the buffer result, you can discern the potential impact of the highway extension on nearby buildings.
Steps
Step 6. Select Area of Study:
- After choosing the data layers and possibly cropping the area of interest, proceed to the designated area of study.
- Click on the action button associated with the Highway Data layer.
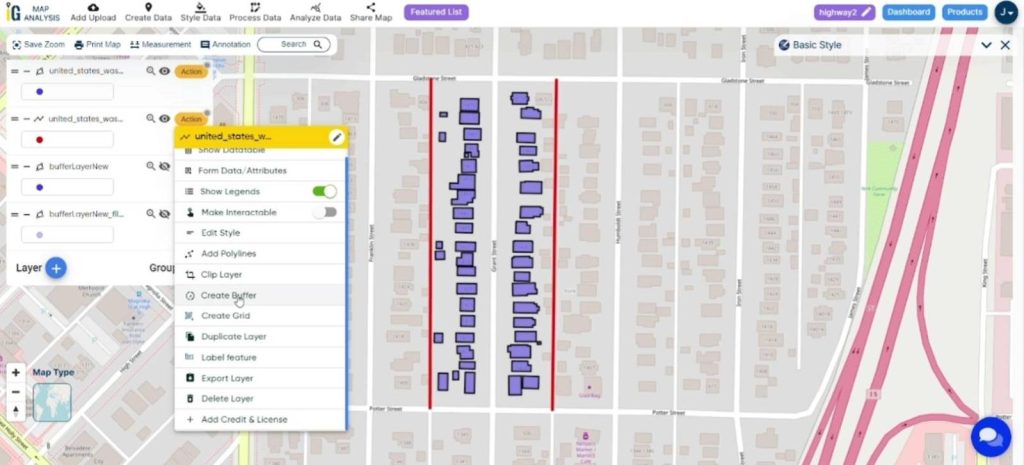
- Within the actions menu, locate and select the option to “Create Buffer.”
- Input the desired buffer zone distance, in this case, 15 meters. Assign the range value as 15.
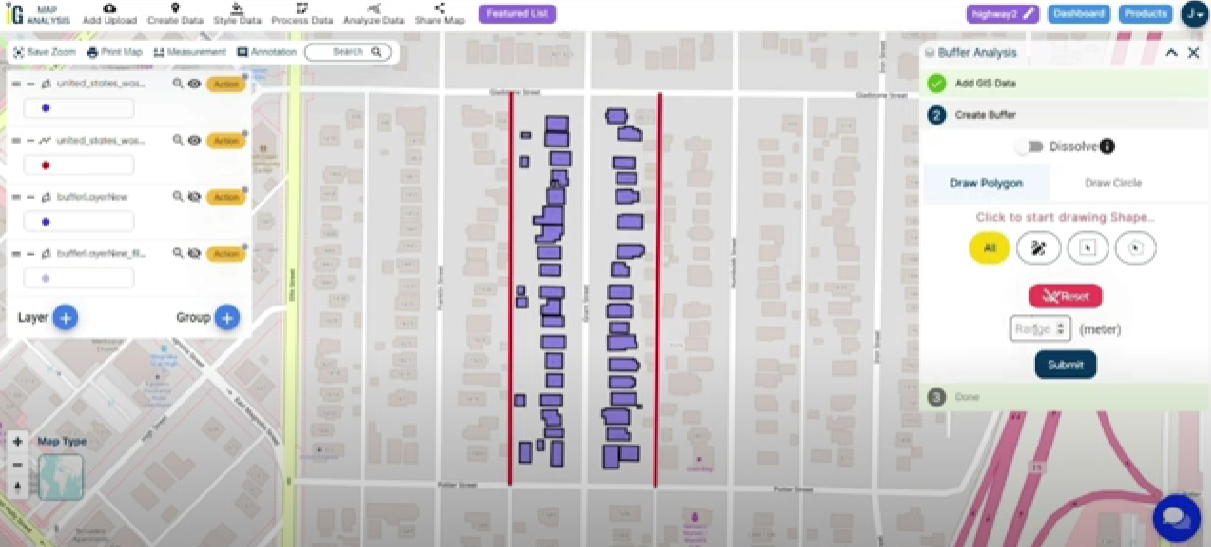
- Once you’ve set the buffer parameters, click the “Submit” button to initiate the creation of the 15-meter buffer zone around the highway data.
This process generates a buffer zone around the selected highway data, extending 15 meters from its boundaries. The buffer provides insights into the spatial impact and relationships with other features within that specified distance.
Proximity analysis
Proximity analysis is a geographic information system (GIS) technique that involves evaluating the spatial relationships and distances between different features or datasets.

Steps
Step 7. Access Analyze Data:
- Within your Map Analysis, locate and click on the “Analyze Data” option.
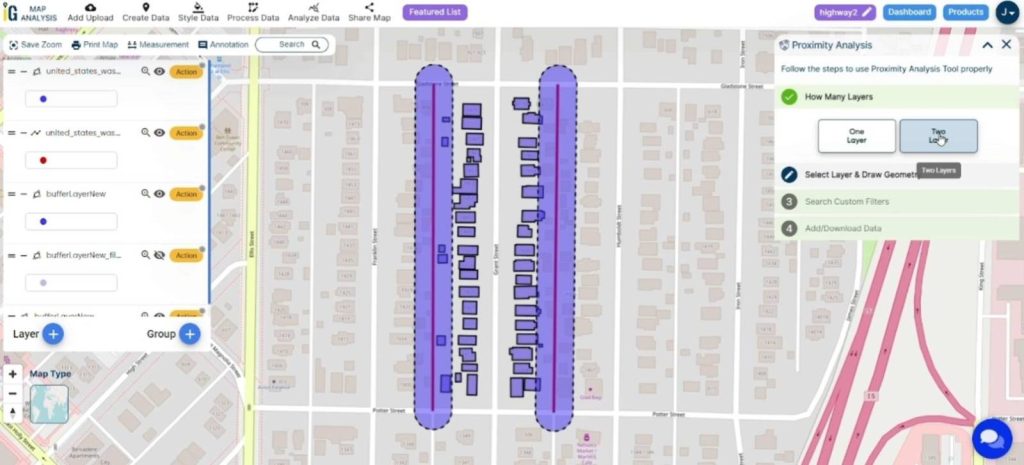
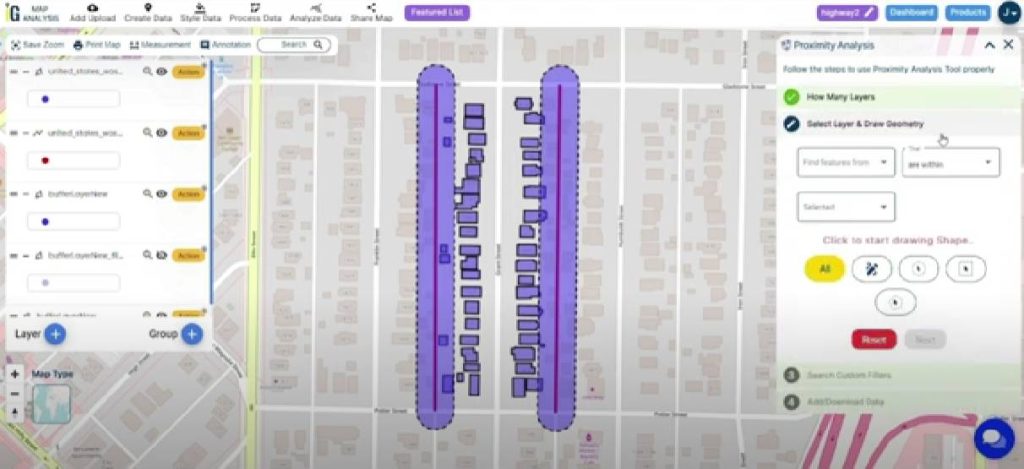
Step 8. Select Layer & Draw Geometry:
- Once in the analysis menu, choose the option to “Select Layer & Draw Geometry.” This likely involves choosing a specific layer or dataset for your analysis.
- Use the drawing tools to create a geometry or shape on the map. This could be a point, line, or polygon, depending on your analysis requirements.
Step 9. Search Custom Filter:
- After drawing the geometry, find and select the option for a “Custom Filter.” This allows you to define specific criteria for filtering data.
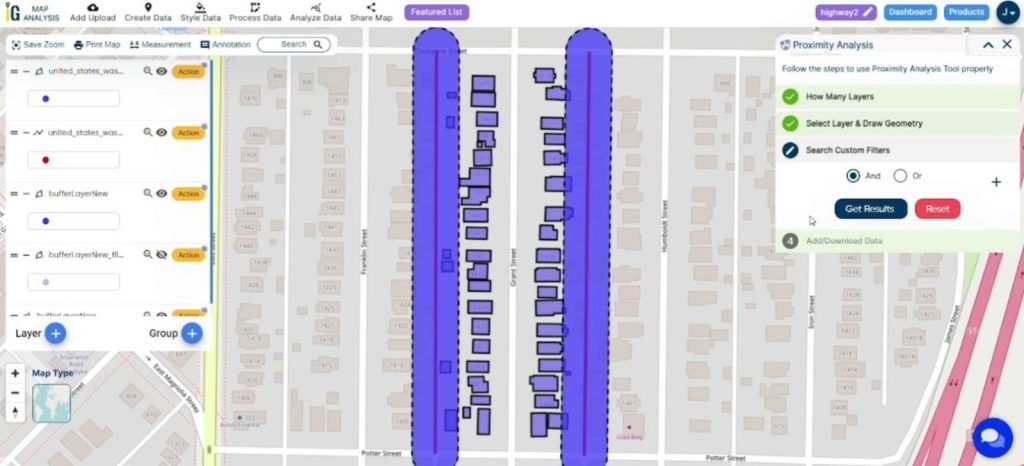
- Set up your custom filter by specifying criteria such as attribute values, spatial relationships, or other conditions based on your analysis objectives.
- Once the custom filter is configured, click on the “Get Results” or a similar button to initiate the analysis based on the defined criteria.
These steps allow you to perform a customized analysis by filtering data based on specific conditions. This capability is valuable for exploring patterns, isolating features of interest, and gaining insights tailored to your analytical goals.
Major Findings
By examining the results, you can grasp how to leverage MAPOG to understand the potential relocation and damage that may occur during a highway extension project. In this specific example, extending by 15 meters provides insights into which buildings will be affected, showcasing the fundamental capabilities of MAPOG with the available datasets and tools.

Domain and Industry
- Transportation and Infrastructure Development
- Construction and Engineering
- Urban Planning
- Public Safety and Emergency Services
- Research and Academia
- Government and Policy Making
- Environmental Impact Assessment
- Technology and Software Development
- Real Estate
Conclusion
In conclusion, the integration of MAPOG into the analysis of highway extension and rehabilitation projects proves to be a strategic approach for effective transportation infrastructure development. By following the outlined steps, users can efficiently process data, create buffers, and conduct proximity analyses. The insights gained through MAPOG‘s capabilities, coupled with spatial data, empower decision-makers in urban planning, construction, and public safety. This process facilitates informed decision-making, ensuring the thorough examination of highway projects. The availability of the dataset at the end of this article encourages further exploration and application in diverse geographical contexts, contributing to enhanced transportation systems and sustainable urban development. For inquiries, contact support@mapog.com. Explore the potential of MAPOG for comprehensive analyses in transportation and infrastructure planning.
GIS data links
Other Articles
- Protecting Wetlands: Guide to Create GIS Map for Nature
- GIS Analysis in Urban Planning: Reshaping Transportation Future Insights of state/city
- Fast Emergency Response: Using GIS and Isochrone Maps for 10-Minute Ambulance Arrival
- Mapping Tiger Attack Hotspots – Create an Online Map and Share
- Make Routes for Military Aerial Planning- Through Bearing angle and Distance calculation – Online Route Compass
- Mapping Healthcare Efficiency: GIS Buffer Analysis of Hospital Locations
- Add WMS- Two step online view of WMS layer on a map
- Plot ATM locations on a map and embed on your website
- Map habitat locations of endangered animals & keep track of their living
- Create Map on Literacy Rate
- Create Map – DIGITIZING SOLAR, HYDROELECTRIC, WIND AND BIOMASS POWER PLANTS – RENEWABLE ENERGY
- Create a Map to find suitable sites for constructing a new house
- Create Map for Analyzing Water Quality using Heat Map Style
- Create Map – School Map Area Coverage Through Buffer Analysis
- Mapping Safety Create GIS Map : Game-Changing Approach to Hospital Risk Analysis
- Create Map for Real Estate Developer for Best Site Selection
- Create Map for Landfill Optimization: Spatial Analysis Approach
- Create Off-Road Hiking Routes: Using Bearing Angles and Distances
- Creating Safe Routes for Armies and Rescue Teams
2 thoughts on “Mapping highway Buffer and Building Overlap Analysis – Extend Roads Width”