“Biodiversity Conservation: Step-by-Step Guide to Clip Polygon for Effective Maps” revolutionizing biodiversity preservation with ease. By partitioning protected areas into smaller, manageable sections, MAPOG facilitates efficient monitoring and conservation efforts. This innovative approach of GIS mapping in Biodiversity maximizes resources, enhances data accuracy, and ensures the long-term sustainability of vital ecosystems.
Key Concepts to create Biodiversity Conservation: Step-by-Step Guide to Clip Polygon for Effective Maps
Our goal is to divide the protected area into smaller, manageable sections. This map’s thematic structure is undoubtedly what gives it it’s fascinating details. Join us as we walk you through the process of making this effective map on the MAPOG. Let’s get started!
Dive into the world of biosphere reserves with our “Create Biosphere Reserves Map: Iconic Fauna Representation with GIS“! Discover how utilizing GIS to create point data enhances conservation efforts and promotes biodiversity within these vital ecosystems.
Steps to create Biodiversity Conservation: Step-by-Step Guide to Clip Polygon for Effective Maps
Step 1: Add GIS Data
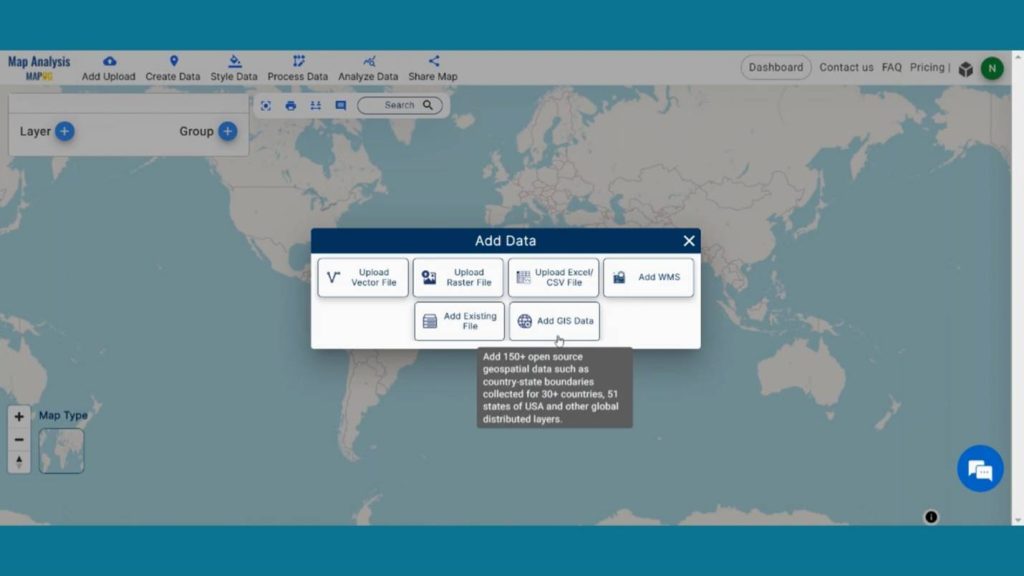
First, navigate to the Map Analysis interface. Then click on the “Add upload” button in the upper left corner. A dialogue box will open. Click on “Add GIS Data” to add data.
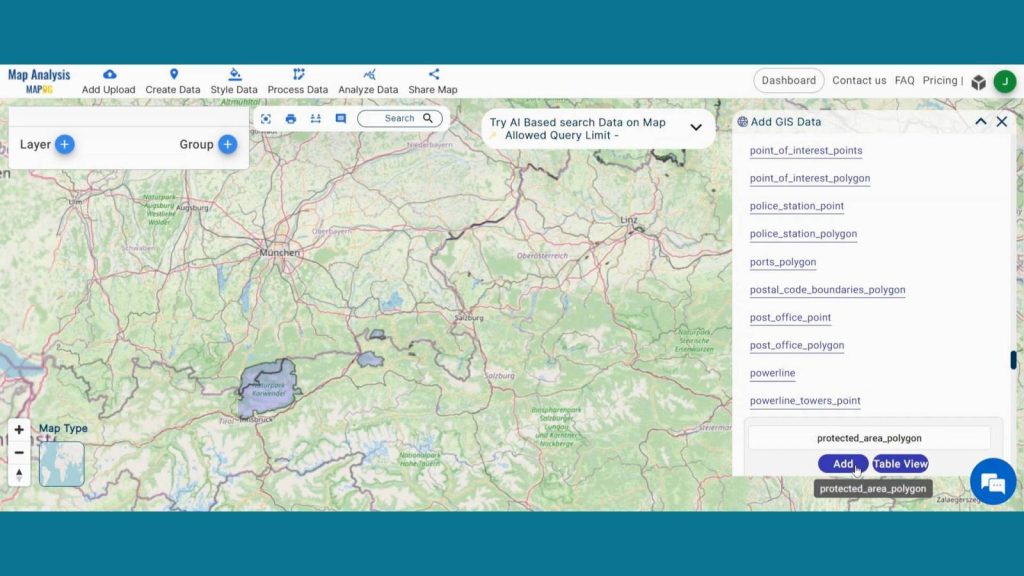
In the right corner box Provide the country name. Then, in the other layer option search for protected area layer and by clicking Add option add this layer to map canvas.
Step 2: Save Project
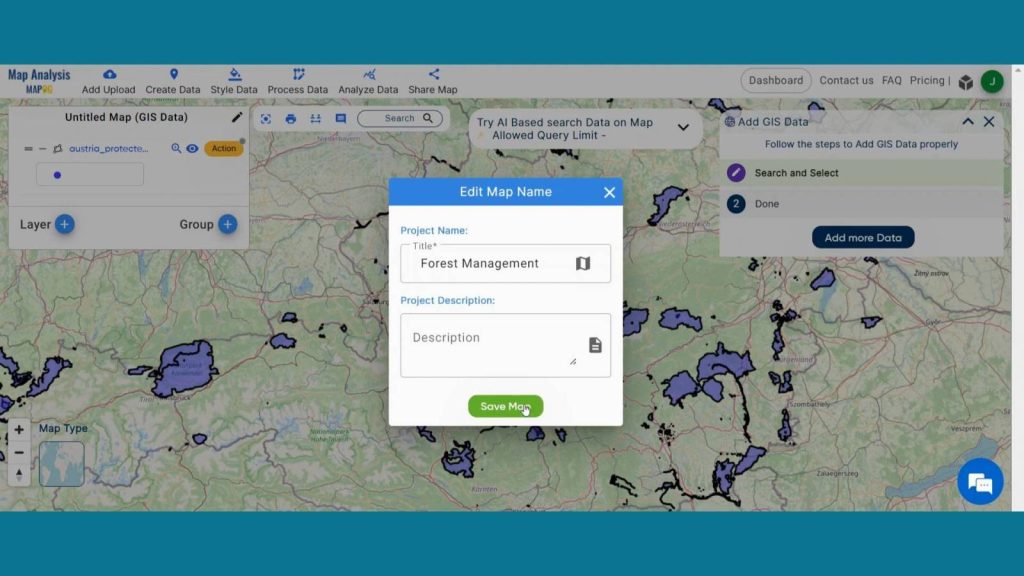
Now, click on the pencil icon situated right after the “Untitled Map” text to save the project. In the dialogue box write proper name and description that describe the project accurately. And click on save map option. Your project will be saved.
Step 3: Clip Protected Area
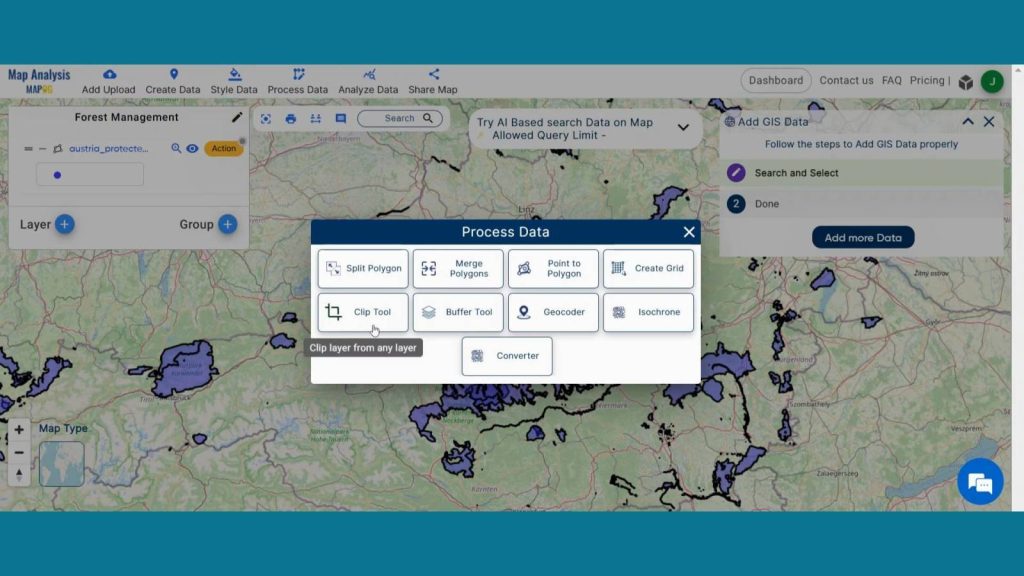
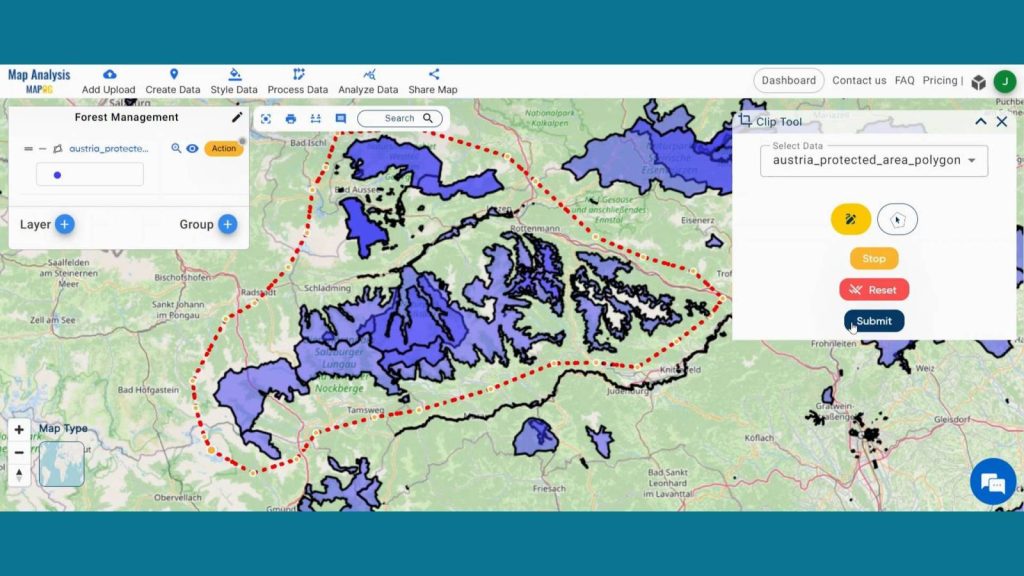
Now we are going to cut any particular Protected area using Clip Tool. To do that click on Process Data from header and click on Clip Tool.
In data selection select the Protected Area layer. Then click to start drawing Shape. Then click on submit. Your new layer will be added on map screen.
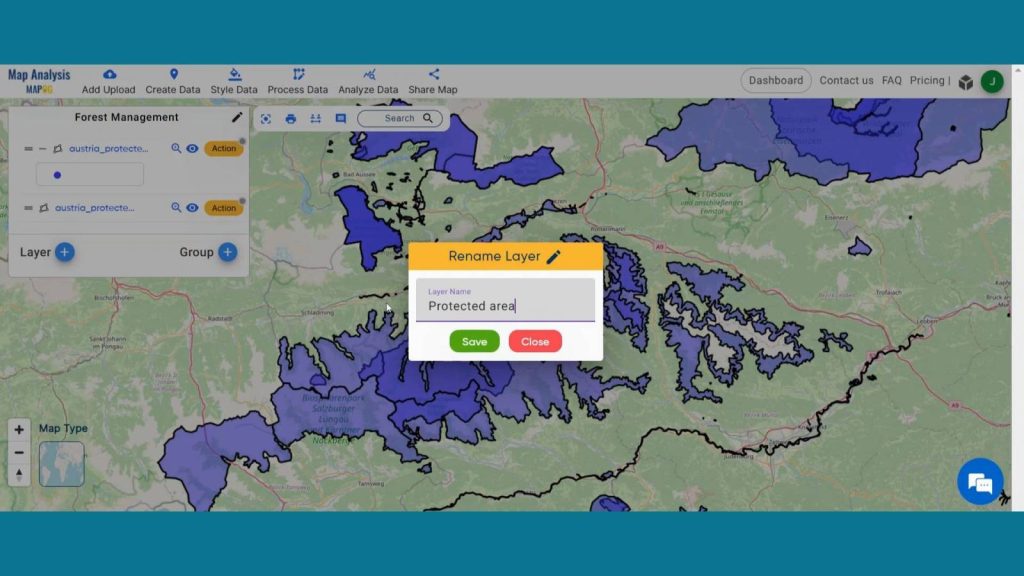
Go to the action button of the new clipped layer. Click on the pencil icon. Rename the layer for better understanding.
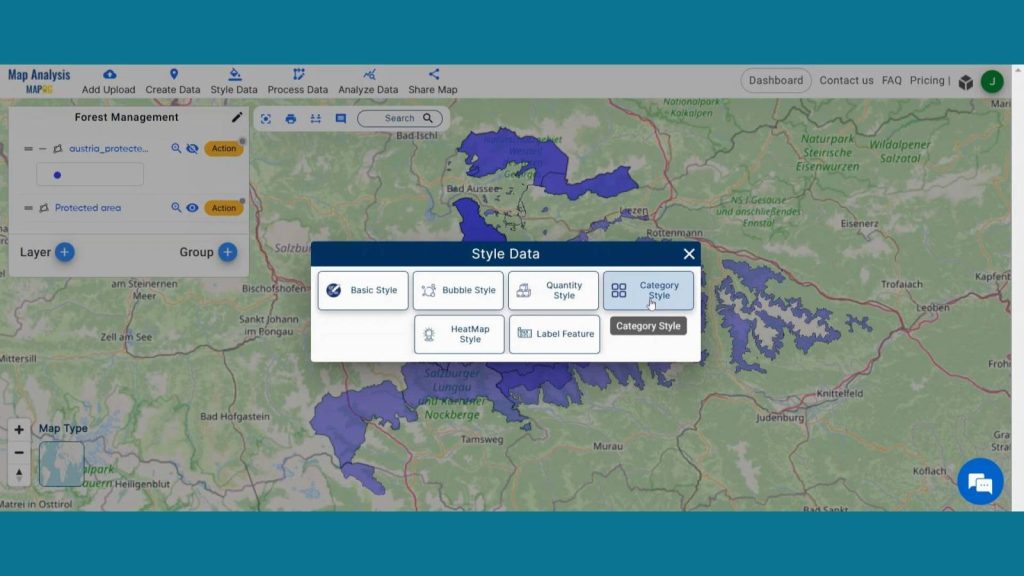
Step 4: Add Thematic Style
Enhance the visualization of New Clipped Protected Area and using style data option in the header. Click on Category style option.
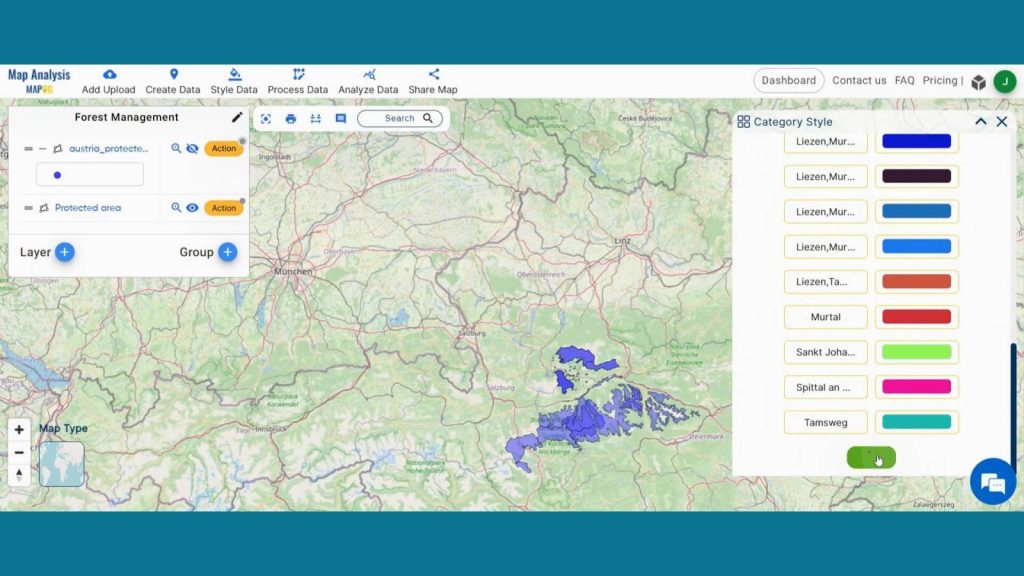
Next select the respected layer and Select Name attribute and provide suitable colors to them. Then save the style.
Step 5: Plan Manageable sections
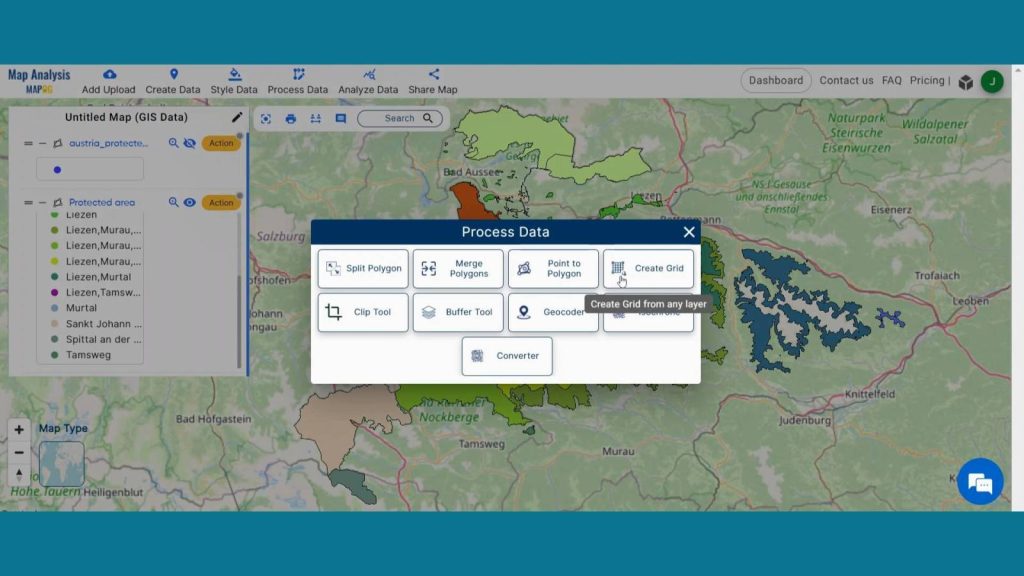
Now we are going to create grid for new Clipped Protected Area. To do that click on Process Data from header and click on Create Grid.
Create a sustainable future with landfill optimization using spatial analysis techniques. Dive into how buffers, split polygons, and grid creation revolutionize waste management strategies in “Create Map for Landfill Optimization: Spatial Analysis Approach”.
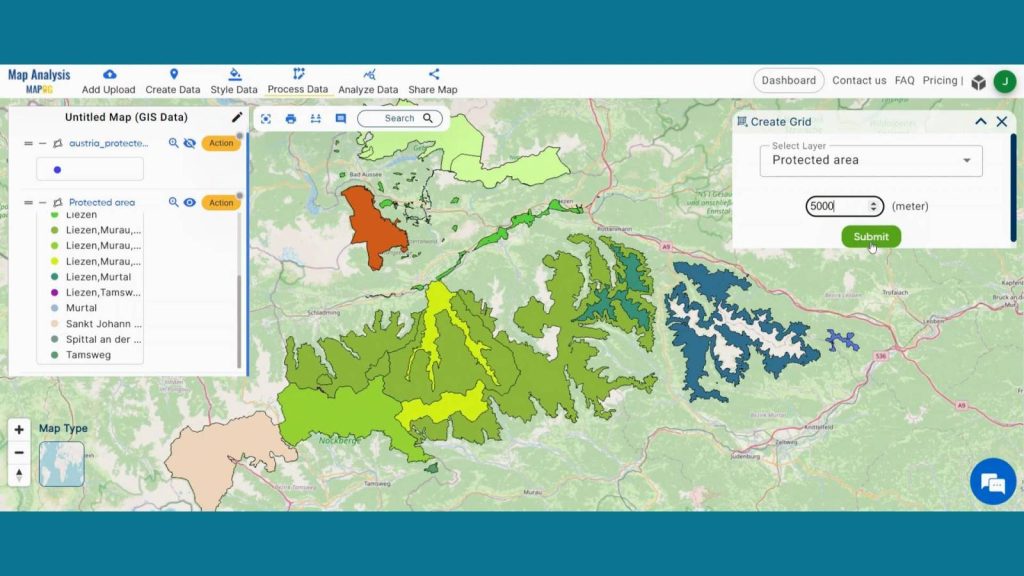
In Select layer section select the New Protected Area layer. Then select your desirable range of how large or small grid you want. Then click on submit. Your Grid layer will be added on map screen. Rename the layer for better understanding.
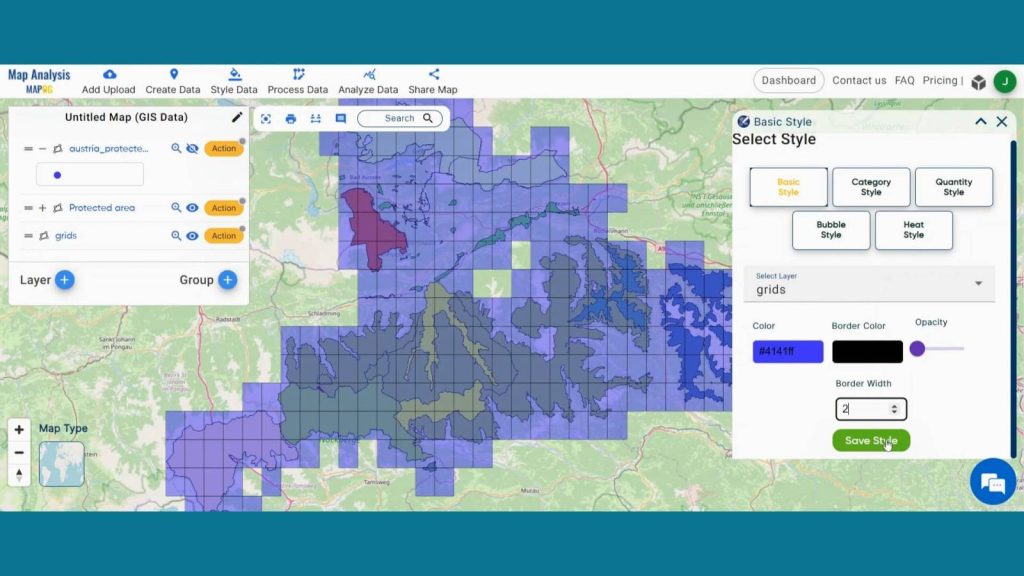
Step 6: Enhance visualization
Enhance the visualization of Grid Layer and using style data option in the header. Click on Basic style option, turn the opacity to zero so that we will be able to see the layer underneath it.
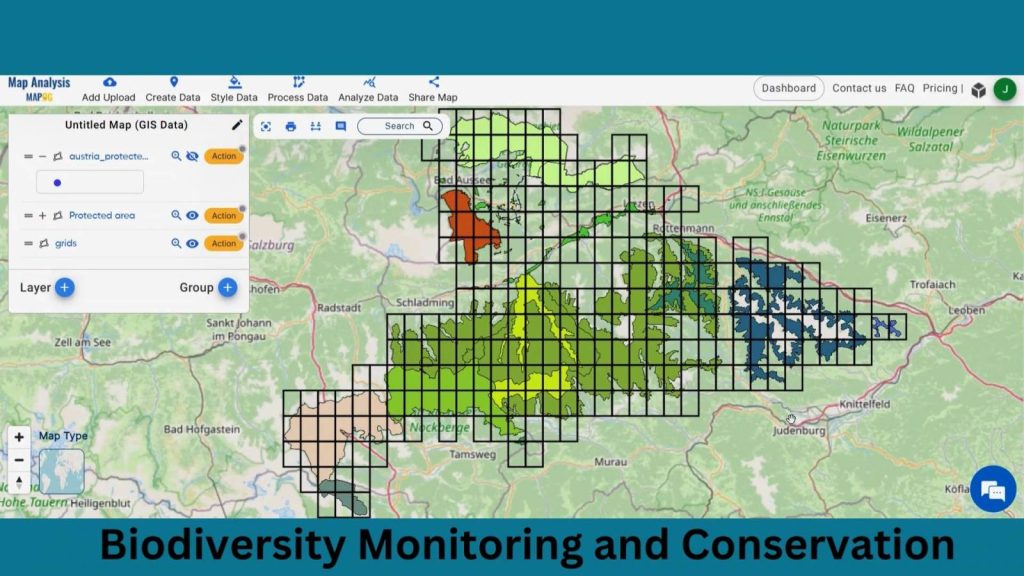
Step 7: Results & Analysis
With our map now enriched with details, let’s make those final adjustments. This grid system aids in systematic monitoring and assessment of various ecological parameters, such as vegetation health, water quality, or the presence of invasive species. It facilitates targeted conservation efforts based on localized data.
Major Findings
Enhanced Monitoring Precision: MAPOG facilitates finer-scale monitoring, enabling conservation teams to pinpoint biodiversity hotspots and prioritize conservation efforts effectively.
Improved Resource Allocation: By dividing protected areas into manageable sections, MAPOG optimizes resource allocation, ensuring that conservation efforts are targeted where they are most needed, thus maximizing impact.
Increased Stakeholder Engagement: The use of MAPOG fosters greater stakeholder involvement by providing accessible, real-time data on conservation progress, fostering collaboration among diverse stakeholders for more effective biodiversity preservation.
Domain and Industry
This map is a powerful tool for Effective Resource Allocation, Data-Driven Decision Making, Adaptive Management and beyond.
Explore the forefront of forest fire analysis with the Buffer Tool! Delve into how this technique identifies risk areas, empowering proactive measures for forest conservation and community safety in “Analysis of Forest Fire and Map Risk Areas with Buffer Tool”
Questions
1. How does MAPOG utilize GIS technology to clip and delineate specific boundaries within a protected area for more effective management?
2. What are the key GIS techniques employed by conservation teams to divide the protected area into smaller, manageable sections using MAPOG?
3. How does the use of GIS-based tools like MAPOG enhance the precision and accuracy of biodiversity monitoring within segmented areas of a protected region?
4. Can MAPOG’s GIS functionalities facilitate the identification of biodiversity hotspots within the divided sections of a protected area, aiding in targeted conservation efforts?
Conclusion
In conclusion, the integration of MAPOG in biodiversity monitoring and conservation revolutionizes conservation practices. By dividing protected areas into smaller, manageable sections, MAPOG enhances precision, optimizes resource allocation, and fosters stakeholder engagement. Embracing such innovative tools is paramount in ensuring the sustainable preservation of our planet’s invaluable biodiversity.
LINKS FOR THE DATA 👍
Here are some other blogs you might be interested in