In our quest for cleaner energy, Quantity Style mapping is invaluable. It pinpoints where wind and solar power can flourish, guiding us towards a greener future. With its insights, we can make informed decisions for sustainability, mapping our way to a brighter tomorrow.
Key Concept to Creating Quantity Style Map: Styling Natural Wealth
Quantity Style mapping is all about making complicated data easy to understand. It helps us see where renewable energy could be most effective without getting lost in the numbers. Additionally, insights from blogs such as GIS Analysis in Urban Planning: Reshaping Transportation Future Insights of state/city and Make Routes for Military Aerial Planning- Through Bearing angle and Distance calculation – Online Route Compass further enhance our understanding and application of spatial analysis techniques.
MAPOG Map Analysis, a simple tool designed to simplify the creation and interpretation of Quantity Style Map.
Utilizing Quantity Style for creating a Mountain Disaster Rescue Network follows a straightforward process, enabling stakeholders to strategize and implement efficient rescue missions.
Let’s outline the step-by-step procedure:
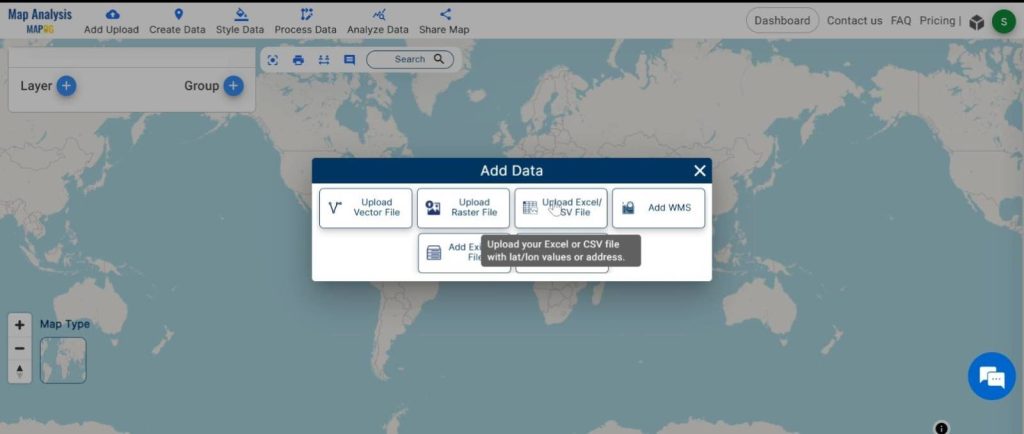
Step 1: Data Upload:
We’ll start by uploading our renewable energy data into the Quantity Style tool.
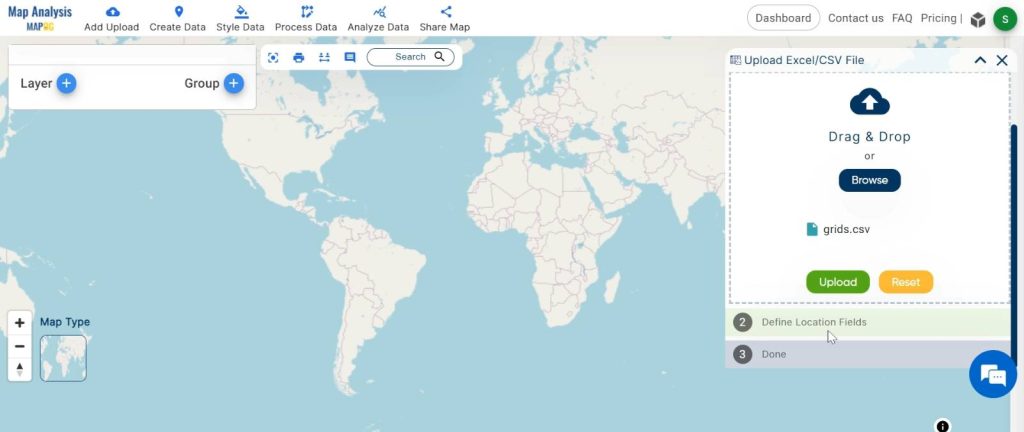
1.Click On the “Add Upload” button and choose the “Upload Excel/CSV File” option.
2.Select the csv file.
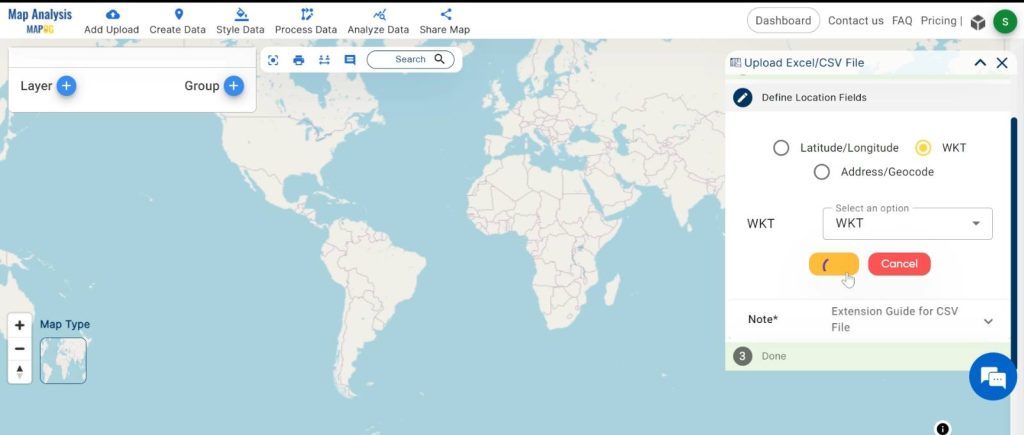
3. Choose the “WKT” option and click on the “Publish”.
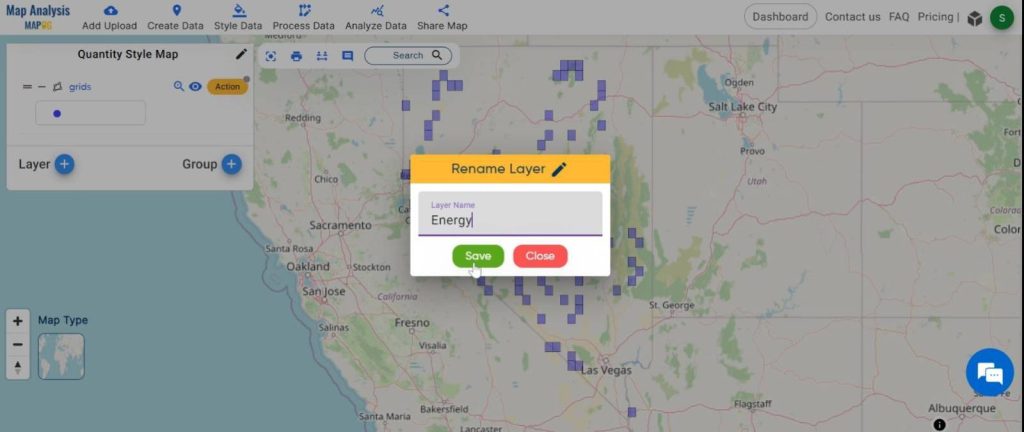
Step 2: Name the untitled map and Rename the layer:
1.Here you have to name the untitled map
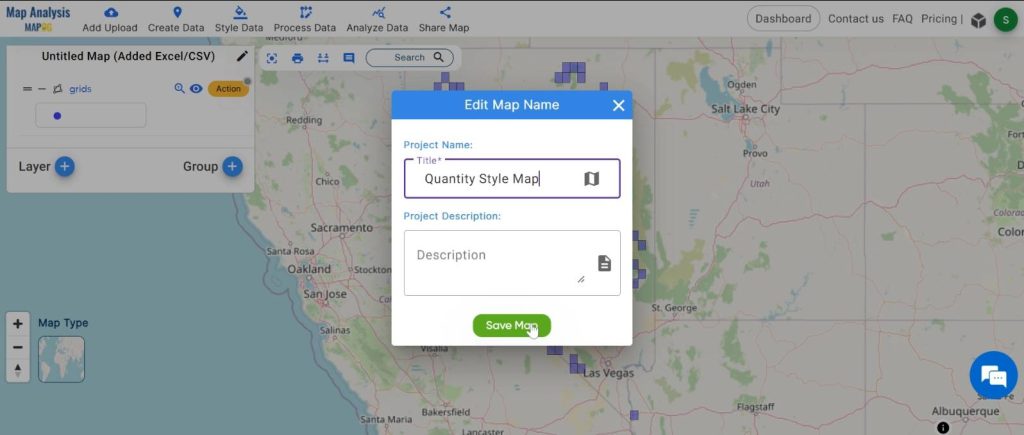
2.Rename the layer
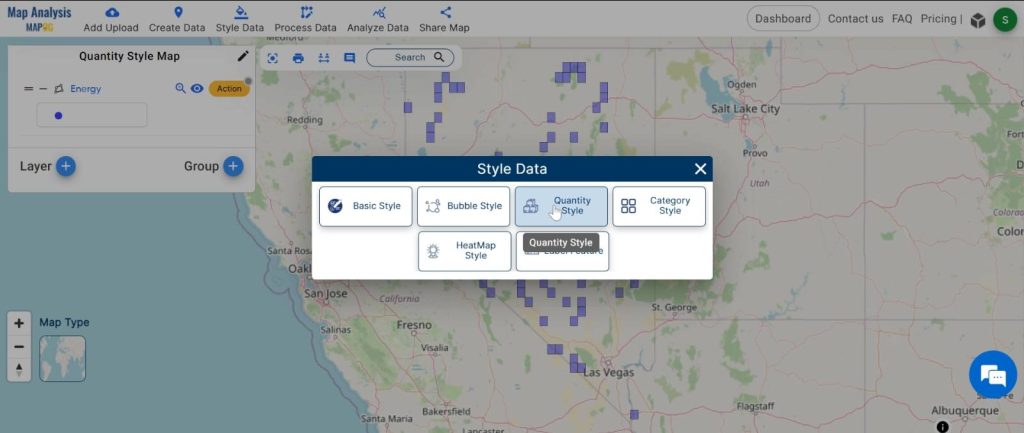
Step 3: Quantity Style Analysis:
Using Quantity Style, we’ll analyse the data to identify key trends and patterns related to renewable energy potential.
1.Click on the ‘Style Data‘ button and choose the “Quantity Style” option.
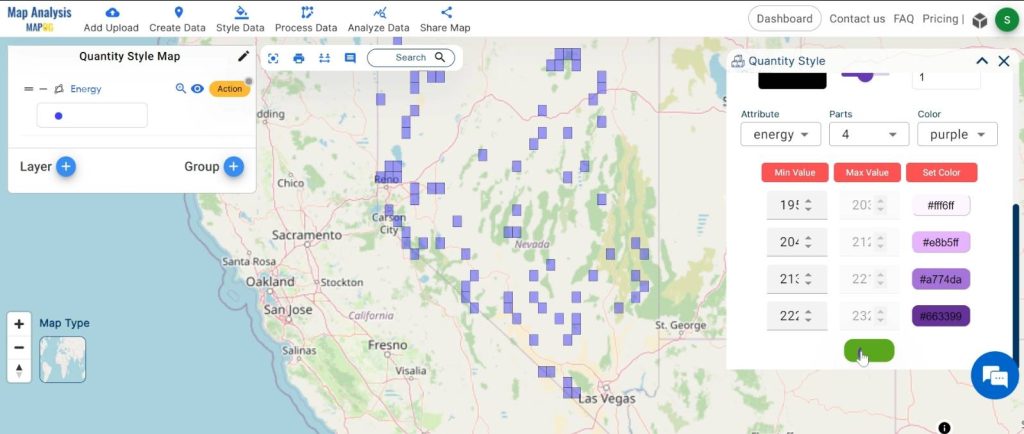
2.You can see the “Quantity Style” Tool successfully opened on the right side of the screen.
Here, select the layer. then change the colour and click on the “Save Style”.
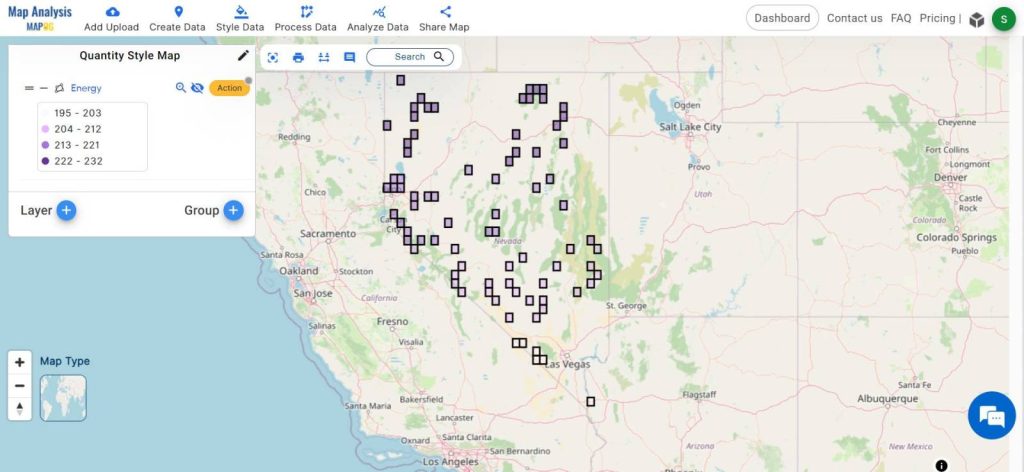
Major Findings:
Through Quantity Style mapping, we’ve pinpointed areas with great potential for renewable energy.
- Quantity Style mapping reveals areas ripe for renewable energy development.
- Identified areas where land use issues could hinder renewable projects.
- Despite challenges, numerous opportunities exist for scaling up renewable energy initiatives.
Domain and Industry:
This information isn’t just useful for scientists. It can help city planners, businesses, and others make smart decisions. By tapping into renewable energy, businesses can not only help the planet but also find new ways to grow.
With Quantity Style mapping, we’re unlocking the potential of renewable energy in a simple, straightforward way. By using this tool, we’re taking steps towards a cleaner, brighter future for everyone.
Exploring Our Previous Blogs:
- GIS Analysis in Urban Planning: Reshaping Transportation Future Insights of state/city
- Make Routes for Military Aerial Planning- Through Bearing angle and Distance calculation – Online Route Compass
- Create Map for Real Estate Developer for Best Site Selection
- Create Map for Analyzing Water Quality using Heat Map Style
- Create Map on Literacy Rate