In the realm of geographic information systems (GIS), effective color mapping plays a pivotal role in conveying complex data with clarity. One such tool that significantly enhances the color mapping process is the category styling option in MAPOG. This feature allows users to assign distinct colors to different categories, facilitating better understanding and interpretation of geographical data. Its importance cannot be overstated, as it enables users to visualize intricate patterns and trends, thereby aiding informed decision-making in various domains.
Additionally, insights from blogs such as GIS Analysis in Create Map for Analyzing Water Quality using Heat Map Style, Create map online | Mapping Education Institute Places | Category Style based on type further enhance our understanding and application of spatial analysis techniques. further enhance our understanding and application of spatial analysis techniques.
The Article on Digitalization of Road Networks by Drawing Line on Map allows you to explore more with MAPOG.
Key Concept for State-Wise Color Mapping
At the core of state-wise color mapping lies the category styling option of MAPOG. By leveraging this tool, users can assign unique colors to different states or regions, facilitating clear differentiation and enhancing the visual appeal of maps. This approach not only simplifies data interpretation but also fosters effective communication of findings. The link for GIS data is available at the end of this article.
Steps for State-Wise Color Mapping
Step 1 Upload the data
Navigating to the MAPOG map analysis tool, add the GIS data for our needs.
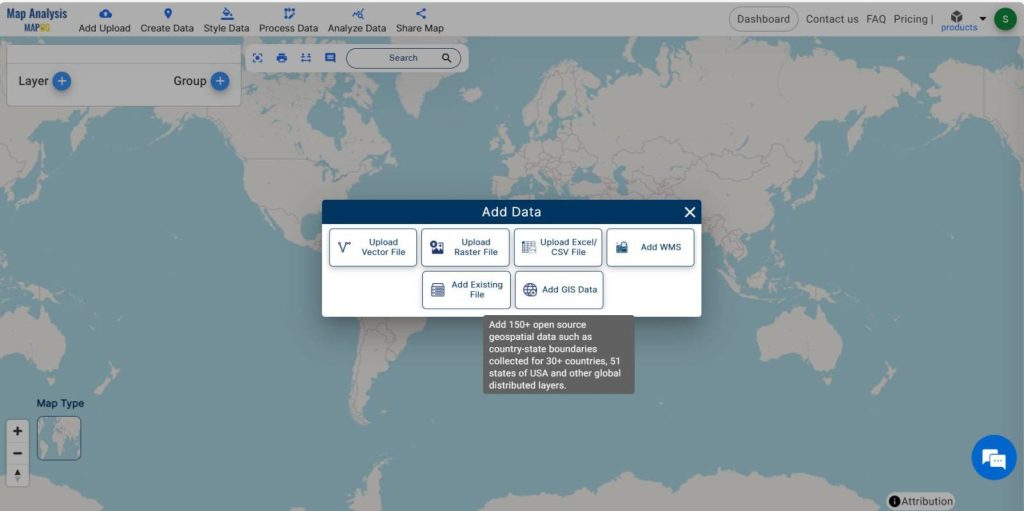
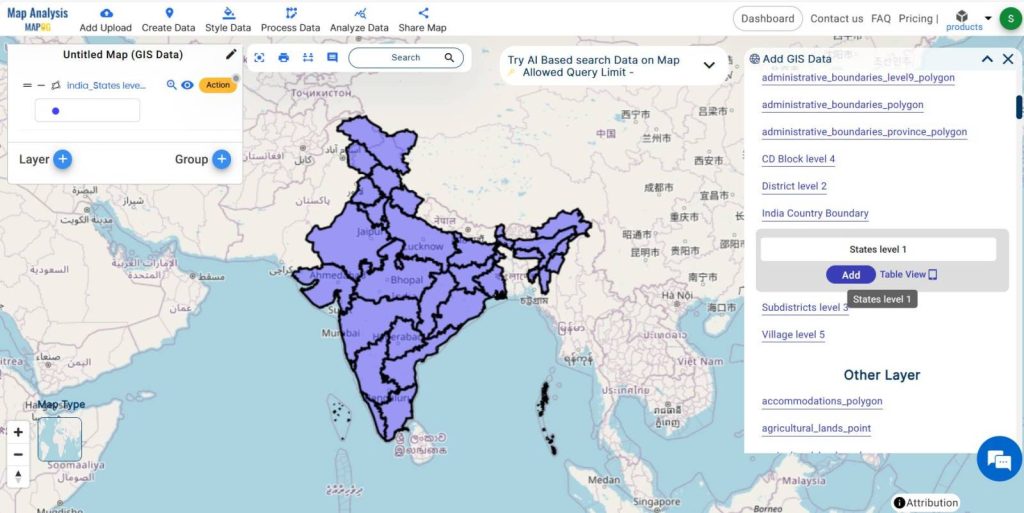
Transitioning to the MAPOG Map analysis tool, proceed to the Add Upload option, then select Add GIS Data and choose a country. Afterwards, scroll down to locate the state-level data and add it to the layer. If possessing data for the region of study, proceed to upload the data to MAPOG as an excel file, vector file, or raster file.
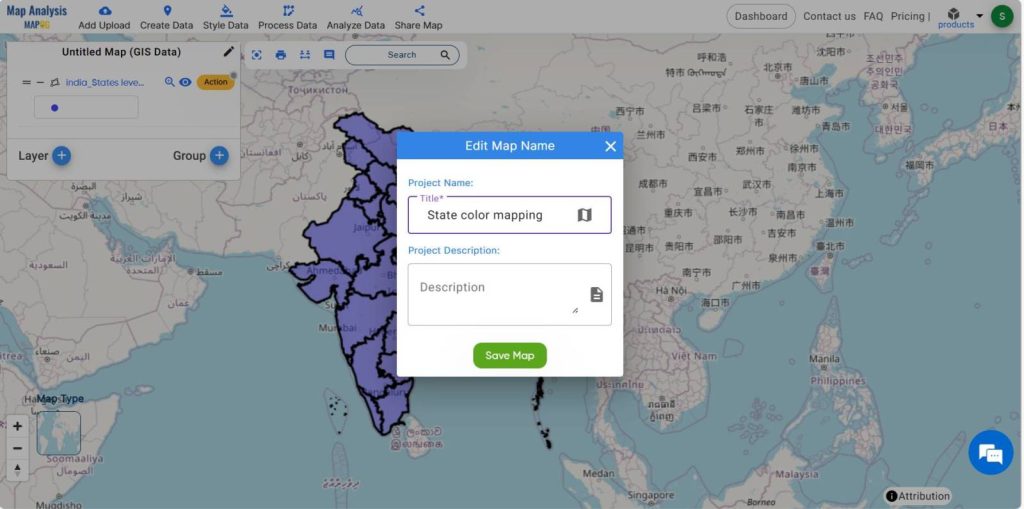
Step 2 Project Title
Click on the action button to check the data tables and change the layer name for better understanding. Give the title of the project instead of an untitled one. You can also provide a description of your project in the description box.
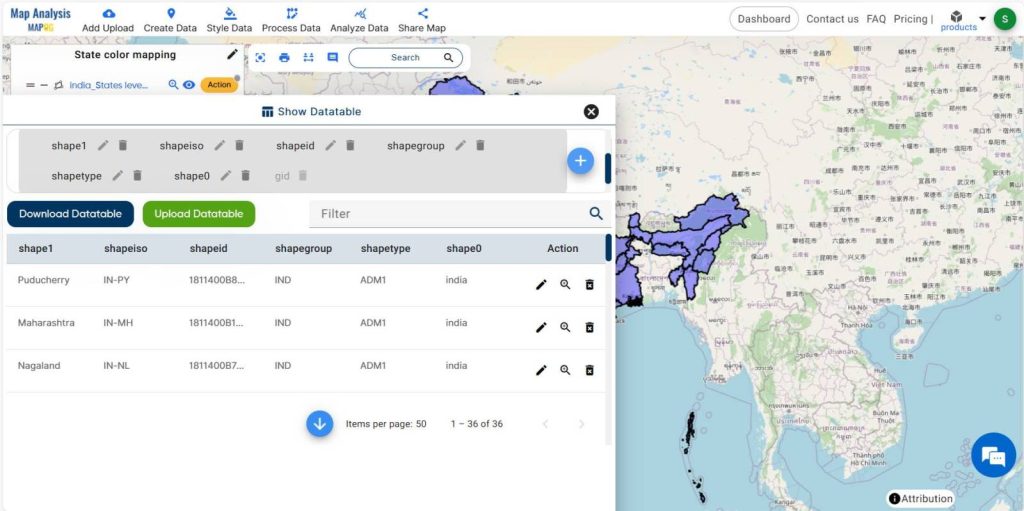
Step -3 Data Table
Click on the action button and check on the show data table option to get more details .
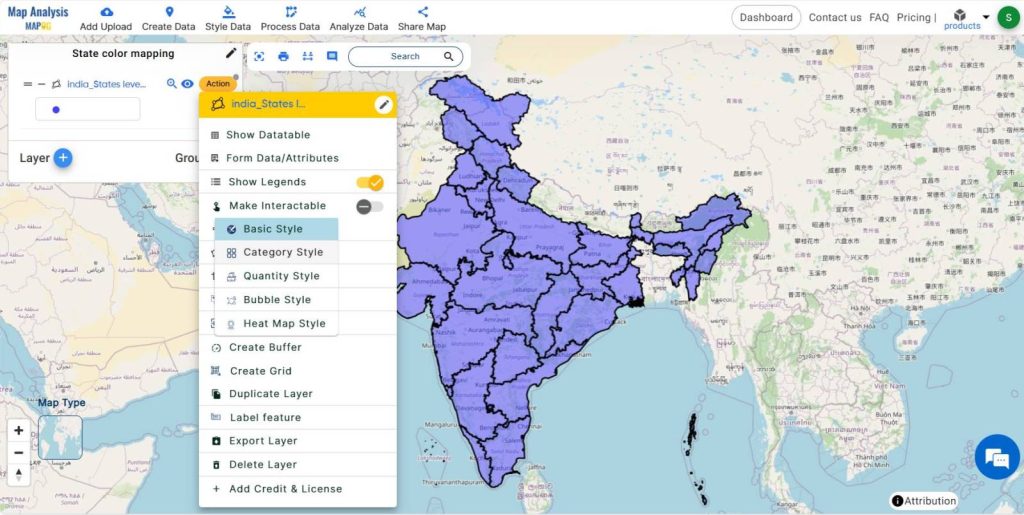
Step -4 Styling
To visualize the accommodation data based upon the area, move on to the action button associated with the data layer, then select the category style.
Choose the data layer, then adjust the border color, width, and opacity according to our requirements.
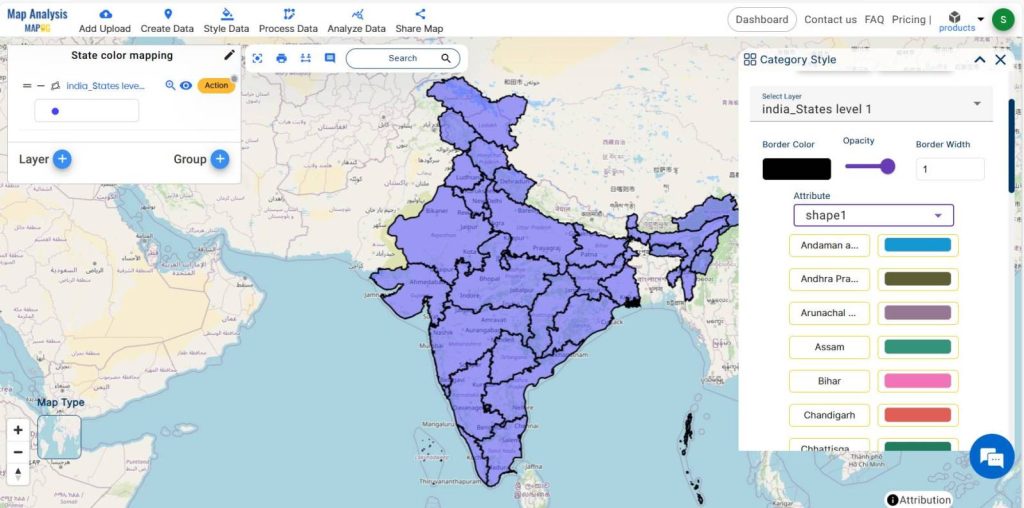
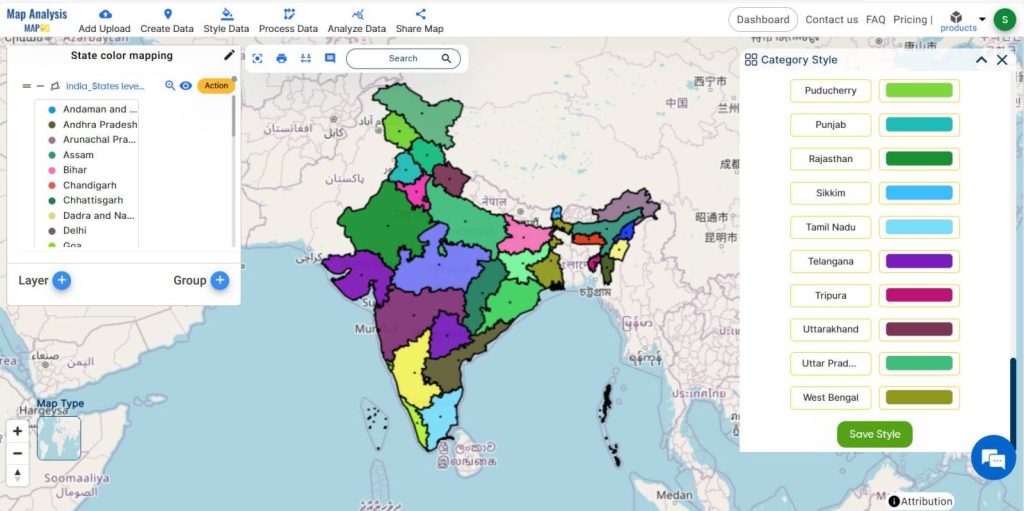
Select the attribute as “shape 1″(which indicates the name of states) and configure the color gradients before submitting it.
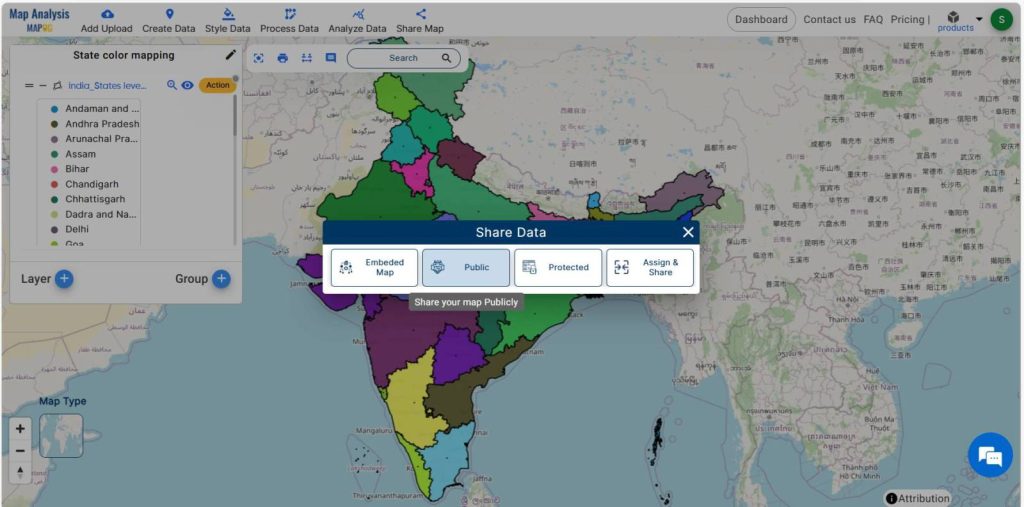
Step 6- Share the map
Share this map to the public using the share data menu.
Major Findings
- Enhanced Visual Clarity
- Facilitates Comparative Analysis
- Improved Communication
- Supports Decision-Making
- Engages Stakeholder
Domain and Industry
The application of state-wise color mapping with category styling option in MAPOG finds extensive utility in the domain of urban planning. Urban planners rely on accurate and visually appealing maps to make informed decisions regarding infrastructure development, zoning regulations, and resource allocation. By utilizing MAPOG‘s category styling tool, urban planners can create maps that effectively communicate spatial information, aiding in the planning and management of urban environments.
For more application of MAPOG in urban planning, go through the article- GIS Analysis in Urban Planning: Reshaping Transportation Future Insights of state/city
Conclusion
In conclusion, the category styling option in MAPOG revolutionizes the state-wise color mapping process, offering a versatile tool for visualizing geographical data. Its ability to enhance clarity, facilitate interpretation, and streamline communication makes it indispensable in various domains, particularly urban planning.
GIS Data Links-State level data