Category style, a fundamental feature within Geographic Information Systems (GIS), serves as a powerful tool for visually organizing data categories. By assigning distinct visual attributes such as colors, shapes, or icons to different data categories, category style enhances the clarity and interpretability of spatial data representations. In this article, we delve into the application of category style in GIS, particularly focusing on its benefits in mapping the educational sector. Utilizing MAPOG, a cutting-edge GIS platform, “Create map online | Mapping Education Institute Places | Category Style based on type.”
Key Concepts:
Category style in GIS provides a powerful way to visually organize and differentiate data categories, enhancing clarity and interpretation. Incorporated within MAPOG, it simplifies the analysis of complex datasets, particularly in mapping the educational sector, facilitating informed decision-making by stakeholders. Required data links are given below. Check our other blog “Mapping Population Data: Analyzing through bubble styling “.
Process:
Step 1:
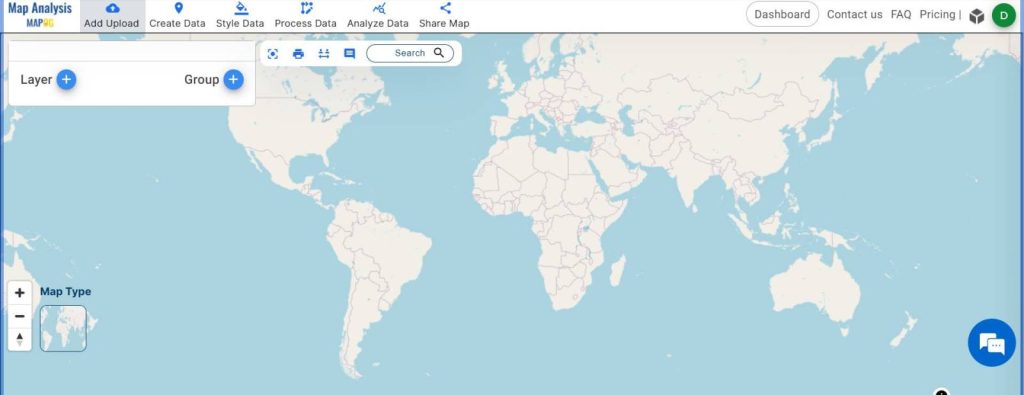
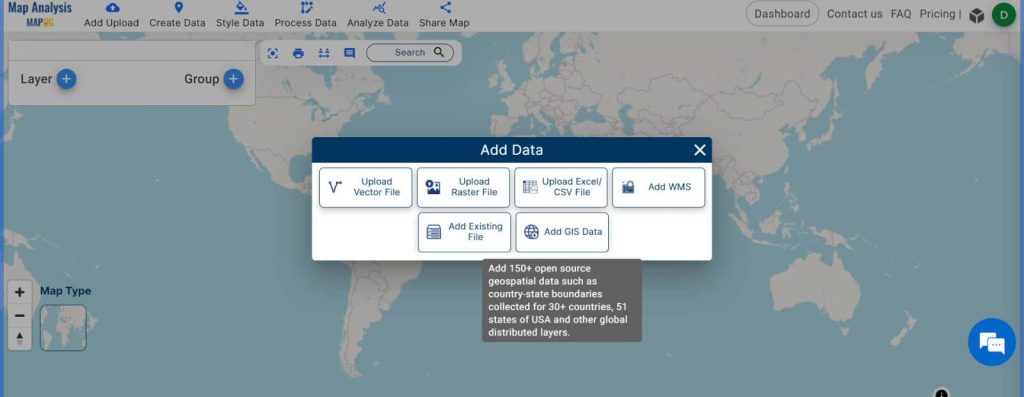
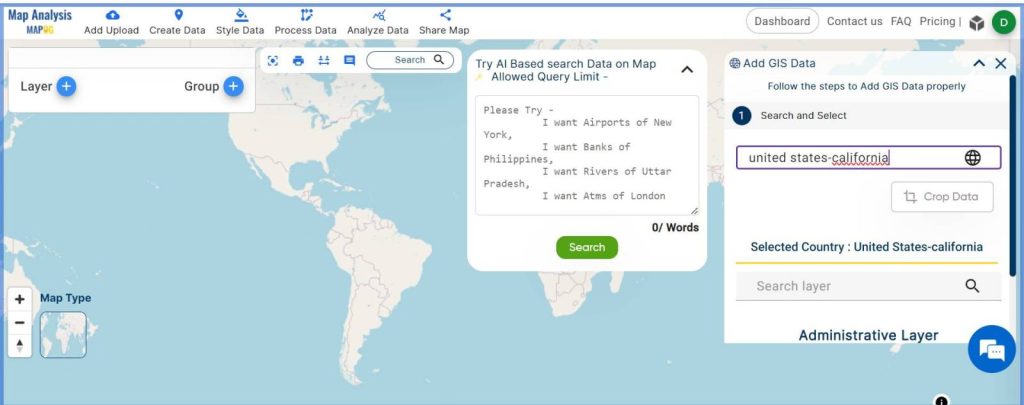
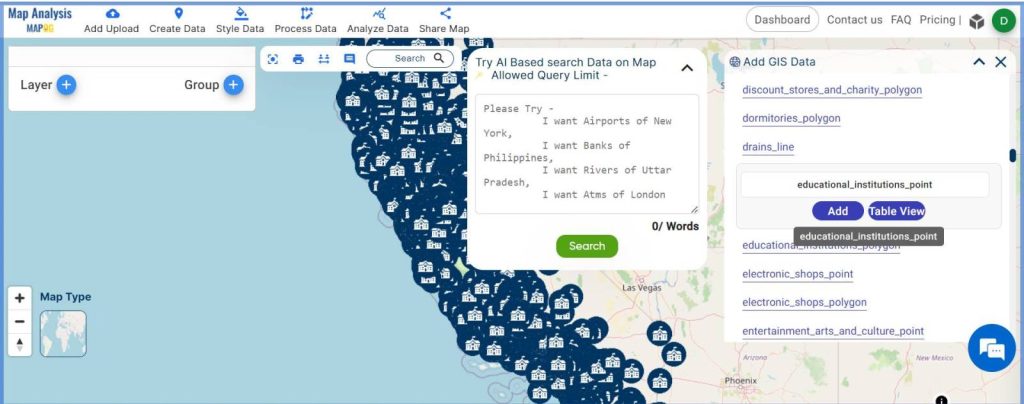
Open the MAPOG Map Analysis interface. Navigate to ‘Add Upload’ to incorporate educational institution data. Select ‘Add GIS Data’ and choose the country of interest. Enter the country name first and select the educational institution point data to add.
Step 2:
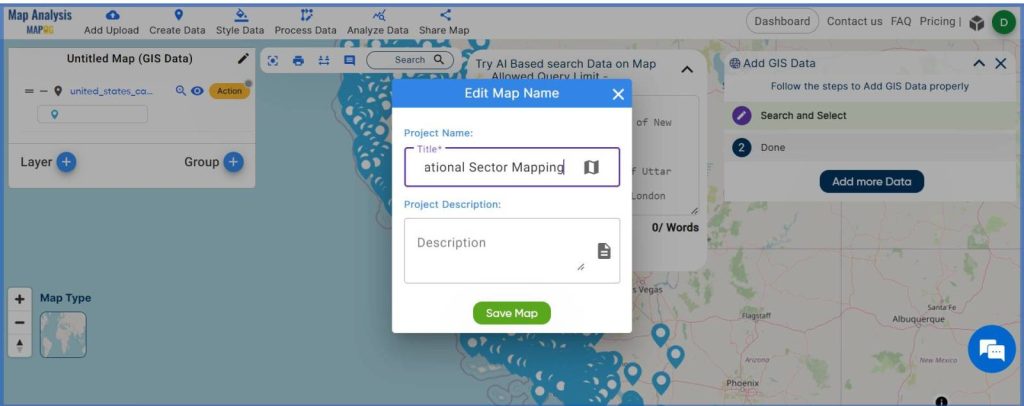
Give the Untitled Map a name from “Edit Map Name”, and “Save Map”.
Step 3:
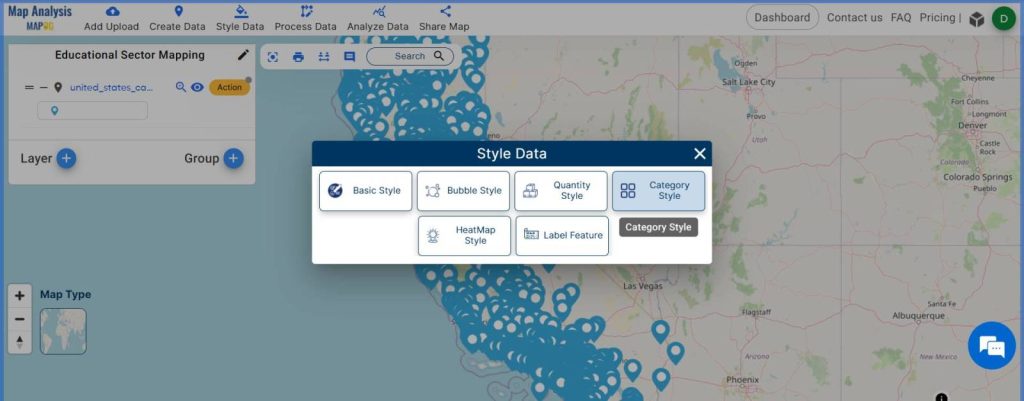
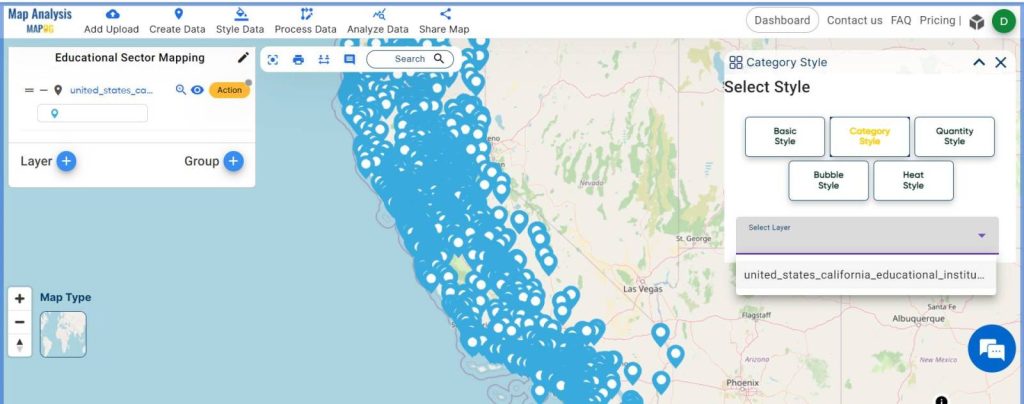
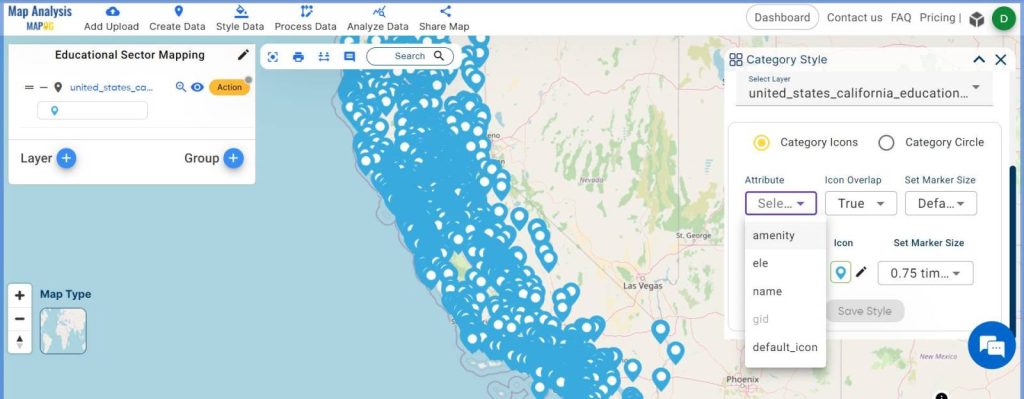
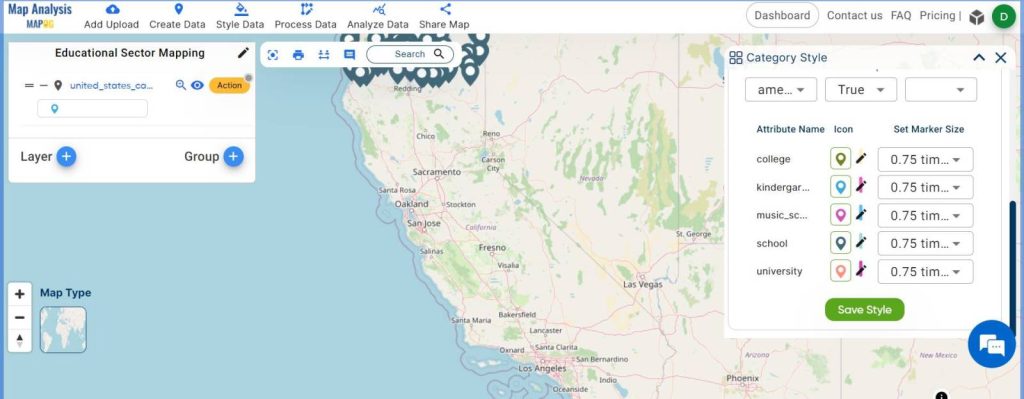
Now incorporate category style for better interpretation. First, access ‘Style Data’ from the menu toolbar and choose ‘Category Style’. Select the layer first and then select the option of Icon or Circle for styling. For this particular use case, select Icon for better understanding. Now Choose the attribute to categorize the data based on different educational institutions or sectors. Customize the icon and set its size. After Customization, click ‘Save Style’.
Step 4:
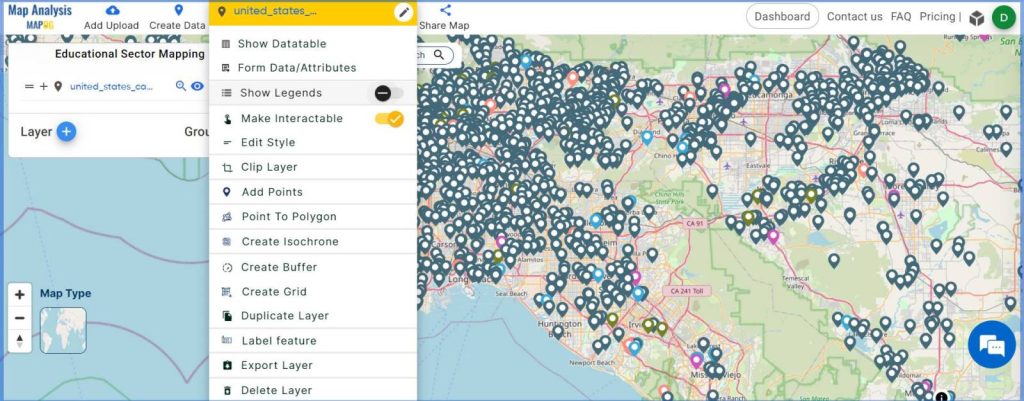
Go to the “Action” button from the layer, then switch on the label feature.
Step 5:
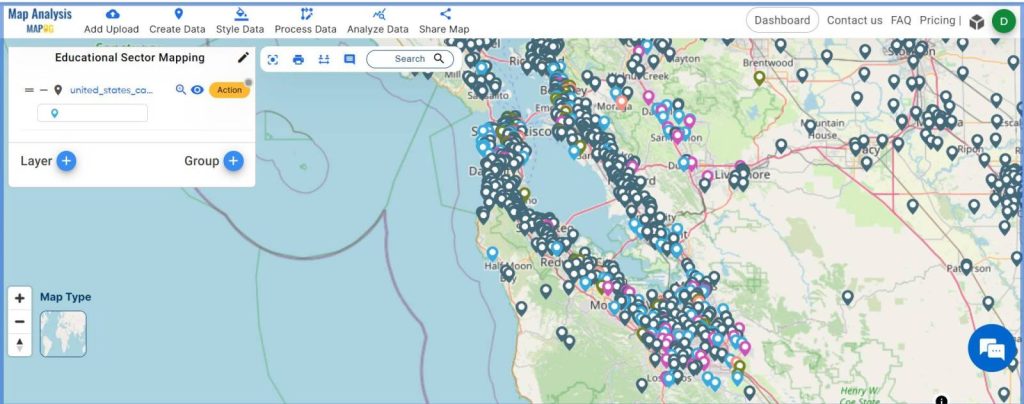
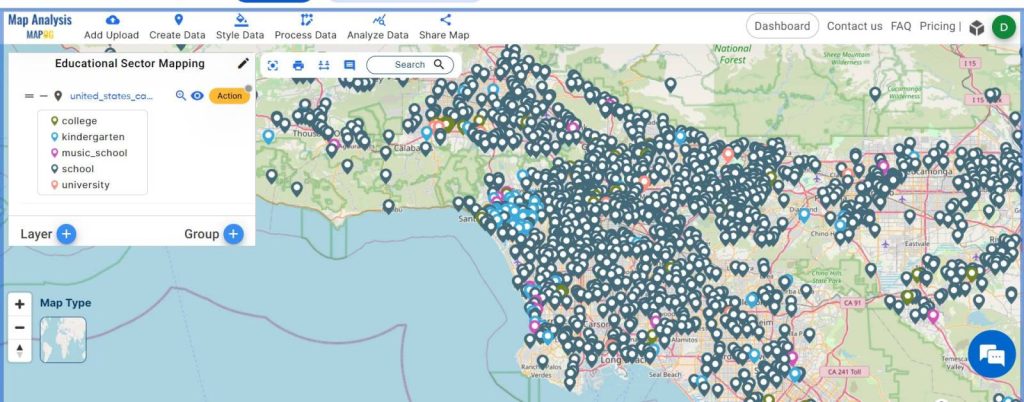
The final map is now ready for interpretation and analysis. It displays various educational sectors, including schools, colleges, universities, music schools, and kindergartens, each represented by distinct colored icons for clear identification and interpretation with the help of category style.
Major Findings of Create map online | Mapping Education Institute Places | Category Style based on type:
- Enhanced Interpretation: Category style simplifies the interpretation of educational sector data, making it easier to identify and analyze different types of institutions.
- Improved Decision-Making: Visual representations facilitate better-informed decisions for urban planners, policymakers, and educational stakeholders.
- Accessibility Insights: The mapped data provides insights into the distribution and accessibility of educational facilities within a region, aiding in resource allocation and infrastructure development.
Industry and Domain:
The application of category style in educational sector mapping caters to various stakeholders__
- Education Sector: Enables educational institutions to assess their spatial distribution and plan expansion strategies.
- Urban Planners: Facilitates urban planning by identifying areas with gaps in educational infrastructure.
- Policymakers: Informs policy decisions related to education funding, zoning regulations, and community development.
Conclusion for Create map online | Mapping Education Institute Places | Category Style based on type:
Category style emerges as a powerful tool within GIS. By effectively organizing and visually representing any data (like Educational Data), it enhances spatial understanding and supports informed decision-making processes. MAPOG always guides you to utilize category style for your projects.
Links to the data:
Other Articles:
1 thought on “Create map online | Mapping Education Institute Places | Category Style based on type”