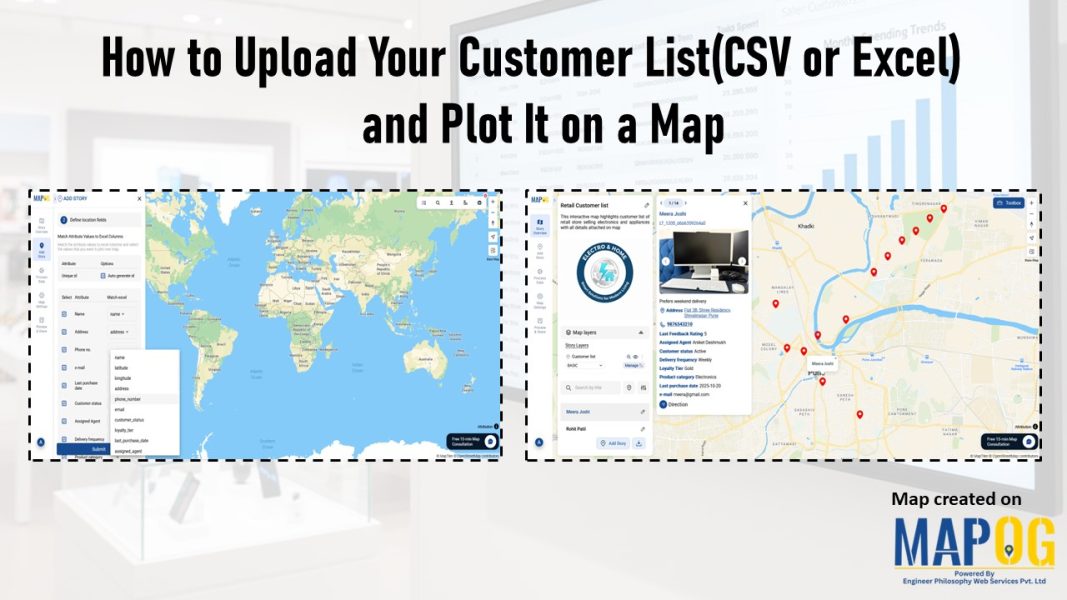
Integrating Population and Literacy Data Using Attribute Join for Better Insights
Utilizing attribute join tool-Integrate population and literacy rate data-Using a common attribute to do the joining process.
Unveil the power of precision in GIS with MAPOG’s Split Polygon by Line tool. Explore how this innovative feature revolutionizes polygon splitting, facilitating nuanced analysis and insightful mapping with ease and accuracy. KEY CONCEPTS Our goal is to split the Polygons using the split-by-line tool from MAPOG Map Analysis. Learn more about the analyses using … Read more
Spatial Join analysis unveils hidden insights by merging geographic data, revealing patterns and correlations crucial for informed decisions.
Thematic Mapping for Data Analysis is a powerful technique used to visualize complex datasets by representing geographic patterns through color-coded maps and scalable symbols. One of the most effective methods in thematic mapping is Bubble Thematic Mapping, where data points are displayed as bubbles of varying sizes, proportional to a specific attribute such as population … Read more
In Geographic Information Systems (GIS), a polygon is a fundamental geometric shape used to represent closed areas on maps. Polygons in GIS are comprised of connected straight-line segments, delineating the boundaries of geographic features, including land parcels, lakes, and administrative regions. These two-dimensional shapes facilitate spatial analysis, mapping, and visualization of geographical data, playing a … Read more
By identifying crucial junctions with human infrastructure, “Wildlife Corridor Planning using Cross Intersection in MAPOG” guarantees safe animal migration and habitat connectivity. This strategy protects biodiversity while reducing conflict. Key Concepts MAPOG’s Cross Intersection tool enables conservationists and planners to pinpoint critical intersections where wildlife corridors intersect infrastructure, enabling targeted mitigation strategies. Download MAPOG App … Read more
In the quest to enhance health care service delivery, GIS provides a robust platform for mapping and analyzing health care services across different regions. Utilizing grid-based mapping techniques in GIS allows for a detailed. The equal-area analysis of service distribution with highlighting areas. Mapping Health Care Services: Utilizing Grid Tools in GIS, This article outlines … Read more
Choosing the perfect spot for your retail shop can make all the difference. With MAPOG Map Analysis, you can use the Isochrone tool to identify areas with the best customer accessibility. Isochrone maps help you visualize travel times, ensuring you find locations that maximize foot traffic and sales potential. Explore smarter site selection with MAPOG’s … Read more
The difficulty of visualizing and analyzing earnings data is addressed in “Easy Income Analysis Using Thematic Maps for County-Wise Insights,” where we use quantity thematic styling to depict earnings across several geographic counties. Key Concepts Using quantity thematic design to visually display the income distribution across geographic blocks, the county-Wise Earnings Analysis in MAPOG offers … Read more
Discover The Travel Map: simplifying travel with reliable navigation. MAPOG’s accolades highlight its transformative impact on seamless exploration worldwide.